. 2023 May 2:14:1148037.
doi: 10.3389/fimmu.2023.1148037. eCollection 2023.

Type I and III interferons shape the retinal cytokine network and barrier function in an in vitro model of ocular toxoplasmosis

Affiliations

Type I and III interferons shape the retinal cytokine network and barrier function in an in vitro model of ocular toxoplasmosis

Benjamin Geiller et al. Front Immunol. .

Abstract

Introduction: The particularities of the ocular immune environment and its barrier protection in the context of infection are not well elucidated. The apicomplexan parasite Toxoplasma gondii is one of the pathogens successfully crossing this barrier and establishing chronic infection in retinal cells.

Methods: As a first approach, we studied the initial cytokine network in vitro in four human cell lines: Retinal pigmented epithelial (RPE), microglial, astrocytic and Müller cells. Furthermore, we looked at the consequences of retinal infection on the integrity of the outer blood-retina barrier (oBRB). We particularly focused on the roles of type I and type III interferons, (IFN-β and IFN-λ). Especially IFN-λ is known for its significant role in barrier defense. However, its effect on the retinal barrier or T. gondii infection remains unexplored, unlike IFN-γ, which has been extensively studied in this context.

Results and discussion: Here, we show that stimulation with type I and III interferons did not limit parasite proliferation in retinal cells we tested. However, IFN-β and IFN-γ strongly induced inflammatory or cell-attracting cytokine production, whereas IFN-λ1 showed less inflammatory activity. Concomitant T. gondii infection influenced these cytokine patterns, distinctly depending on the parasite strain. Interestingly, all these cells could be stimulated to produce IFN-λ1. Using an in vitro oBRB model based on RPE cells, we observed that interferon stimulation strengthened membrane localization of the tight junction protein ZO-1 and enhanced their barrier function, in a STAT1-independent manner.

Conclusion: Together, our model shows how T. gondii infection shapes the retinal cytokine network and barrier function, and demonstrates the role of type I and type III interferons in these processes.

Keywords: Toxoplasma gondii; barrier function; inflammation; interferons; ocular immunology; retina; tight junctions.


Conflict of interest statement

The authors declare that the research was conducted in the absence of any commercial or financial relationships that could be construed as a potential conflict of interest.

Figures

Figure 1
Figure 1
The four cell lines express IFNLR1 receptor subunit. (A) Confocal microscopy image of RPE, astrocytes, microglia and Müller cells. Cells were plated on cover slides for 24h. The cells were then fixed, permeabilized and the IFNLR1 subunit and cell nuclei labeled with AlexaFLuor488 and Hoechst 33342, respectively. (B) Flow cytometry assay for IFNLR1 receptor subunit. Cells were harvested by trypsination and placed 24h under agitation to restore membranous receptor expression. Finally, they were labeled and analyzed as described in Material and Methods.
Figure 2
Figure 2
Type II, but not type I and III interferons inhibit parasite proliferation. Cells were stimulated for 24 hours with 20g/mL of indicated interferons before being infected by RH or Me49 T. gondii strain at a MOI of 1:10. Proliferation is calculated as fold changes between parasite numbers at 2h p.i (RH) and 3h p.i (Me49) (invasion), compared to 24hpi and 48hpi, respectively (proliferation), as determined by qPCR. Results are expressed as means ± SEM, n=4. The experiment was repeated 3 times independently with similar results. ns: non significative, * P<0.05, ** P<0.01, *** P<0.001, compared to PBS control.
Figure 3
Figure 3
RPE cytokine secretion is differentially modified in a parasite strain and interferon type dependent manner. Cells were stimulated with 20ng/mL IFN-β, IFN-γ, IFN-λ1, as indicated, and/or infected with T. gondii RH or Me49 (MOI 1:1) for 20h. Cell culture supernatant was recovered and 14 cytokines were dosed (IL-1β et α, IL-23, IL-12p70, TNF-α, IL-6, IFN-β, IL-29, IL-10, IL-17A, CXCL10, CXCL8, CXCL9, CCL2). Only cytokines showing levels ≥ 10pg/mL in at least one condition are shown. Each group, non-infected (white), RH infected (blue) and Me49 infected (green) is compared to its independent non-infected/non-stimulated control. Results are means ± SEM of 2 independent experiments. * P<0.05; ** P<0.01; *** P<0.001; **** P<0.0001.
Figure 4
Figure 4
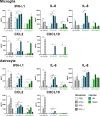
Microglia and Astrocyte cytokine secretion is differentially modified in a parasite strain and interferon type dependent manner. Cells were stimulated with 20ng/mL IFN-β, IFN-γ, IFN-λ1, as indicated, and/or infected with T. gondii RH or Me49 (MOI 1:1) for 20h. Cell culture supernatant was recovered and 14 cytokines were dosed (same as in Figure 3 ). Results are means ± SEM of 2 independent experiments. Each group, non-infected (white), RH infected (blue) and Me49 infected (green) is compared to its independent non-infected/non-stimulated control. Results are means ± SEM of 2 independent experiments. * P<0.05; ** P<0.01; *** P<0.001; **** P<0.0001.
Figure 5
Figure 5
Müller cytokine secretion is differentially modified in a parasite strain and interferon type dependent manner. Cells were stimulated with 20ng/mL IFN-β, IFN-γ, IFN-λ1, as indicated, and/or infected with T. gondii RH or Me49 (MOI 1:1) for 20h. Cell culture supernatant was recovered and 14 cytokines were dosed (same as in Figure 3 ). Each group, non-infected (white), RH infected (blue) and Me49 infected (green) is compared to its independent non-infected/non-stimulated control. Results are means ± SEM of 2 independent experiments. * P<0.05; ** P<0.01; *** P<0.001; **** P<0.0001.
Figure 6
Figure 6
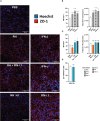
Interferons and infection modulate ZO-1 tight junction organization. (A) Confocal microscopy images of the outer blood-retina barrier model showing the effect of interferon stimulation and toxoplasmic infection on ZO-1 expression and localization. ARPE-19 RPE cells were differentiated for 8 weeks on laminin coated transwells. Then, they were treated with 20ng/mL IFN-β, IFN-γ or IFN-λ1 and/or infected at a MOI of 1:1 with live or heat-inactivated (H.I.) T. gondii RH strain for 14h. The ZO-1 protein was labeled with AlexaFluor 555 and cell nuclei with Hoechst 33342. (B) and (C) Fluorescence intensity analysis. MFI = Mean fluorescence intensity. Total ZO-1 fluorescence = MFI of the junction area x junction area. Results were expressed as means ± SEM, n=12 (4 transwells per condition and 3 images per transwell). The experiment was repeated 3 times independently with similar results. ns: non significative, * P<0.05, ** P<0.01, *** P<0.001. (D) Infection does not modify ZO-1 mRNA expression. RT-PCR analysis of ZO-1 expression in response to T.gondii infection. Results were expressed as means ± SEM, n=4. The experiment was repeated twice independently with similar results.
Figure 7
Figure 7
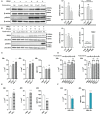
IFN-λ1 and IFN-β enhance barrier function in an STAT1 independent manner. (A) Western blots and their densitometric analysis of lysates from RPE cells treated with PBS, 0.1µM or 250µM fludarabine and stimulated with 20ng/mL IFN-β for 1 hours. Mean intensity of STAT1 and pSTAT1 were normalized to β-actin expression from the same sample. Results are expressed as means ± SEM of 2 independent experiments. (B) Western blots and their densitometric analysis of lysates from RPE cells treated with PBS, 0.1µM or 250µM fludarabine and stimulated with 20ng/mL IFN-λ1 for 3 hours or IFN-γ for 1 hour. Mean intensity of STAT1 and pSTAT1 were normalized to β-actin expression from the same sample. Results are expressed as means ± SEM of 2 independent experiments. (C—F) RPE cells differentiated for 8 weeks on transwell inserts were stimulated with 20ng/mL IFN-β, IFN-λ1 or IFN-γ and treated with 250µM fludarabine or infected with RH strain at a MOI of 1:1 as indicated. Electrical resistance was measured after 24h and 48h. FITC-dextran (1mg/mL) in culture medium was placed in the upper transwell chamber. Fluoresceine MFI in the lower chamber was measured 48h after 20ng/mL interferon stimulation or after 24h T. gondii RH strain infection. Results are expressed as means ± SEM, n=4. The experiment was repeated 3 times independently with similar results. ns: non significative, * P<0.05, ** P<0.01, *** P<0.001, **** P<0.0001, compared to PBS control unless otherwise indicated.

Similar articles

Cited by

References

    1. Forrester JV, McMenamin PG, Dando SJ. CNS infection and immune privilege. Nat Rev Neurosci (2018) 19(11):655−71. doi: 10.1038/s41583-018-0070-8 - DOI - PubMed
    1. Weidner JM, Kanatani S, Hernández-Castañeda MA, Fuks JM, Rethi B, Wallin RPA, et al. . Rapid cytoskeleton remodelling in dendritic cells following invasion by toxoplasma gondii coincides with the onset of a hypermigratory phenotype. Cell Microbiol (2013) 15(10):1735−52. doi: 10.1111/cmi.12145 - DOI - PubMed
    1. Lambert H, Barragan A. Modelling parasite dissemination: host cell subversion and immune evasion by toxoplasma gondii. Cell Microbiol (2010) 12(3):292−300. doi: 10.1111/j.1462-5822.2009.01417.x - DOI - PubMed
    1. O’Leary F, Campbell M. The blood-retina barrier in health and disease. FEBS J (2021) 290(4):878–91. doi: 10.1111/febs.16330 - DOI - PubMed
    1. Otani T, Furuse M. Tight junction structure and function revisited. Trends Cell Biol (2020) 30(10):805−17. doi: 10.1016/j.tcb.2020.08.004 - DOI - PubMed

Publication types