. 2023 Apr 28:14:1104730.
doi: 10.3389/fimmu.2023.1104730. eCollection 2023.

PD-1 limits differentiation and plasticity of Tc17 cells

Affiliations

PD-1 limits differentiation and plasticity of Tc17 cells

Aditya Arra et al. Front Immunol. .

Abstract

Blockade of surface co-inhibitory receptor programmed cell death-1 (PD-1; CD279) has been established as an important immunotherapeutic approach to treat malignancies. On a cellular level, PD-1 is demonstrated to be of particular importance in inhibiting differentiation and effector function of cytotoxic Tc1 cells (CTLs). Nevertheless, the role of PD-1 in modulating interleukin (IL)-17-producing CD8+ T-cells (Tc17 cells), which generally display suppressed cytotoxic nature, is not well understood. To evaluate the impact of PD-1 in Tc17 responses, we examined its functioning using different in vitro and in vivo models. Upon activation of CD8+ T-cells in Tc17 environment, we found that PD-1 was rapidly expressed on the surface of CD8+ T-cells and triggered a T-cell-internal mechanism that inhibited the expression of IL-17 and Tc17-supporting transcription factors pSTAT3 and RORγt. Expression of type17-polarising cytokine IL-21 and the receptor for IL-23 were also suppressed. Intriguingly, adoptively transferred, PD-1-/- Tc17 cells were highly efficient in rejection of established B16 melanoma in vivo and displayed Tc1 like characteristics ex vivo. When using IL-17A-eGFP reporter mice for in vitro fate tracking, IL-17A-eGFP expressing cells lacking PD-1 signaling upon re-stimulation with IL-12 quickly acquired Tc1 characteristics such as IFN-γ, and granzyme B expression, implicating lineage independent upregulation of CTL-characteristics that are needed for tumor control. In line with plasticity characteristics, absence of PD-1 signaling in Tc17 cells increased the expression of the stemness and persistence-associated molecules TCF1 and BCL6. Thus, PD-1 plays a central role in the specific suppression of Tc17 differentiation and its plasticity in relation to CTL-driven tumor rejection, which provides further explanation as to why the blockade of PD-1 is such an efficient therapeutic target for inducing tumor rejection.

Keywords: T-cell differentiation; T-cell plasticity; Tc17 cells; cytotoxic T lymphocytes (CTLs); immune checkpoint.


Conflict of interest statement

The authors declare that the research was conducted in the absence of any commercial or financial relationships that could be construed as a potential conflict of interest.

Figures
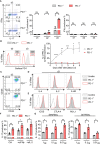
Figure 1
Figure 1
PD-1 restricts Tc17 differentiation. PD-1+/+ and PD-1-/- OT-1 naïve CD8+ T cells were activated antigen specifically using OVA257–264 loadedAPCs and cultured under Tc17 conditions. (A) Dot plot representing flow cytometric analysis of intracellular IL-17 and IFN-γ expression (left panel) in OT-1 CD8+ T cells stimulated for 3 days under Tc17 conditions. Cumulative staining results from d1, d2 and d3 are shown on the right. (B) Histogram of PD-1 surface expression 3 days after antigen specific stimulation of PD-1+/+ Tc17 cells. PD-1-/- Tc17 cells were used as negative controls. Graph representing kinetics of PD-1 expression on surface of PD-1+/+ and PD-1-/- Tc17 cells at different time points from day 0 to day 5. (C, D) Naïve PD-1+/+ and PD-1-/- OT-1 CD8+ T cells were stimulated as in (A) for 3 days and analyzed for the expression of activation markers CD25 and CD44 (C), intracellular cytokines IL-4, IL-2, cytokine receptors IL-6R (D) by flow cytometry. (E) Histograms of surface expression of ICOS, CTLA-4 and PD-L1 in 3 day stimulated PD-1+/+ and PD-1-/- Tc17 cells. (F) Naïve PD-1+/+ and PD-1-/- OT-1 CD8+ T cells were stimulated as in (A) and intracellular IL-17 expression with and without neutralizing antibodies against IL-2 and IFN-γ was measured by flow cytometry on day3 after activation and presented in the bar graph. (G) Naïve PD-1+/+ and PD-1-/- OT-1 CD8+ T cells were stimulated with different concentrations (1μg, 0. 1μg and 0.01μg) of high affinity (SIINFEKL) and low affinity (SIITFEKL) OVA peptide loaded APCs under Tc17 conditions. Bar graphs represent cumulative frequencies of intracellular IL-17 producers 3 days after activation. The data are representative of two to three independent experiments. Data points represent individual experiments with mean+SD. **** P < 0.0001, ***P < 0.001, **P < 0.01, *P < 0.05, n.s: not significant, calculated by Welch’s t-test.
Figure 2
Figure 2
PD-1-mediated cell intrinsic signaling regulates Tc17 differentiation. (A) Naïve PD-1+/+ and PD-1-/- OT-1 CD8+ T cells were labelled with CFSE (5μM) before priming them with OVA257–264 loaded APCs and cultured under Tc17 conditions. Proliferation of PD-1+/+ and PD-1-/- Tc17 cells was evaluated by CFSE dilution at indicated time points. (B) Naïve PD-1+/+ and PD-1-/-OT-1 CD8+ T cells were labelled with CFSE (5μM) or CTV (2.5μM) or vice versa. CFSE and CTV stained cells were combined 1:1 prior to adding OVA257–264 loaded APCs. At day 3 after primary activation under Tc17 conditions cells were analyzed by flow cytometry for expression of IL-17. Dot plot representing IL-17 expression (dashed gates) in PD-1+/+ and PD-1-/- Tc17 cells within each generation (solid gates) of proliferating cells. (C) CD8+ T-cells from C57BL/6 mice were stimulated with microspheres immobilized with anti-CD3, anti-CD28 and rPD-L1 (+rPD-L1) or IgG (αCD3/αCD28) under Tc17 polarizing conditions. Three days after primary stimulation, IL-17 and IFN-γ expression in these cells was measured by flow cytometry and are presented in the bar graph. (D) CD8+ T-cells from PD-1+/+ and PD-1-/- mice were stimulated with microspheres immobilized with anti-CD3, anti-CD28 and rPD-L1 under Tc17 conditions and at day three IL-17 and IFN-γ expression in these cells was measured by flow cytometry. The data is representative of two to five independent experiments. Data points represent individual experiments with mean+SD. ***P<0.001, calculated by Welch’s t-test.
Figure 3
Figure 3
PD-1 suppresses Tc17 hallmarks. (A) CD8+ T-cells from C57BL/6 mice were stimulated as in (2C) and harvested at indicated time points. The harvested cells were lysed, RNA was extracted, and RT was used to synthesize cDNA. The relative expression levels of the indicated genes analyzed using real-time PCR are shown as mean+SEM of replicates from an experiment. (B, C) Tc17 cells were stimulated as in (A) and expression of IL-21 and IL-23R (B), RORγt and pSTAT3 (C) was measured by flow cytometry 3 days after activation. (D) CD8+ T-cells from IL-17A-eGFP reporter mice were stimulated with microspheres immobilized with anti-CD3, anti-CD28 for 2 days under Tc17 conditions. These cells were then engaged with microspheres immobilized with rPD-L1 or not, associated with anti-CD3 and anti-CD28 for indicated time points and thereafter IL-17 expression was measured by flow cytometry. The data is representative of two to three independent experiments. ***P<0.001, **P<0.01, *P<0.05; ns, not significant, calculated by unpaired t-test.
Figure 4
Figure 4
PD-1 limits plasticity and anti-tumor potential of Tc17 cells. (A) CD8+ T-cells from C57BL/6 mice were stimulated with microspheres immobilized with anti-CD3, anti-CD28 for 3 days under Tc17 conditions. These cells were then restimulated with fresh microspheres immobilized with anti-CD3, anti-CD28, and rPD-L1 or IgG under Tc1 conditions for 48h and thereafter IL-17 and IFN-γ expression was measured by flow cytometry. (B) Naïve PD-1+/+ and PD-1-/- OT-1 CD8+ T cells were cultured under Tc17 conditions for 3 days as in Figure 1. T-cell depleted splenocytes were stained separately with different concentrations of CFSE (5 μM and 0.25 μM) and named accordingly as CFSEhigh and CFSElow. Only the CFSEhigh cells were loaded with OVA257–264 peptide and were considered as target cells. CFSElow and CFSEhigh cells (target cells) were pooled together at 1:1 ratio and a mixture of these cells were added to the pre-differentiated CD8+ T cells (effector cells). After 24 hours of restimulation, CFSE labelled cells were detected and quantified by flow cytometry and target cell lysis was calculated and presented in bar graph. (C) Determination of PD-1+/+ and PD-1-/- Tc17 cells efficiency in tumor control (D) Schematic of the tumor experiment model. Recipient Ly5.1 mice were s.c. injected with B16-OVA melanoma cells. 8 d later, when a visible tumor was present, PBS or PD-1+/+ or PD-1-/- OT-1 CD8+ T cells that had been stimulated under Tc17 conditions for 3 d were adoptively transferred into the tumor bearing mice through intravenous (i.v.) injection, and tumor growth was measured for the following days. The (C, D) were partly generated using Servier Medical Art, provided by Servier, licensed under a Creative Commons Attribution 3.0 unported license. (E) Curves showing mean tumor growth ± SEM with time in days for each treatment group (n=4-5). (F) Tumor volume in the recipient mice on day 13 after transfer of PBS or Tc17 cells. (G) Adoptively transferred CD45.2+ cells were surface stained ex vivo in the single cell suspensions from spleen and tumor draining lymph nodes of the tumor-bearing mice on day 13, and were analyzed for TNF-α, and IFN-γ production by flow cytometry. Data points represent individual mice with mean ± SD. ***P<0.001, **P<0.01, *P<0.05; ns, not significant, calculated by two-way RM ANOVA followed by Holm-Sidak’s multiple comparisons test for each individual time point [(E: black asterisks: PBS vs PD-1-/- Tc17, red asterisks: PD-1-/- Tc17 vs PD-1+/+ Tc17), F] or Welch’s t-test (B, G).
Figure 5
Figure 5
PD-1 suppresses cytotoxic potential and stemness of Tc17 cells. (A, B) CD8+ T-cells from IL-17A-eGFP reporter mice were stimulated with microspheres immobilized with anti-CD3, anti-CD28 for 3 days under Tc17 conditions. These cells were then restimulated with fresh microspheres immobilized with anti-CD3, anti-CD28, and rPD-L1 or IgG under Tc1 conditions for 48h and thereafter Tc17 cell plasticity (A) was determined by measuring IL-17 and IFN-γ expression (B) by flow cytometry within IL-17 eGFP expressing previous IL-17 producers. The (A) was partly generated using Servier Medical Art, provided by Servier, licensed under a Creative Commons Attribution 3.0 unported license. (C) CD8+ T-cells were stimulated as in (A) and, Eomes and granzyme B expression was measured by flow cytometry. (D) CD8+ T-cells from C57BL/6 mice were stimulated as in (A) and analyzed for the expression of degranulation-associated surface molecule CD107a. (E) CD8+ T-cells from C57BL/6 mice were stimulated with microspheres immobilized with anti-CD3, anti-CD28 and rPD-L1 (+rPD-L1) or IgG (αCD3/αCD28) antibodies under Tc17 condition and harvested 24h after activation. The harvested cells were lysed, RNA was extracted, and RT was used to synthesize cDNA. The relative expression levels of TCF1 and LEF1 genes analyzed using real-time PCR are shown as mean+SD of replicates from an experiment. (F) Tc17 cells were stimulated as in (E) and expression of TCF1, BCL6 and CD27 were measured by flow cytometry at day 3. The data is representative of two to five independent experiments. Data points represent individual experiments with mean+SD. ****P < 0.0001, ***P<0.001, **P<0.01, *P<0.05; ns, not significant, calculated by Welch’s t-test.

Similar articles

Cited by

References

    1. Intlekofer AM, Takemoto N, Wherry EJ, Longworth SA, Northrup JT, Palanivel VR, et al. . Effector and memory CD8+ T cell fate coupled by T-bet and eomesodermin. Nat Immunol (2005) 6:1236–44. doi: 10.1038/ni1268 - DOI - PubMed
    1. Pearce EL, Mullen AC, Martins GA, Krawczyk CM, Hutchins AS, Zediak VP, et al. . Control of effector CD8+ T cell function by the transcription factor eomesodermin. Science (2003) 302:1041–3. doi: 10.1126/science.1090148 - DOI - PubMed
    1. Nguyen HH, Kim T, Song SY, Park S, Cho HH, Jung S-H, et al. . Naïve CD8(+) T cell derived tumor-specific cytotoxic effectors as a potential remedy for overcoming TGF-β immunosuppression in the tumor microenvironment. Sci Rep (2016) 6:28208. doi: 10.1038/srep28208 - DOI - PMC - PubMed
    1. Kaech SM, Cui W. Transcriptional control of effector and memory CD8+ T cell differentiation. Nat Rev Immunol (2012) 12:749–61. doi: 10.1038/nri3307 - DOI - PMC - PubMed
    1. Huber M, Heink S, Grothe H, Guralnik A, Reinhard K, Elflein K, et al. . A Th17-like developmental process leads to CD8(+) Tc17 cells with reduced cytotoxic activity. Eur J Immunol (2009) 39:1716–25. doi: 10.1002/eji.200939412 - DOI - PubMed

Publication types

MeSH terms

Substances