

Identification of novel molecular subtypes and a signature to predict prognosis and therapeutic response based on cuproptosis-related genes in prostate cancer
- PMID: 37205181
- PMCID: PMC10185853
- DOI: 10.3389/fonc.2023.1162653
Identification of novel molecular subtypes and a signature to predict prognosis and therapeutic response based on cuproptosis-related genes in prostate cancer
Abstract
Background: Prostate cancer (PCa) is the most common malignant tumor of the male urinary system. Cuproptosis, as a novel regulated cell death, remains unclear in PCa. This study aimed to investigate the role of cuproptosis-related genes (CRGs) in molecular stratification, prognostic prediction, and clinical decision-making in PCa.
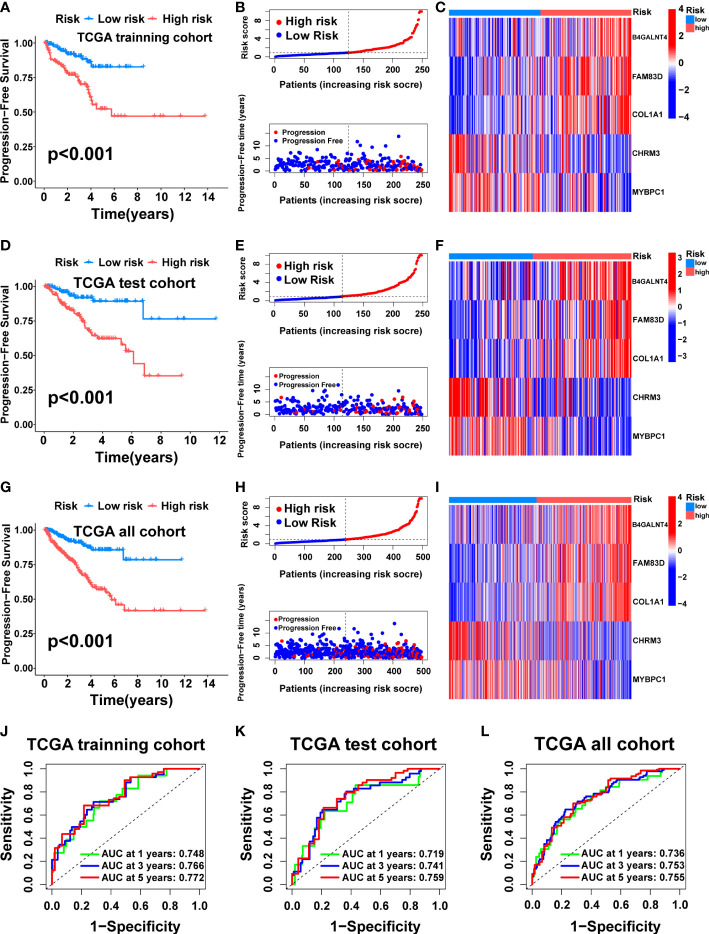
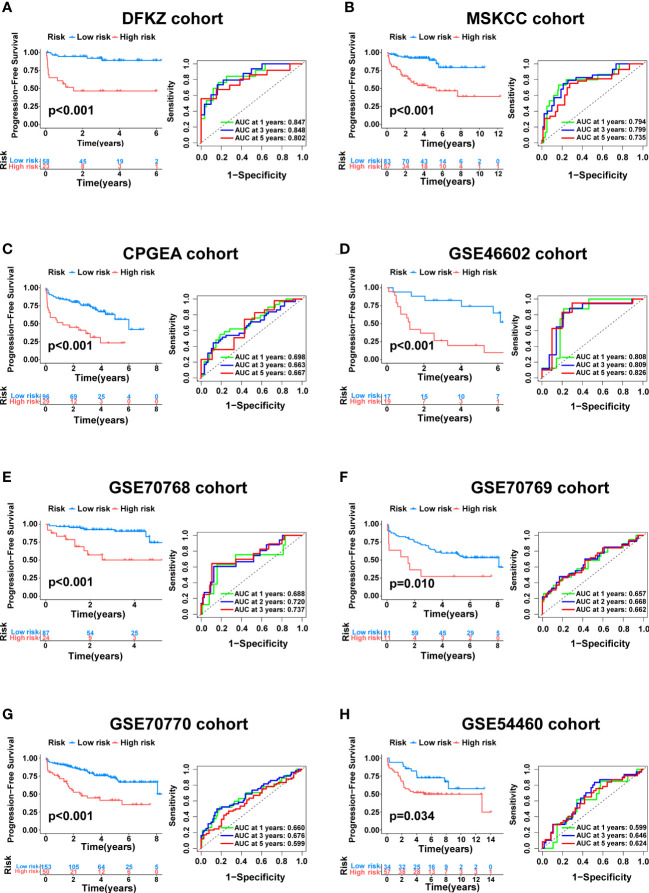
Methods: Cuproptosis-related molecular subtypes were identified by consensus clustering analysis. A prognostic signature was constructed with LASSO cox regression analyses with 10-fold cross-validation. It was further validated in the internal validation cohort and eight external validation cohorts. The tumor microenvironment between the two risk groups was compared using the ssGSEA and ESTIMATE algorithms. Finally, qRT-PCR was used to explore the expression and regulation of these model genes at the cellular level. Furthermore, 4D Label-Free LC-MS/MS and RNAseq were used to investigate the changes in CRGs at protein and RNA levels after the knockdown of the key model gene B4GALNT4.
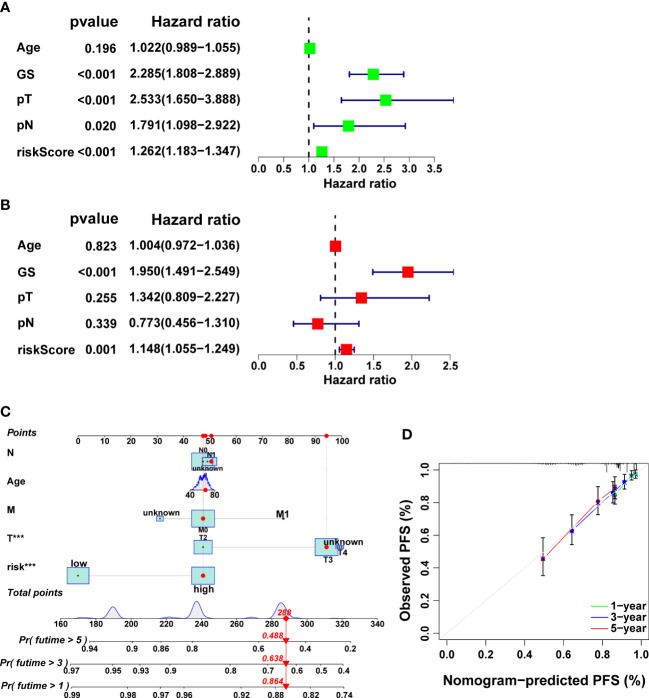
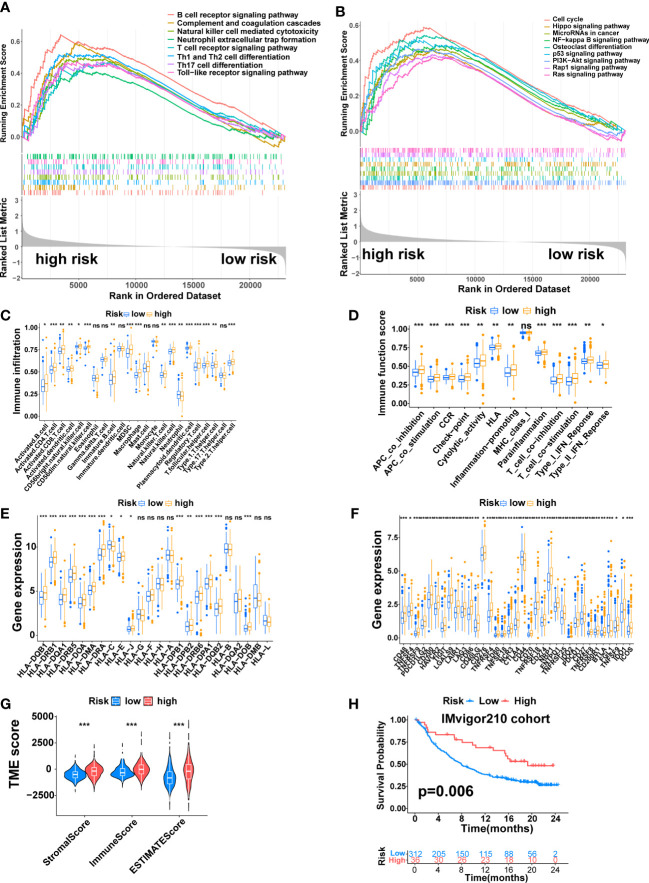
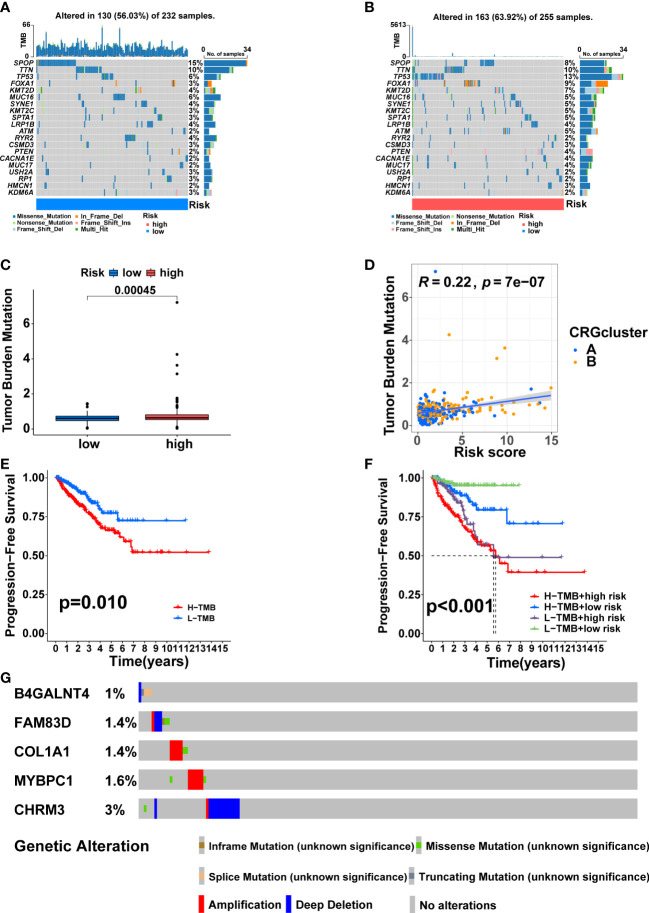
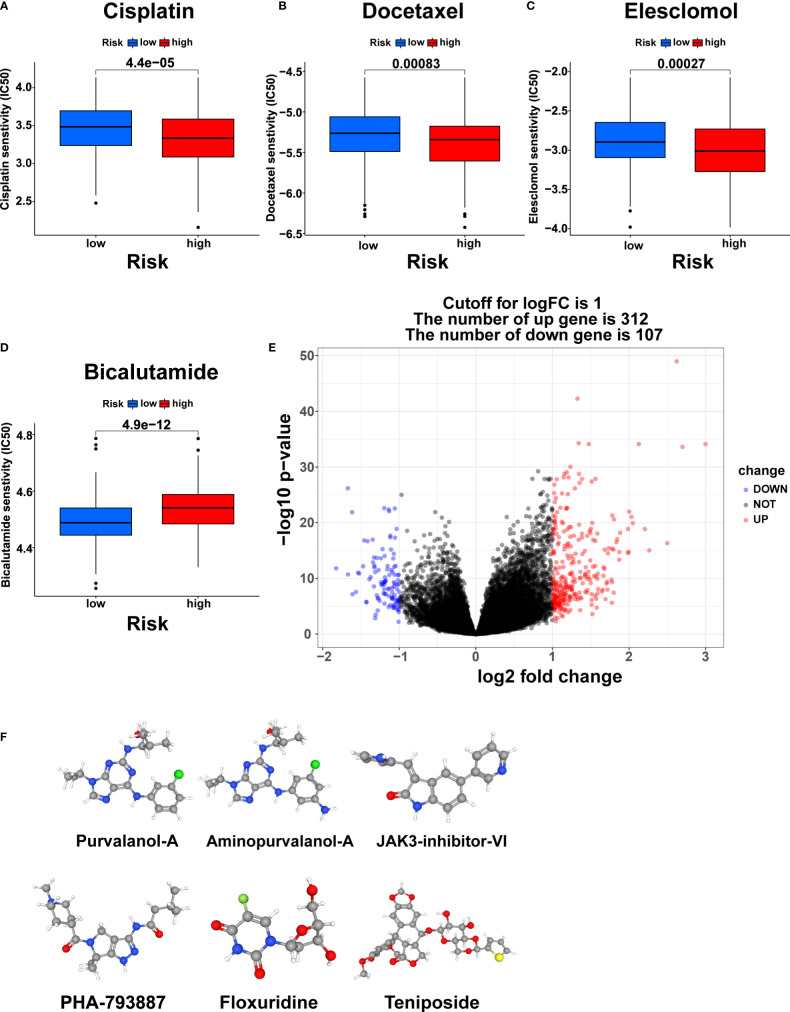
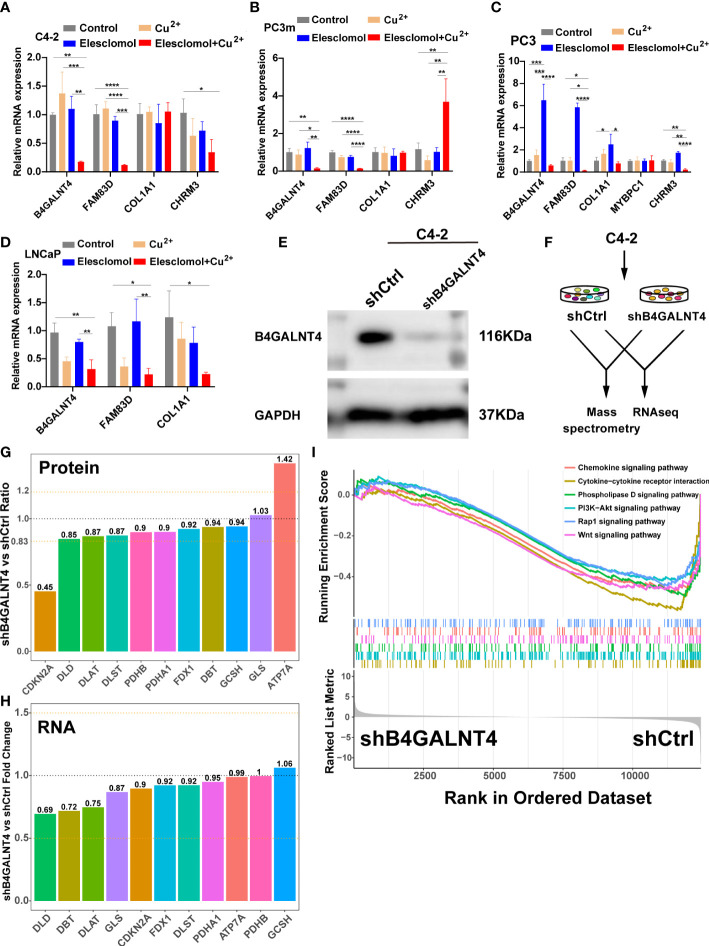
Results: Two cuproptosis-related molecular subtypes with significant differences in prognoses, clinical features, and the immune microenvironment were identified. Immunosuppressive microenvironments were associated with poor prognosis. A prognostic signature comprised of five genes (B4GALNT4, FAM83D, COL1A, CHRM3, and MYBPC1) was constructed. The performance and generalizability of the signature were validated in eight completely independent datasets from multiple centers. Patients in the high-risk group had a poorer prognosis, more immune cell infiltration, more active immune-related functions, higher expression of human leukocyte antigen and immune checkpoint molecules, and higher immune scores. In addition, anti-PDL-1 immunotherapy prediction, somatic mutation, chemotherapy response prediction, and potential drug prediction were also analyzed based on the risk signature. The validation of five model genes' expression and regulation in qPCR was consistent with the results of bioinformatics analysis. Transcriptomics and proteomics analyses revealed that the key model gene B4GALNT4 might regulate CRGs through protein modification after transcription.
Conclusion: The cuproptosis-related molecular subtypes and the prognostic signature identified in this study could be used to predict the prognosis and contribute to the clinical decision-making of PCa. Furthermore, we identified a potential cuproptosis-related oncogene B4GALNT4 in PCa, which could be used as a target to treat PCa in combination with cuproptosis.
Keywords: cuproptosis; prostate cancer; signature; tumor microenvironment; unsupervised clustering.
Copyright © 2023 Zhang, Jiang, Gu, Zhang, Shen, Qu, Yang, Wang and Gao.
Conflict of interest statement
The authors declare that the research was conducted in the absence of any commercial or financial relationships that could be construed as a potential conflict of interest.
Figures
Similar articles
-
Identification of cuproptosis-related subtypes, construction of a prognosis model, and tumor microenvironment landscape in gastric cancer.Front Immunol. 2022 Nov 21;13:1056932. doi: 10.3389/fimmu.2022.1056932. eCollection 2022. Front Immunol. 2022. PMID: 36479114 Free PMC article.
-
Identification and validation of a novel cuproptosis-related genes signature associated with prognosis, clinical implications and immunotherapy of hepatocellular carcinoma.Front Pharmacol. 2023 Feb 9;14:1088993. doi: 10.3389/fphar.2023.1088993. eCollection 2023. Front Pharmacol. 2023. PMID: 36843949 Free PMC article.
-
Cuproptosis-related risk score predicts prognosis and characterizes the tumor microenvironment in colon adenocarcinoma.Front Oncol. 2023 Jun 2;13:1152681. doi: 10.3389/fonc.2023.1152681. eCollection 2023. Front Oncol. 2023. PMID: 37333810 Free PMC article.
-
Identification of a novel cuproptosis-related gene signature and integrative analyses in patients with lower-grade gliomas.Front Immunol. 2022 Aug 15;13:933973. doi: 10.3389/fimmu.2022.933973. eCollection 2022. Front Immunol. 2022. PMID: 36045691 Free PMC article. Review.
-
Cuproptosis and cuproptosis-related cell death and genes: mechanistic links to spermatogenic cell death.Cell Death Discov. 2025 Jun 10;11(1):274. doi: 10.1038/s41420-025-02553-2. Cell Death Discov. 2025. PMID: 40494847 Free PMC article. Review.
Cited by
-
Bioinformatics analysis and experimental validation of m6A and cuproptosis-related lncRNA NFE4 in clear cell renal cell carcinoma.Discov Oncol. 2024 May 26;15(1):187. doi: 10.1007/s12672-024-01023-y. Discov Oncol. 2024. PMID: 38797784 Free PMC article.
-
Cuproptosis in prostate cancer: Molecular mechanisms, prognostic biomarkers and therapeutic frontiers of cuproptosis‑related genes (Review).Int J Oncol. 2025 Sep;67(3):77. doi: 10.3892/ijo.2025.5783. Epub 2025 Aug 8. Int J Oncol. 2025. PMID: 40776742 Free PMC article. Review.
References
-
- Lalonde E, Ishkanian AS, Sykes J, Fraser M, Ross-Adams H, Erho N, et al. . Tumour genomic and microenvironmental heterogeneity for integrated prediction of 5-year biochemical recurrence of prostate cancer: a retrospective cohort study. Lancet Oncol (2014) 15:1521–32. doi: 10.1016/s1470-2045(14)71021-6 - DOI - PubMed
LinkOut - more resources
Full Text Sources