[Preprint]. 2023 May 25:2023.05.06.539585.
doi: 10.1101/2023.05.06.539585.

Direct androgen receptor regulation of sexually dimorphic gene expression in the mammalian kidney

Affiliations

Direct androgen receptor regulation of sexually dimorphic gene expression in the mammalian kidney

Lingyun Xiong et al. bioRxiv. .

Update in

Abstract

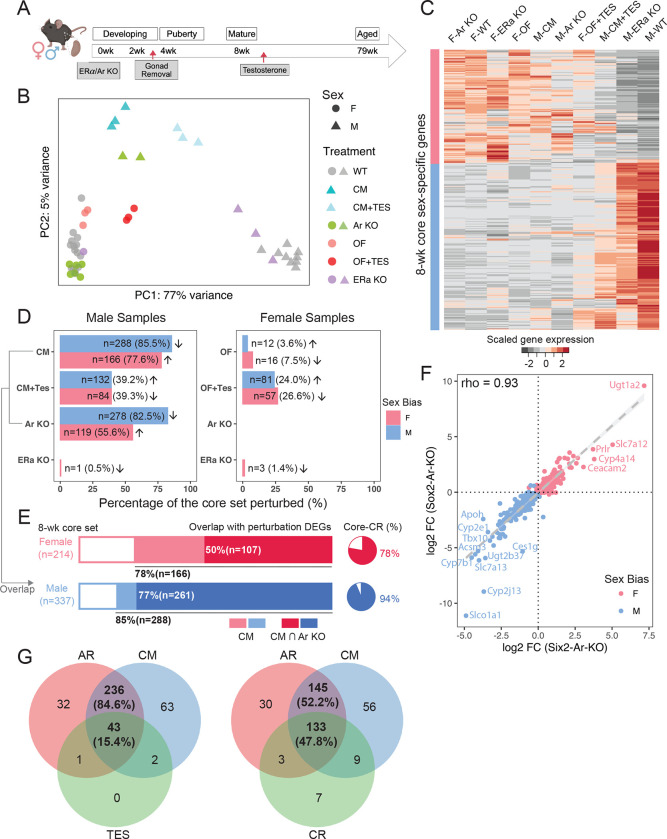
Mammalian organs exhibit distinct physiology, disease susceptibility and injury responses between the sexes. In the mouse kidney, sexually dimorphic gene activity maps predominantly to proximal tubule (PT) segments. Bulk RNA-seq data demonstrated sex differences were established from 4 and 8 weeks after birth under gonadal control. Hormone injection studies and genetic removal of androgen and estrogen receptors demonstrated androgen receptor (AR) mediated regulation of gene activity in PT cells as the regulatory mechanism. Interestingly, caloric restriction feminizes the male kidney. Single-nuclear multiomic analysis identified putative cis-regulatory regions and cooperating factors mediating PT responses to AR activity in the mouse kidney. In the human kidney, a limited set of genes showed conserved sex-linked regulation while analysis of the mouse liver underscored organ-specific differences in the regulation of sexually dimorphic gene expression. These findings raise interesting questions on the evolution, physiological significance, and disease and metabolic linkage, of sexually dimorphic gene activity.


Conflict of interest statement

Declaration of Interests

The authors declare no competing interests.

Figures

Figure 1.
Figure 1.. Gene- and transcript-level renal sex differences in adult mice.
(A) Schematic summary of the computational analyses of renal transcriptome in adult male and female mice. (B) Stacked bar plot depicts the proportion of sex-biased genes identified in 8-week C57BL/6 mice showing consistent biases in the aging kidney in the diversity outbred (DO) mice (the JAX data). Pie charts represent the percentage of core sex-biased genes that were identified in the PT segments from previous scRNA-seq experiment. (C) Venn diagram compares renal sex differences revealed by gene- and transcript-level analysis. (D) Bar plot shows the distribution of dimorphic isoforms with alternative splicing events in the male and female kidneys. (E) Distribution of Percent Spliced-In values for top genes showing dimorphic splicing events in the male and female kidneys. (F) Dimorphic transcript usage of distinct isoform in Acot7 (F-biased) and Hsd11b1 (M-biased) in male and female kidneys. (G-H) Coverage plot over the genomic region of Bok by bulk RNA-seq in male and female kidneys, aligned with data from ChIP-seq experiment against AR and Hnf4a in the male kidneys (G) and by ATAC-seq experiment in the male kidneys, aligned with ENCODE data from ChIP-seq experiment against epigenetic biomarkers (H). (I-J) Dot plot shows the enrichment of ToppFun pathways (I) and Gene Ontology terms (J) for both the full and core set of sex-biased genes.
Figure 2.
Figure 2.. Male and female renal transcriptomes diverge at puberty.
(A) Schematic summary of the experimental design in sampling renal transcriptome in male and female C57BL/6 mice. (B) Principal component analysis (PCA) reveals that the distribution of sample variations in gene expression are most influenced by age and sex. (C) Bar plot demonstrates the number of sex-biased genes identified at individual timepoints via differential expression analysis. (D) Heatmap shows the scaled average expression levels of the core sex-biased genes in male and female samples at individual timepoints. (E) Representative clusters of divergent gene expression dynamics analyzed by DPGP. Red tracings represent genes, the navy line represents the mean divergent gene expression of the cluster, and the cyan margin shows the 95% confidence interval. (F) Tile map shows the predicted TF activities based on normalized gene expression in samples by DoRothEA,, where high-confidence predictions are indicated by asterisks. (G) Network diagram of top 15 TFs that were predicted by ChEA3 to regulate the core female and male programs. Edges indicate physical interaction supported by literature evidence, directed if supported by ChIP-seq data. Solid nodes indicate TFs that are expressed in the PT segments in our previous single-cell RNA-seq experiment; open circles represent those that are not expressed. (H) Bar plot shows the percentage of putative targets among the core sex-biased genes that could be regulated by representative TFs, as predicted by ChEA3. The number of putative targets is listed.
Figure 3.
Figure 3.. The role of gonads, sex hormones, and sex hormone receptors in renal sex differences.
(A) The schematic summarizes the experimental design of perturbation treatments. Whole kidney bulk RNA-seq was performed between 8–12 weeks. (B) PCA plot demonstrates the relative renal transcriptional profile of mice undergoing various treatment regimens. Sample variations were evaluated based on the expression of the core sex-biased genes. CM: castration in males; OF: ovariectomy in females; TES: transient testosterone administration; WT: wild type; KO: knockout. (C) Heatmap shows the scaled average expression levels of the core set genes in male and female samples in individual treatments. (D) Percentage of the core sex-biased genes that were perturbed in individual treatments are shown for male and female samples in bar plots. The number of genes that are perturbed in each treatment and the corresponding percentages are listed. Arrows indicate the direction of perturbation in gene expression as compared to controls. (E) Stacked bars demonstrate the proportion of core sex-biased genes that are perturbed consistently in castration and nephron-specific AR knockout experiments in male samples. Pie charts show the percentage of AR-responsive genes that were perturbed in caloric restriction (CR) experiment. (F) Scatter plot compares changes in the expression of core sex-biased genes in nephron-specific removal (Six2-Ar-KO) and systemic removal (Sox2-Ar-KO). (G) Venn diagrams showing overlap of perturbed core sex-biased genes in male kidneys among three groups: 1) AR: nephron specific removal of AR; 2) CM: castrated males; 3) CM+TES or CR: caloric restriction.
Figure 4.
Figure 4.. Single-nuclear multiomic profiling of AR function in the mammalian kidney.
(A) Schematic summary of the single-nuclear multiomic experiment. (B) UMAP plot indicates the divergent features between male and female PT cells while the other cell populations co-cluster regardless of sex. Nuclei were clustered based on RNA and ATAC modalities using weighted nearest neighbor (WNN) graph. (C) Distribution of sex and genotype among all cell populations shown in (B). Top: stacked bar plot shows composition in each cluster; bottom: nuclei in the UMAP plot (B) colored by different sex-genotype combinations. (D) Dot plot demonstrates the expression pattern of top marker genes for individual PT segments. Known sex-biased genes are indicated. (E) Bar plot shows the total number of differentially expressed genes identified using the multiomic RNA data by four pairwise comparisons within PT segments. (F) Bar plot lists segment-wise number of single-nuclear sex-biased genes that were perturbed upon AR removal. (G) Volcano plot shows single-nuclear sex-biased genes identified in PT-S3 segment, where genes that are perturbed by AR removal in the male kidney are highlighted. (H) Scatter plot contrasts the effect of nephron-specific AR removal in male to the observed sex biases. (I) Bar plot compares the percentage of the core sex-biased genes that were perturbed by nephron-specific AR removal, between bulk and single-nuclear RNA-seq. (J) Scatter plot shows the impact of nephron-specific AR removal on common sex-biased gene, using bulk or single-nuclear RNA-seq data.
Figure 5.
Figure 5.. AR response elements are located near sex-biased genes.
(A) UMAP plot shows clustering outcome using peaks called from the single-nuclear ATAC data. PT-S3-f/mKO: co-clustering of PT-S3 cells from F-WT, F-KO, and M-KO; PT-S2-f/mKO: co-clustering of PT-S2 cells from F-WT, F-KO, and M-KO; mWT: M-WT. (B) Bar plot shows the number of sex-biased Differentially Accessible Regions (DARs) in PT segments identified for each pair-wise comparison (absolute Log2FC > 0.25, adjusted p-value < 0.05). (C) Schematic summary of the computation of gene accessibility score ψ and heatmap shows the scaled gene accessibility score ψ for AR-responsive genes in M-WT, F-WT, and M-KO PT segments. (D) Box plots demonstrate fold change in gene accessibility score ψ of AR-responsive genes within individual PT segments. (E) Histograms showing the percentage of the proximal and distal DARs from M-WT and M-KO compared to F-WT that were nearby AR dependent down-regulated M-biased (blue) and up-regulated F-biased (pink) genes. (F) Dot plot summarizes TF motif enrichment in the open DARs containing AR binding sites based on the published CHIP-seq dataset. in M-WT and M-KO compared to F-WT PT segments. (G) Volcano plot shows DARs within 100KB of sex-biased genes in PT-S3. 11,972 peaks were differentially open in male (left) and 7,987 peaks were differentially open in female (right). We colored F-biased peaks that are preferentially open in M-KO in red, and M-biased peaks that are preferentially closed in M-KO in blue. Each dot represents a 500-bp region, where the nearest gene is annotated. (H) Bar plot shows the prevalence of TF binding and motif among PT-S3 sex-biased DARs that were altered by AR removal. TF binding was based on ChIP-seq data in the mouse kidney. TF motif PWMs were retrieved from the Jasper database for AR (MA0007.3) and Hnf4a (MA0114.3). (I-J) Coverage plots of two representative sex-biased genes, Slco1a1 (M-biased; I) and Abcc3 (F-biased; J). All peaks called in the region are shown in gray boxes, where DARs are highlighted in red. Peaks with potential AR binding site are indicated by red arrows.
Figure 6.
Figure 6.. Fluorescence RNA in situ hybridization by RNAscope validates dimorphic gene expression in proximal tubule.
(A-C) RNAscope assay directly visualized the expression levels of sex-biased genes in M-WT, F-WT, and M-KO PT-S2 & S3 (scale bars = 20 μm): co-stained with an antibody against Aqp1 (blue) demarcating the PT. (A) Left: Cyp2j13 (red) and Cyp2e1 (green, male PTS2 marker) co-stained with Slc7a12 (Cyan, female PTS3 marker); right: Gsta4 (red) and Cyp4a14 (green, female PTS2 marker) co-stained with Cyp7b1 (Cyan, male PTS3 marker). (B) Slco1a1 (red) and Abcc3 (green), co-stained with Cyp7b1 (Cyan, male PTS3 marker) (C) Atp11a (red) and Hao2 (green). (D-F) Tile maps show the expression and chromatin profile of top sex-biased genes in M-WT and F-WT PT segments: (D) data from previous scRNA-seq experiment; (E) in-situ expression of top sex-biased genes measured by RNAscope; and (F) the estimated chromatin accessibility.
Figure 7.
Figure 7.. Distinct and shared processes of dimorphic gene expression between organs and species.
(A) Bar plot shows the number of liver sex-biased genes identified in the current study (in-house) and those reported in the literature. Gray-contoured bars indicate the number of genes overlapping with the in-house list. (B) Venn diagrams show the number of sex-biased genes that are shared in the kidney and liver. (C) PCA plot demonstrates the impact of hepatocyte-specific (Alb-Ar-KO) and systemic AR removal (Sox2-Ar-KO), as compared to WT samples. (D) The percentage of in-house liver sex-biased genes that were perturbed in individual treatments is shown in the bar plot (top) and stacked bar plot (bottom). Arrows indicate the direction of perturbation in gene expression when compared to controls. (E) Scatter plots compare the changes in expression of in-house liver sex-biased genes between systemic and hepatocyte-specific AR removal. The dashed gray diagonal line marks equal impact. (F) A schematic summary of how testosterone influences the sexual dimorphism in the kidney and liver. (G) UMAP plot shows clustering of human renal snRNA-seq data (GSE151302). (H) Composition of male and female cells in each cluster in (B). (I) Bar plot shows the number of sex-biased genes among each PT cluster in (B). (J) Pie charts demonstrates the percentage of autosomal versus X/Y-linked genes among all the sex-biased genes identified in (D). (K) Comparison of sex-biased gene expression in human and mouse kidney reveals conserved sexual dimorphism. The table lists the number of orthologs that show sex biases in gene expression; the scatter plot shows the differences in expression of common sex-biased genes in human and mouse PT segments.

References

    1. Carrero J.J., Hecking M., Chesnaye N.C., and Jager K.J. (2018). Sex and gender disparities in the epidemiology and outcomes of chronic kidney disease. Nat Rev Nephrol 14, 151–164. 10.1038/nrneph.2017.181. - DOI - PubMed
    1. Kattah A.G., and Garovic V.D. (2020). Understanding sex differences in progression and prognosis of chronic kidney disease. Ann Transl Med 8, 897–897. 10.21037/atm.2020.03.62. - DOI - PMC - PubMed
    1. Aufhauser D.D., Wang Z., Murken D.R., Bhatti T.R., Wang Y., Ge G., Redfield R.R., Abt P.L., Wang L., Svoronos N., et al. (2016). Improved renal ischemia tolerance in females influences kidney transplantation outcomes. Journal of Clinical Investigation 126, 1968–1977. 10.1172/JCI84712. - DOI - PMC - PubMed
    1. Neugarten J., and Golestaneh L. (2018). Female sex reduces the risk of hospitalassociated acute kidney injury: a meta-analysis. BMC Nephrol 19, 314. 10.1186/s12882-018-1122-z. - DOI - PMC - PubMed
    1. Hosszu A., Fekete A., and Szabo A.J. (2020). Sex differences in renal ischemia-reperfusion injury. American Journal of Physiology-Renal Physiology 319, F149–F154. 10.1152/ajprenal.00099.2020. - DOI - PubMed

Publication types