[Preprint]. 2023 May 5:rs.3.rs-2870695.
doi: 10.21203/rs.3.rs-2870695/v1.

Organoid modeling of lung-resident immune responses to SARS-CoV-2 infection

Affiliations

Organoid modeling of lung-resident immune responses to SARS-CoV-2 infection

Shannon S Choi et al. Res Sq. .

Abstract

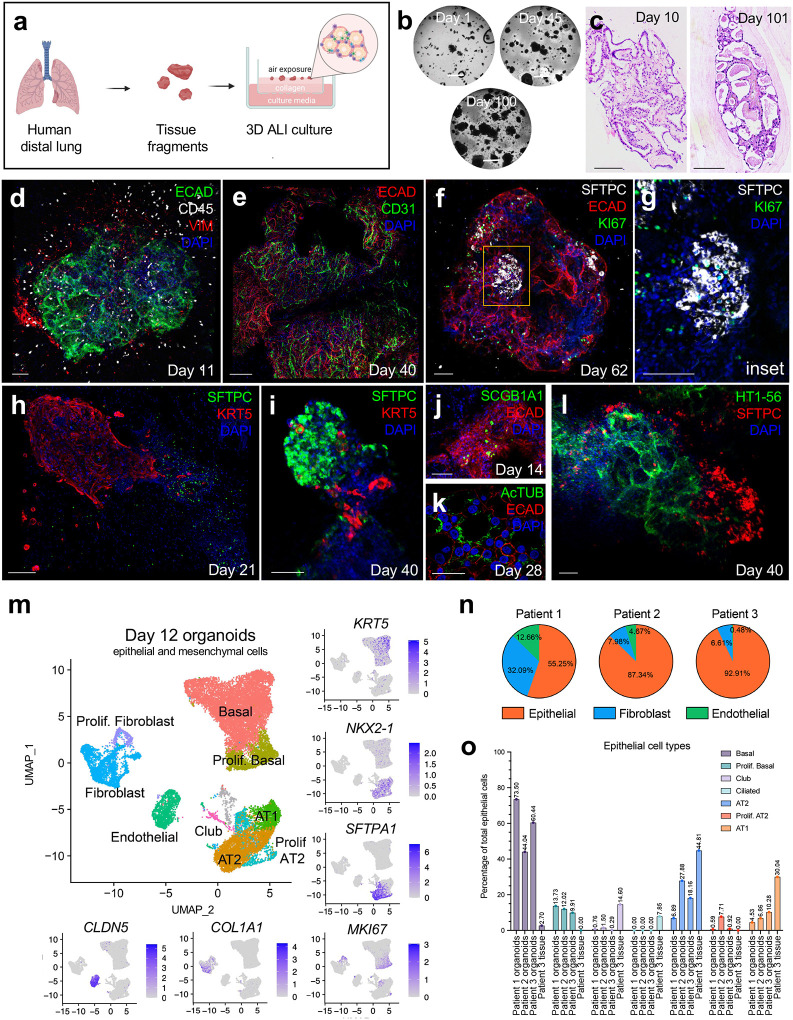
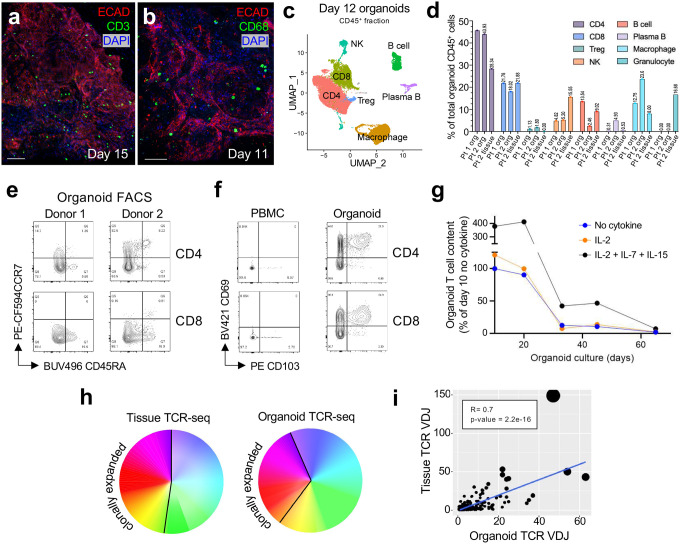
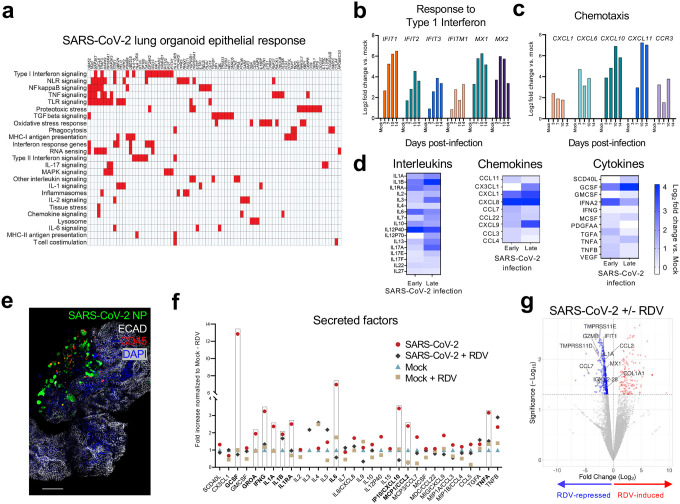
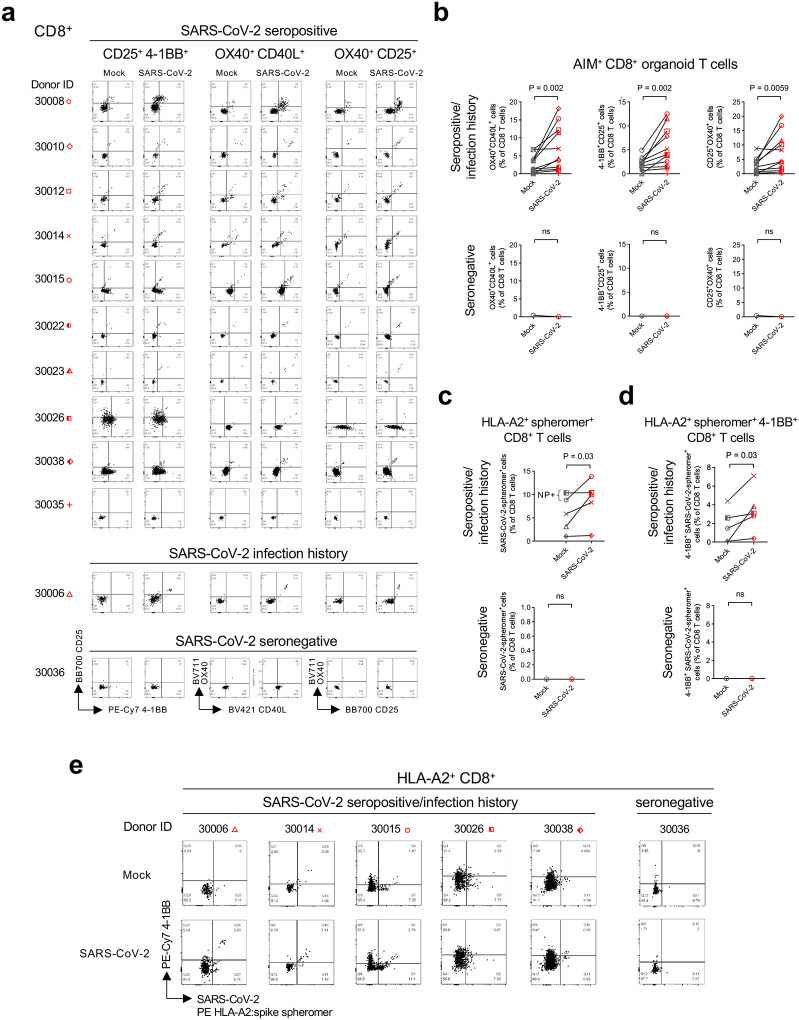
Tissue-resident immunity underlies essential host defenses against pathogens, but analysis in humans has lacked in vitro model systems where epithelial infection and accompanying resident immune cell responses can be observed en bloc. Indeed, human primary epithelial organoid cultures typically omit immune cells, and human tissue resident-memory lymphocytes are conventionally assayed without an epithelial infection component, for instance from peripheral blood, or after extraction from organs. Further, the study of resident immunity in animals can be complicated by interchange between tissue and peripheral immune compartments. To study human tissue-resident infectious immune responses in isolation from secondary lymphoid organs, we generated adult human lung three-dimensional air-liquid interface (ALI) lung organoids from intact tissue fragments that co-preserve epithelial and stromal architecture alongside endogenous lung-resident immune subsets. These included T, B, NK and myeloid cells, with CD69+CD103+ tissue-resident and CCR7- and/or CD45RA- TRM and conservation of T cell receptor repertoires, all corresponding to matched fresh tissue. SARS-CoV-2 vigorously infected organoid lung epithelium, alongside secondary induction of innate cytokine production that was inhibited by antiviral agents. Notably, SARS-CoV-2-infected organoids manifested adaptive virus-specific T cell activation that was specific for seropositive and/or previously infected donor individuals. This holistic non-reconstitutive organoid system demonstrates the sufficiency of lung to autonomously mount adaptive T cell memory responses without a peripheral lymphoid component, and represents an enabling method for the study of human tissue-resident immunity.


Conflict of interest statement

Additional Declarations: Yes there is potential Competing Interest. C.J.K. and S.S.C. are listed as inventors on provisional patent PCT/US2022/029869 describing the methods in this paper. C.J.K. is a founder of Surrozen Inc. C.J.K. and M.M.D. are founders of Mozart Therapeutics and NextVivo, Inc. All other authors declare no competing interests. COMPETING INTERESTS C.J.K. and S.S.C. are listed as inventors on provisional patent PCT/US2022/029869 describing the methods in this paper. C.J.K. is a founder of Surrozen, Inc. C.J.K. and M.M.D. are founders of Mozart Therapeutics and NextVivo, Inc. All other authors declare no competing interests.

Figures

Figure 1.
Figure 1.. Characterization of epithelial and mesenchymal cells in lung air-liquid-interface organoids.
a, Schematic of lung air-liquid-interface organoid generation. b, Serial brightfield images of lung ALI organoids, 1–100 days. Scale bar, 2 mm. c, Hematoxylin and eosin (H&E) staining of lung ALI organoids, day 10 and day 101. Scale bar, 500 μm. d, Immunofluorescence (IF) staining of day 11 lung organoid, ECAD+ epithelial (green), CD45+ immune (white), and Vimentin+ (VIM) mesenchymal cells (red), DAPI (blue). Scale bar, 100 μm. e, IF staining of day 40 lung organoid, ECAD+ epithelial (red) and CD31+ endothelial cells (green), DAPI (blue). Scale bar, 100 μm. f, IF staining of day 62 lung organoid, SFTPC+ AT2 cells (white), ECAD (red), KI67 (green), DAPI (blue). Scale bar, 100 μm. g, Inset of yellow region from (f) showing proliferative AT2 cells, SFTPC (white), KI67 (green), DAPI (blue). Scale bar, 300 μm. h, IF staining of day 21 organoid depicting SFTPC+ AT2 cells (green) and KRT5+ basal cells (red), DAPI (blue). Scale bar, 100 μm. i, IF staining of day 40 organoid showing SFTPC+ AT2 cells (green) and KRT5+ basal cells (red), DAPI (blue). Scale bar, 100 μm. j, IF staining of day 14 organoid showing SGB1A1+ club cells (green) ECAD (red), DAPI (blue). Scale bar, 100 μm. k, IF staining of day 28 organoid with AcTub+ ciliated cells (green) ECAD (red), DAPI (blue). Scale bar, 100 μm. l, IF staining of day 40 organoid with HT1–56+ AT1 cells (green) SFTPC+ AT2 cells (red), DAPI (blue). Scale bar, 100 μm. m, scRNA-seq UMAP plot and feature plots integrating CD45 cells from organoids of three individuals. n, Pie charts showing proportions of epithelial, fibroblast, and endothelial cells from scRNA-seq data from (m). o, Proportions of epithelial cell types out of total epithelial cells from (m) with 3 different patients (two solely with organoids, one matched organoid-tissue pair).
Figure 2.
Figure 2.. Lung ALI organoids preserve diverse functional immune populations.
a, IF imaging of day 15 ALI organoids containing T cells. CD3 (green), ECAD (red), DAPI (blue). Scale bar, 100 μm. b, IF imaging of day 11 organoids containing macrophages. CD68 (green), ECAD (red), DAPI (blue). Scale bar, 100 μm. c, scRNA-seq UMAP plot integrating CD45+ cells from lung organoids of two individuals. d, Proportions of immune cell types as a fraction of total immune cells from scRNA-seq data of CD45+ cells from two different patients (one organoid, one matched organoid-tissue pair). e, Organoid T cells exhibit a predominant memory phenotype. Flow cytometry plots of day 12 ALI organoids for CCR7 and CD45RA, pre-gated on live, single, CD45+CD3+ T cells. f, Flow cytometry plots of PBMC versus day 12 ALI organoids for residency markers CD69 and CD103/ITGAE, pre-gated on live, single, CD45+CD3+ T cells. g, Organoid T cell content over 10, 20, 33, and 44 days in culture with values with addition of cytokines as a percentage of the day 10 no cytokine condition. h, Pie chart showing individual TCR clones from scRNA-seq/TCR-seq of a matched fresh distal lung/organoid pair. Each color represents an individual TCR clonotype and clonally expanded TCR sequences are represented by large domains of a single color. i, Line graph of clonally expanded TCRs from (h). Each dot represents a unique TCR clonotype determined by single cell TCR-seq and the dot size represents relative TCR count frequencies within organoid or cognate fresh tissue. Pearson’s correlation coefficient R= 0.7, p-value = 2.2 × 10⁻¹⁶.
Figure 3.
Figure 3.. Suspension culture of lung ALI organoids.
a, Schematic of ALI lung suspension organoid culture. b, IF imaging of un-everted day 15 organoids in collagen, ECAD (red), CD45 (green), Vimentin (VIM) (white). Scale bar, 100 μm. c, IF imaging of un-everted day 15 organoids in collagen, ECAD (green), ACE2 (red), DAPI (blue). Scale bar, 100 μm. d-g, IF imaging of everted day 15 organoids, 5 days in suspension. d, ECAD (red), CD45 (green), VIM (white). Scale bar, 100 μm. e, ECAD (green), ACE2 (red), DAPI (blue). Scale bar, 100 μm. f, AT1 and AT2 cells, HT1–56 (red), SFTPC (green), DAPI (blue). Scale bar, 100 μm. g, Basal and AT2 cells, KRT5 (green), SFTPC (red), DAPI (blue). Scale bar, 100 μm. h, scRNA-seq UMAP plots showing integrated data of CD45 (top) and CD45+ (bottom) cells from suspension organoids, merged from two individual donors, day 12, with 5 days in suspension.
Figure 4.
Figure 4.. SARS-CoV-2 infection induces apoptosis in suspension lung ALI organoids.
a-b, IF imaging of mock (uninfected) (a) and SARS-CoV-2-infected (b) suspension lung ALI organoids. SARS-CoV-2 nucleocapsid (NP) protein (green), ECAD (red), CD45 (white), DAPI (blue). 48 hours post-infection with SARS-CoV-2 WA1. Scale bar, 100 μm. c. IF imaging of suspension lung ALI organoid with multinucleated syncytia (yellow arrowheads), 10 d.p.i. with SARS-CoV-2, SARS-CoV-2 NP (green), phalloidin (white), DAPI (blue). Scale bar, 10 μm. d-e. IF imaging of infected AT2 cells at 7 d.p.i. SFTPC (red), DAPI (blue), with (d) and without (e) SARS-CoV-2 NP channel (green). Scale bar, 100 μm. f-g. IF imaging of infected club cells at 7 d.p.i. SCGB1A1 (red), DAPI (blue), with (f) and without (g) SARS-CoV-2 NP channel (green). Scale bars 100 μm. h-j. IF imaging of SARS-CoV-2-induced apoptosis, 7 d.p.i., SARS-CoV-2 NP (green), cleaved caspase-3 (red), DAPI (blue). (i) and (j) are different channel splits of (h). Scale bar, 100 μm. k-l. Box plot quantification of IF images from (h-j). NP+ cells (top) or cleaved caspase-3+ cells (bottom) as fraction of total cells in suspension organoids, 3–14 d.p.i. Lines represent lower quartile, median, and upper quartile, whiskers represent data range minima or maxima.
Figure 5.
Figure 5.. Innate responses to SARS-CoV-2 in lung ALI organoids.
a, Summary of Nanostring nCounter analysis of upregulated genes and biological pathways (red) in FACS-purified EPCAM+ lung epithelial cells from SARS-CoV-2-infected organoids at 7 d.p.i. versus mock control (>1.5-fold change in three biological replicates). b-c, Bulk RNA-sequencing of mock and infected organoids over 3–14 days of infection showing genes involved in response to interferon (b), and chemotaxis (c). Y-axis is log2 fold change expression normalized to mock of the same time point. d, Heat map of Luminex analysis of interleukins (left), chemokines (middle), and cytokines (right), secreted into media by organoids from one representative patient during early (3 days) or late (10 days) of infection. Color corresponds to log2 fold change compared to mock of the same time point. e, IF imaging of immune cells clustering around infected cells, 10 days post-infection, SARS-CoV-2 NP (green), ECAD (white), CD45 (red), DAPI (blue). Scale bar, 100 μm. f, Dot plot of Luminex analysis of secreted factors in culture supernatant after SARS-CoV-2 infection +/− remdesivir (RDV). Red dot: SARS-CoV-2 48 hours post-infection, no RDV. Grey diamond: SARS-CoV-2 48 hours post-infection + 10 μM RDV. Blue triangle: mock infection (no virus), no RDV. Tan square: mock infection (no virus) + 10 μM RDV. Factors increased >2 fold in infected, no RDV over mock, no RDV are bolded and highlighted with rectangles. Y-axis is fold increase normalized to mock (–) RDV condition. RDV was added simultaneously with SARS-CoV-2. g, Volcano plot of bulk RNA-seq analysis depicting genes downregulated (blue) or induced (red) upon RDV treatment (10 μM) of SARSCoV-2 infected lung ALI organoids, 48 hours post-infection. Y-axis is -log10(p value), x axis is log2(fold change normalized to SARS-CoV-2 infection, no RDV).
Figure 6.
Figure 6.. Organoid adaptive T cell responses to SARS-CoV-2 infection.
a-b, Identification of human ALI lung organoid SARS-CoV-2–responding CD8+ T cells by AIM assay. Suspension organoids were infected with SARS-CoV-2 virus for 6 days and responding CD8+ T cells were identified based on induction of CD25, OX40, 4–1BB, and CD40L, stratified by SARS-CoV-2 seropositivity and/or infection history of the respective donor individuals. a, Individual results for 12 donors, each represented by a corresponding symbol. b, Summary results from (a), Wilcoxon matched-pairs test. c-e, Identification of SARS-CoV-2– specific CD8+ T cells in suspension human ALI lung organoids from HLA-A2+ donors using HLA-A*02:01 SARS-CoV-2-spheromers. c, Percentage of organoid SARS-CoV-2 spheromer+ CD8+ T cells out of total CD8+ T cells, stratified by SARS-CoV-2 overall seropositivity and/or infection history of the respective donor individuals. Summary results of organoids from 5 seropositive/positive infection history donors and one seronegative donor; SARS-CoV-2 NP-positive serologies are denoted, Wilcoxon matched-pairs test. d, Percentage SARS-CoV-2 spheromer+ and 4–1BB+ double-positive CD8+ T cells out of total CD8+ T cells from the donors in (c). Summary results of 5 seropositive/positive infection history donors and one seronegative donor. e, Flow cytometry plots of 4–1BB+ and SARS-CoV-2 spheromer+ double positive CD8+ T cells from (c) and (d). All gating strategies are shown in Extended Data Fig. 9a.

References

    1. Masopust D. & Soerens A.G. Tissue-Resident T Cells and Other Resident Leukocytes. Annual review of immunology 37, 521–546 (2019). - PMC - PubMed
    1. Tang J. & Sun J. Lung tissue-resident memory T cells: the gatekeeper to respiratory viral (re)infection. Curr Opin Immunol 80, 102278 (2023). - PMC - PubMed
    1. Poon M.M.L., et al. SARS-CoV-2 infection generates tissue-localized immunological memory in humans. Sci Immunol 6, eabl9105 (2021). - PMC - PubMed
    1. Paik D.H. & Farber D.L. Influenza infection fortifies local lymph nodes to promote lung-resident heterosubtypic immunity. J Exp Med 218(2021). - PMC - PubMed
    1. Bhaskar S., et al. Cytokine Storm in COVID-19-Immunopathological Mechanisms, Clinical Considerations, and Therapeutic Approaches: The REPROGRAM Consortium Position Paper. Front Immunol 11, 1648 (2020). - PMC - PubMed

Publication types