[Preprint]. 2023 May 4:2023.05.04.539425.
doi: 10.1101/2023.05.04.539425.

ZBTB7A regulates MDD-specific chromatin signatures and astrocyte-mediated stress vulnerability in orbitofrontal cortex

Affiliations

ZBTB7A regulates MDD-specific chromatin signatures and astrocyte-mediated stress vulnerability in orbitofrontal cortex

Sasha L Fulton et al. bioRxiv. .

Update in

Abstract

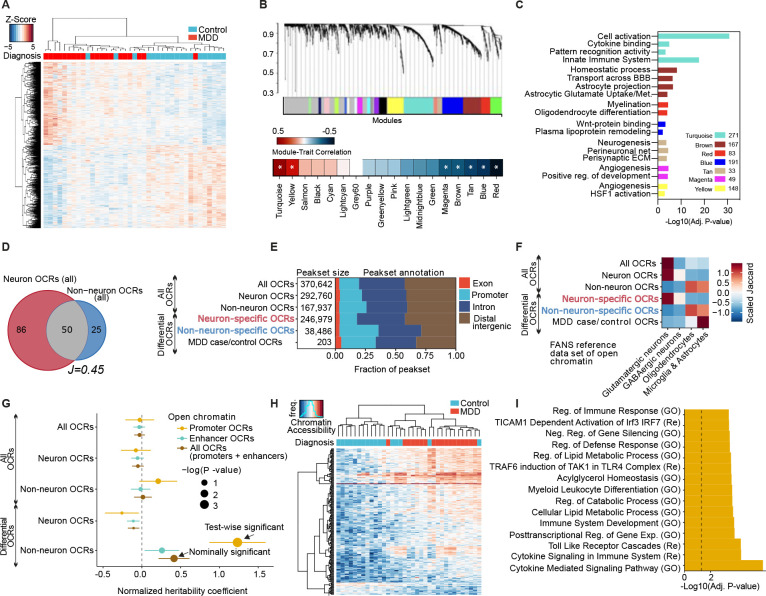
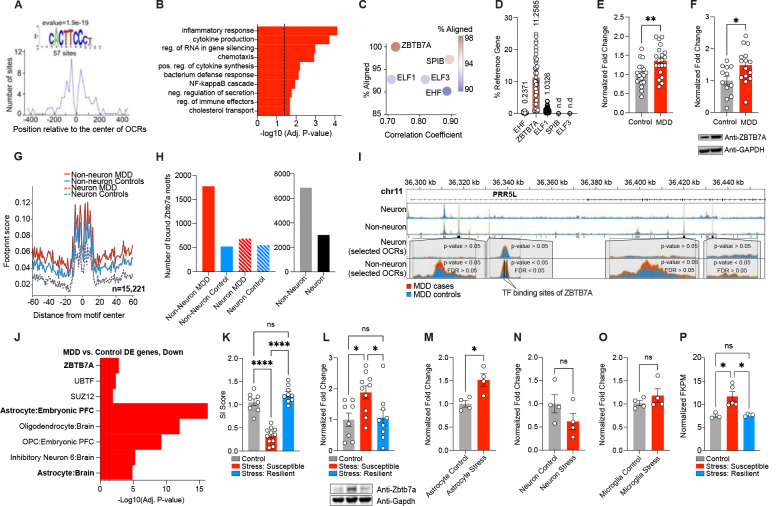
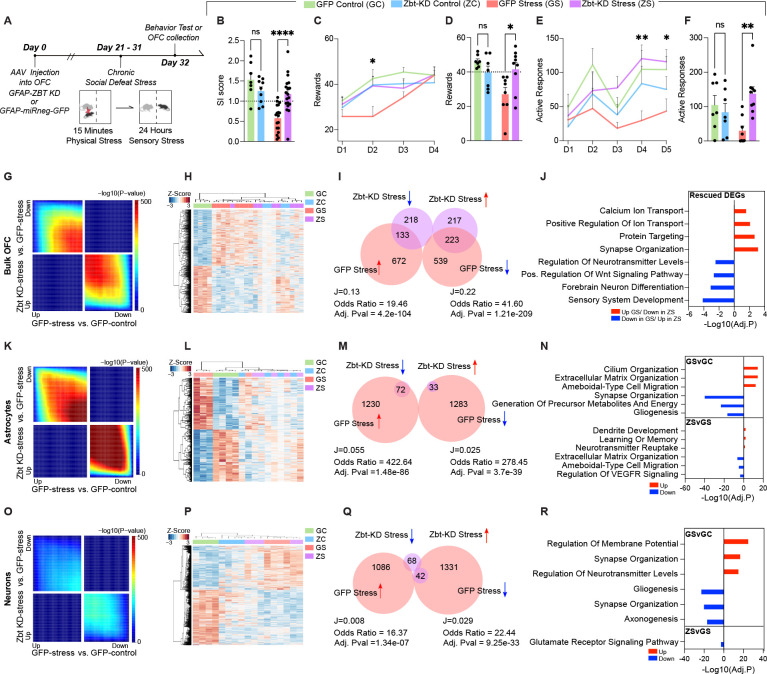
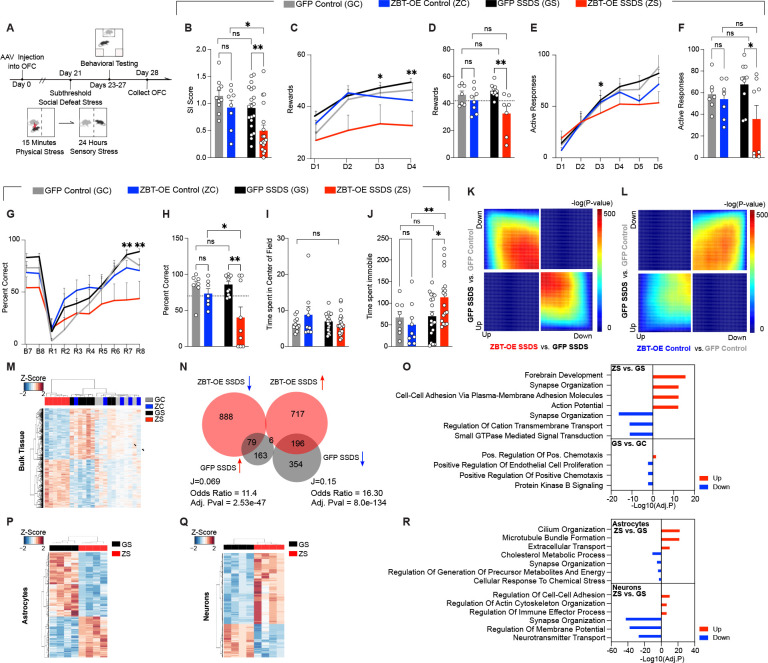
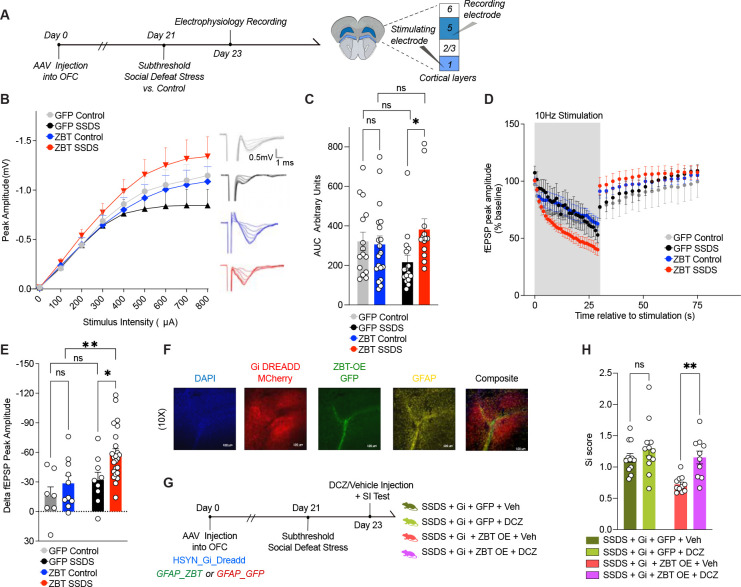
Hyperexcitability in the orbitofrontal cortex (OFC) is a key clinical feature of anhedonic domains of Major Depressive Disorder (MDD). However, the cellular and molecular substrates underlying this dysfunction remain unknown. Here, cell-population-specific chromatin accessibility profiling in human OFC unexpectedly mapped genetic risk for MDD exclusively to non-neuronal cells, and transcriptomic analyses revealed significant glial dysregulation in this region. Characterization of MDD-specific cis-regulatory elements identified ZBTB7A - a transcriptional regulator of astrocyte reactivity - as an important mediator of MDD-specific chromatin accessibility and gene expression. Genetic manipulations in mouse OFC demonstrated that astrocytic Zbtb7a is both necessary and sufficient to promote behavioral deficits, cell-type-specific transcriptional and chromatin profiles, and OFC neuronal hyperexcitability induced by chronic stress - a major risk factor for MDD. These data thus highlight a critical role for OFC astrocytes in stress vulnerability and pinpoint ZBTB7A as a key dysregulated factor in MDD that mediates maladaptive astrocytic functions driving OFC hyperexcitability.


Conflict of interest statement

Competing financial interests The authors declare no competing financial interests.

Figures

Fig. 1.
Fig. 1.. Chromatin accessibility profiling in neuronal vs. non-neuronal cells identifies glial regulatory signatures of human MDD in OFC.
(A) Clustering of MDD case and control samples at 1412 differentially expressed (DE) genes (rows, FDR < 0.1). (B) The co-expression modules identified by weighted gene correlation network analysis (WGCNA) [top] and heatmap of co-expression module correlation with MDD trait. * indicates Adj. P <. 05 significance of correlation. (C) Gene Ontology (GO) analysis for genes in significant co-expression modules. (D) Venn diagram of shared and distinct open chromatin between neuronal and non-neuronal samples. Numbers indicate megabases of OCRs, “J” indicates the Jaccard index. (E) Proportions of all and differential OCRs stratified by genomic context. (F) Overlap of all and differential OCRs with a reference study of lineage-specific brain open chromatin atlas. (G) Enrichment of common genetic variants in MDD with all and differential OCRs when assayed by LD-score regression. Sets of OCRs were further stratified by genomic context to “Promoter OCRs” overlapping the 3kb window around TSS and “Enhancer OCRs”. (H) Clustering of MDD case and control non-neuronal samples at 203 differentially accessible OCRs (rows). (I) Overlap between gene sets representing biological processes and pathways with the set of 203 differentially accessible OCRs between MDD cases and control. Top 15 enriched pathways are shown (BH-adjusted p-value < 0.05). Dashed line indicates nominal significance. “GO”: gene ontology, “Re”: REACTOME.
Fig. 2.
Fig. 2.. Identification of ZBTB7A as a key transcription factor regulating MDD-specific OCRs.
(A) Distribution of the discovered motif that is significantly enriched (e-value = 1.9e-19) in MDD-specific OCRs. (B) GO BP terms from MEME-GoMo, based on gene targets of regulatory regions containing the discovered motif. Top 10 most significant terms are shown (BH-adjusted p-value < 0.05). Dashed line indicates p = 0.05 significance. (C) Correlation coefficients for TF candidate recognition motifs against discovered motif (x-axis), and percent alignment between TF candidate recognition motifs with discovered motif (y-axis and color key) (D) Percent expression of TF candidate genes (CT value) over reference gene (HPRT1). “n.d.” indicates not detected (E) Normalized fold change of ZBTB7A transcripts in bulk OFC postmortem human tissues from MDD (n = 20) vs. control (n = 19) samples. Student’s two-tailed t-test [t37 = 3.215, **p = 0.0027] (F) Normalized fold change of ZBTB7A protein in bulk OFC postmortem human tissues from MDD (n = 15) vs. control (n = 12) samples. Student’s two-tailed t-test [t25 = 2.441, *p = 0.0221] (G) Aggregated footprint scores across ZBTB7A transcription factor binding sites that are bound in either MDD or control samples of neuronal or non-neuronal cells. Note that the effect of Tn5 transposase bias is not fully corrected, resulting into unsmoothed signal. (H) Bar graphs for number of bound ZBTB7A TFBS detected exclusively in MDD case or control samples from neuronal and non-neuronal cells (left) and exclusively in non-neuronal and neuronal populations (mixed MDD/control (right). (I) Representative pile-up traces of cell specific ATAC-seq signal overlapping PRR5L gene. Four OCRs, all being dysregulated between MDD cases and controls (p-value < 0.05) in non-neuronal cells, are highlighted. The most significantly dysregulated OCR (FDR<0.05) overlaps two transcription factor binding sites of ZBTB7A. (J) GO analysis with CellMarker Augmented Database and CHEA ENCODE Consensus database for genes in the set of downregulated DE genes from human MDD RNA-seq. (K) Social interaction ratio score for control (n = 8) vs. chronic stress: susceptible (n = 11) vs. chronic stress: resilient mouse (n = 9) groups. 1-way ANOVA [F2,25 = 66.99], followed by Tukey’s MC test: control vs. stress susceptible ****p=<.0001, stress susceptible vs. stress resilient ****p=<.0001, control vs. stress resilient ns, p = .151. (L) Normalized fold change protein expression of Zbtb7a in mouse OFC bulk tissues collected from control vs. chronic stress: susceptible vs. chronic stress: resilient mouse groups. 1-way ANOVA [F2,24 = 4.883], followed by Tukey’s MC test: control vs. stress susceptible *p = 0.03, stress susceptible vs. stress resilient *p = 0.039, control vs. stress resilient ns, p = 0.979. (M) Normalized fold change Zbtb7a mRNA expression in MACs-isolated astrocytes from chronically stressed OFC mouse tissues vs. control (n = 4/group). Two-tailed Student’s t-test [t6 = 3.458]. *p = 0.013. (N) Normalized fold change Zbtb7a mRNA expression in MACs-isolated neurons from chronically stressed OFC mouse tissues vs. control (n = 4/group). Two-tailed Student’s t-test [t6 = 1.454]. ns, p = 0.196. (O) Normalized fold change Zbtb7a mRNA expression in negative cell fraction post MACs-isolation of astrocytes and neurons, which is enriched for microglia, from chronically stressed OFC mouse tissues vs. control (n = 4/group). Two-tailed Student’s t-test [t6 = 1.053]. ns, p = 0.332. (P) FKPM values for Zbtb7a in astrocyte specific CSDS TRAP-seq data set [GSE139684], with n = 3 control, n = 5 stress: susceptible, n = 4 stress-resilient. 1-way ANOVA [F2,9 = 10.01], followed by Tukey’s MC test: control vs. stress susceptible *p = 0.012, stress susceptible vs. stress resilient *p = 0.01, control vs. stress resilient ns, p = 0.989. All data graphed as means ± SEM.
Fig. 3.
Fig. 3.. Zbtb7a in rodent OFC astrocytes is necessary to promote chronic stress-induced alterations in behavior and gene expression.
(A) Schematic of experimental timeline with CSDS paradigm performed after rAAV6 injection into OFC, followed by behavioral test and tissue collection for molecular analyses. (B) Social interaction scores. 2-way ANOVA main effect of interaction [F1,49 = 13.97], ***p = 0.0005. Sidak’s MC test, GFP control vs. GFP stress ****p< 0.0001. GFP Stress vs. Zbt-KD stress **** p<.0001. Zbt-KD control vs. Zbt-KD stress ns, p=.8663. GFP control vs. Zbt-KD control ns, p = 0.2958. (C) Pavlovian cue-reward association task. “D” = Day of task. Mixed Effects analysis, main effect of Test Day x Stress [F3,83 = 3.460] *p = 0.0200. (D) Individual values for Day two of task shown in (C). 2-way ANOVA main effect of Interaction [F1,27 = 8.500] p = 0.0071. Sidak’s MC test GFP control vs. GFP stress **p = 0.0019. GFP stress vs. Zbt-KD stress *p = 0.0119. Zbt-KD control vs. Zbt-KD stress ns, p=.9208. GFP control vs. Zbt-KD control, ns, p = 0.4086. (E) Effort-based operant reward learning task on FR1 schedule, “D” = Day of task. Mixed Effects analysis main effect of Virus x Stress [F1,27 = 5.835] *p = 0.0228. (F) Individual values for Day four of task shown in (E). 2-way ANOVA main effect of Interaction [F1,27 = 8.531] *p = 0.0070. Sidak’s MC test GFP control vs. GFP stress, *p = 0.0490. GFP stress vs. Zbt-KD stress **p = 0.0023. Zbt-KD control vs. Zbt-KD stress ns, p=.1759. GFP control vs. Zbt-KD control ns, p = 0.7740. (G) RRHO comparing gene expression for the indicated comparisons in bulk OFC tissue. Each pixel represents the overlap between differential transcriptomes, with the significance of overlap of a hypergeometric test color-coded. (H) Clustering of groups at 1,583 DE genes (FDR < 0.1) between GFP stress and GFP control in bulk OFC. (I) Scaled Venn-diagram and odds ratio test of the overlap between differentially expressed (DE) genes in bulk OFC tissues comparing Zbt-KD stress vs. GFP stress, with GFP stress vs. GFP control. “J” indicates the Jaccard index. (J) GO analysis for rescued genes in Zbt-KD stress vs. GFP-stress. (K) RRHO comparing gene expression for the indicated comparisons in MACS-isolated astrocytes. Each pixel represents the overlap between differential transcriptomes, with the significance of overlap of a hypergeometric test color-coded. (L) Clustering of groups at 2,673 DE genes (FDR < 0.1) between GFP stress and GFP control in MACS-isolated astrocytes. (M) Scaled Venn-diagram and odds ratio test of the overlap between DE genes in MACS-isolated astrocytes comparing Zbt-KD stress vs. GFP stress, with GFP stress vs. GFP control. “J” indicates the Jaccard index. (N) GO analysis for gene DEGs in GFP-stress vs. GFP control and Zbt-KD stress vs. GFP-stress, separated by up/down regulation. (O) RRHO comparing gene expression for the indicated comparisons in MACS-isolated neurons. Each pixel represents the overlap between differential transcriptomes, with the significance of overlap of a hypergeometric test color-coded. (P) Clustering of groups at 2,540 DE genes (FDR < 0.1) between GFP stress and GFP control in MACS-isolated neurons. (Q) Scaled Venn-diagram and odds ratio test of the overlap between DE genes in MACS-isolated neurons comparing Zbt-KD stress vs. GFP stress, with GFP stress vs. GFP control. “J” indicates the Jaccard index. (R) GO analysis for gene DEGs in GFP-stress vs. GFP control and Zbt-KD stress vs. GFP-stress, separated by up/down regulation. All data graphed as means ± SEM.
Fig. 4.
Fig. 4.. ZBTB7A in mouse OFC astrocytes is sufficient to induce chronic stress-mediated alterations in chromatin accessibility, gene expression, and behavior.
(A) Schematic of experimental timeline with subthreshold SSDS mild stress paradigm performed after rAAV6 injection into OFC, followed by behavioral tests and tissue collection for RNA-seq. (B) Social interaction. 2-way ANOVA main effect of stress [F1,52 = 8.144], **p = 0.0062, main effect of virus [F1,52 = 7.730], **p = 0.0075. Sidak’s MC test, GFP control vs. GFP SSDS ns, p = 0.2788. GFP SSDS vs. ZBT-OE SSDS **p = .0041. ZBT-OE control vs. ZBT-OE SSDS *p = .0286. GFP control vs. ZBT-OE control n.s. p = .4480. (C) Pavlovian cue-reward association task. “D” indicates Day of test. 3-way ANOVA, main effect of Virus x Stress [F1,29 = 5.291] *p = 0.0288. (D) Individual values for day 2 of task shown in (C). 2-way ANOVA, main effect of virus [F1,28 = 9.759], p = **0.0041. Sidak’s MC test, GFP control vs. GFP SSDS ns, p=0.651. GFP SSDS vs. ZBT-OE SSDS **p = .0021. ZBT-OE control vs. ZBT-OE SSDS ns, p = 0.146. (E) Operant reward task, FR1. “D” indicates Day of test. 3-way ANOVA, main effect of Test Day x Virus [F5,149 = 2.823] *p = 0.0182. (F) Individual values for day 3 of task shown in (E). 2-way ANOVA, main effect of virus [F1,27 = 4.408], *p = 0.0453. Sidak’s MC test, GFP control vs. GFP SSDS ns, p=0.709. GFP SSDS vs. ZBT-OE SSDS *p = .0218. ZBT-OE control vs. ZBT-OE SSDS ns, p = 0.282. (G) Percent correct trials in reversal learning paradigm. “B” indicates Baseline day, “R” indicates Reversal phase day. 3-way ANOVA, main effect of Test day x Virus [F9,261 = 4.529] p < 0.0001. (H) Individual values for day 7 as shown in (G). 2-way ANOVA, main effect of virus [F1,30 = 9.017], **p = 0.0054. Sidak’s MC test, GFP control vs. GFP SSDS ns, p=0.9797. GFP SSDS vs. ZBT-OE SSDS **p = .0013. ZBT-OE control vs. ZBT-OE SSDS *p = 0.0389. GFP control vs. ZBT-OE control n.s., p = 0.7280. (I) Time spent (s) in the center of the field during open field test. 2-way ANOVA ns, (J) Forced Swim tests. 2-way ANOVA main effect of interaction [F1,50 = 4.129], *p = 0.0475, main effect of stress [F1,50 = 4.993], *p = 0.0475. Sidak’s MC test, GFP control vs. GFP SSDS ns, p=0.9876. GFP SSDS vs. ZBT-OE SSDS **p = 0.0070. (K-L) RRHO comparing gene expression between indicated comparisons, in the context of mild stress. (M) Clustering at 1,929 DE genes between ZBT-OE SSDS and GFP SSDS. (N) Scaled Venn-diagram and odds ratio test of the overlap between differentially expressed (DE) genes in bulk OFC tissues comparing ZBT-OE stress vs. GFP SSDS, with GFP SSDS vs. GFP control. “J” indicates the Jaccard index. Note for GFP SSDS vs. GFP control, DEGs were defined at pval < 0.05 (O) GO analysis for gene DEGs in ZBT-OE SSDS vs. GFPSSDS and GFP SSDS vs. GFP control, separated by up/down regulation. All data graphed as means ± SEM. (P) Clustering at 715 DE genes between ZBT-OE SSDS and GFP SSDS astrocytes (n = 4/group). (Q) Clustering at 1,191 DE genes between ZBT-OE SSDS and GFP SSDS neurons (n = 4/group). (R) GO analysis for DE genes (FDR < 0.1) between ZBT-OE SSDS and GFP SSDS groups in MACs-isolated astrocytes and neurons, separated by up/down regulation.
Fig. 5.
Fig. 5.. ZBTB7A in mouse OFC astrocytes induces cell non-autonomous neuronal hyperexcitability to mediate stress susceptibility.
(A) Schematic of experimental timeline with subthreshold stress paradigm performed after AAV6 injection into OFC, followed by slice electrophysiology recordings. (B) Input-output (I-O) curve constructed by recording fEPSPs in response to stimuli ranging from 100–800 μA. 3-way ANOVA, main effect of Stimulus Intensity x Virus x Stress [F8,480 = 2.626] **p = 0.0080. (C) Individual values for (I-O) curve, area under curve (A.U.C). 2-way ANOVA main effect of Interaction [F1,59 = 4.062], *p = 0.0484. Sidak’s MC test, GFP control vs. GFP stress ns, p=0.1923. GFP Stress vs. ZBT-OE stress *p = 0.0295. ZBT-OE control vs. ZBT-OE stress n.s., p = 0.4230. GFP control vs. ZBT-OE control n.s., p= 0.9597. (D) Rundown stimulation from a single 30-s train delivered at 10 Hz. The percentage change in fEPSP amplitude from baseline was calculated during and post-10Hz stimulation. 3-way ANOVA, main effect of Stimulus x Virus [F29,1334 = 3.376] ***p < 0.0001, main effect of stress x virus [F1,46 = 4.356] *p = 0.0425. (E) Individual values for delta fEPSP amplitude (% baseline) between end of 10Hz stimulation and 1s after end of stimulation train. 2-way ANOVA main effect of virus [F1,46 = 6.115], p = 0.0172, main effect of stress [F1,46 = 8.454], **p = 0.0056. Sidak’s MC test, GFP control vs. GFP stress ns, p=0.5172. GFP Stress vs. ZBT-OE stress *p = 0.0207. ZBT-OE control vs. ZBT-OE stress **p = 0.0059. GFP control vs. ZBT-OE control n.s., p= 0.5172. (F) IHC validation of hsyn-hM4D(Gi)-mCherry (in red) and GFAP-ZBT OE (in green) localized in astrocytes (GFAP, in yellow) and DAPI (in blue). Images taken at 10x magnification. (G) Experimental scheme of chemogenetics experiment, in which SSDS is performed on a cohort of mice expressing hM4D(Gi)-mCherry (+/−) ZBT OE, (+/−) DCZ. (H) Social interaction. 2-way ANOVA main effect of Virus [F1,41 = 10.11], **p = 0.0028, main effect of agonist [F1,41 = 10.65], **p = 0.0022. Sidak’s MC test, Gi + GFP stress + vehicle vs. Gi + GFP stress + DCZ ns, p=0.3880. Gi + ZBT-OE stress + vehicle vs. Gi + ZBT-OE stress + DCZ **p = 0.0040. All data graphed as means ± SEM.

References

    1. Kessler R. C. et al. The epidemiology of major depressive disorder: results from the National Comorbidity Survey Replication (NCS-R). Jama 289, 3095–3105 (2003). - PubMed
    1. Rolls E. T. The orbitofrontal cortex and emotion in health and disease, including depression. Neuropsychologia 128, 14–43 (2019). - PubMed
    1. Treadway M. T., Bossaller N. A., Shelton R. C. & Zald D. H. Effort-based decision-making in major depressive disorder: a translational model of motivational anhedonia. Journal of abnormal psychology 121, 553 (2012). - PMC - PubMed
    1. Cléry-Melin M.-L. et al. Why don’t you try harder? An investigation of effort production in major depression. PloS one 6, e23178 (2011). - PMC - PubMed
    1. Sherdell L., Waugh C. E. & Gotlib I. H. Anticipatory pleasure predicts motivation for reward in major depression. Journal of abnormal psychology 121, 51 (2012). - PMC - PubMed

Publication types