[Preprint]. 2024 Apr 21:2023.05.04.538989.
doi: 10.1101/2023.05.04.538989.

Keratin isoform shifts modulate motility signals during wound healing

Affiliations

Keratin isoform shifts modulate motility signals during wound healing

Benjamin A Nanes et al. bioRxiv. .

Update in

Abstract

Keratin intermediate filaments form strong mechanical scaffolds that confer structural stability to epithelial tissues, but the reason this function requires a protein family with 54 isoforms is not understood. During skin wound healing, a shift in keratin isoform expression alters the composition of keratin filaments. How this change modulates cellular function to support epidermal remodeling remains unclear. We report an unexpected effect of keratin isoform variation on kinase signal transduction. Increased expression of wound-associated keratin 6A, but not of steady-state keratin 5, potentiated keratinocyte migration and wound closure without compromising epidermal stability by activating myosin motors. This pathway depended on isoform-specific interaction between intrinsically disordered keratin head domains and non-filamentous vimentin shuttling myosin-activating kinases. These results substantially expand the functional repertoire of intermediate filaments from their canonical role as mechanical scaffolds to include roles as isoform-tuned signaling scaffolds that organize signal transduction cascades in space and time to influence epithelial cell state.


Figures
Figure 1.
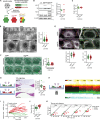
Figure 1.. Epidermal remodeling triggers a keratin isoform switch.
A. Diagram of keratin isoforms expressed in steady-state and actively remodeling epidermis. B. Top: Schematic diagram of a skin excision following a diagnostic biopsy, which includes healing edges from the biopsy wound. Middle: Hematoxylin and eosin (H&E)-staining. Dotted outlines, epidermal migration fronts. Epidermal layers: B, basal; S, spinous (suprabasal); C, cornified. Bottom: Immunofluorescence labeling of wound-associated K6 and K17, and steady-state basal epidermal K5. Red dotted outline, epidermal migration front at the wound edge; Green dotted outline, intact epidermis away from the wound. C. Intermediate filament expression in acute (Top, GSE97615) and chronic (Bottom, GSE80178) human skin wounds and intact skin controls. D-E. Confluent keratinocyte monolayers were scratched with a pipette tip to create wounds, allowed to migrate for 24-hours, then fixed, labeled for immunofluorescence of steady-state K5 and wound-associated K6 (D) or K17 (E), and imaged. In (E), images of the migration edge and monolayer interior were acquired with the same illumination and detection settings.

F. Keratinocyte monolayers were preserved intact or repeatedly scratched with a pipette tip (see Methods), then processed for RNA isolation and quantification of keratin transcript levels by qRT-PCR. Individual keratin transcript levels were compared to the average level of all keratin transcripts measured. n = 3 monolayers per group. G-H. Keratinocytes were cultured at an air-liquid interface to induce stratification. G, Hematoxylin and eosin (H&E) staining after different growth periods. H, Immunofluorescence labeling of a basal epidermal keratin, K5, and a differentiated epidermal keratin, K10. I. Top: Schematic diagram of the epidermal culture wound model. Removal of a barrier mold allows keratinocytes from the stratified culture to migrate into the “wound” area (see Methods). Middle: H&E staining after 72 hours of migration. Arrow, prior location of the barrier. Epidermal layers: B, basal; S, spinous (suprabasal); C, cornified. Bottom: Immunofluorescence labeling of wound-associated K6 and K17, and a steady-state basal K5. Left, migration edge; Right, epidermal culture interior. Dashed vertical lines, image re-alignment correcting for folds in the tissue section. See also Figure S1B.
Figure 2.
Figure 2.. Wound-associated K6A supports epidermal migration without compromising mechanical stability.
A. Schematic diagram of the gain-of-function keratin expression model. Cultured keratinocytes were transduced with lentivirus to express tagged K5 and K6A, then divided by fluorescence activated cell sorting into different populations including those with high levels of K5 (K5high), high levels of K6A (K6Ahigh), high levels of both keratins (K5hiK6Ahi), and low levels of both keratins (K5loK6Alo). B. Western blot analysis of endogenous (K5, K6) and exogenously expressed (K5-G, K6-R) keratins in parental (wt), K5high, and K6Ahigh cell lines (see also Figure S1E). Right: Ratio of K5-G or K6-R to K5 or K6. n = 4 samples per group. C. Proliferation of K5high and K6Ahigh cells in culture measured by uptake of 5-ethynyl-2’-deoxyuridine (EdU) during a 60-minute incubation. Proliferation index, defined as the percentage of nuclei with EdU incorporation. n = 6 samples per group. D. Transmission electron micrographs of K5high and K6Ahigh monolayers. Insets highlight typical electron-dense cell-cell junction complexes. Right, distribution of junction complex widths. n = 314–348 junctions from 40–41 images per group. E. Fluorescence imaging of K5high and K6Ahigh cell monolayers with partial segmentation of keratin and actin filament networks. Desmosomes and adherens junctions were identified, respectively, by keratin and actin filament bridges between adjacent cells. n = 55–71 cell-cell borders from 17–18 images per group. F. Mechanical stability of keratinocyte monolayers measured using a dispase-based fragmentation assay (see Methods). n = 12 monolayers per group. G. Paired epidermal cultures separated by a 500-μm barrier were grown from K5high and K6Ahigh cells. Following removal of the barrier and 12-hours of migration, the remaining gap width was measured in H&E-stained tissue sections. n = 8–9 epidermal culture pairs per group. H-K. Live imaging of epidermal migration. Paired epidermal cultures separated by a 500-μm barrier were grown with K5high and K6Ahigh cell lines on opposite sides of each barrier. Following barrier removal, cells were imaged over 24 hours (H; see also Video 1; see Methods). Red and green lines, farthest migration extent of the K6Ahigh and K5high culture halves at each time point. I, Difference in migration distance, defined as farthest distance migrated by the K6Ahigh half minus farthest distance migrated by the K5high half. Each line represents one culture pair. J, Average migration speed over 20-hours, defined as farthest migration distance divided by total time. K, Time needed to reach the designated distance checkpoint. Dots represent culture pairs, with x- and y-axis location corresponding to time required for the K5high and K6Ahigh halves to reach the designated distance. Dots blow the diagonal represent culture pairs where the K6Ahigh half reached the designated distance checkpoint first; dots above the diagonal represent culture pairs where the K5high half reached the checkpoint first. n = 16 epidermal culture pairs.
Figure 3.
Figure 3.. Wound-associated K6A supports keratinocyte migration in monolayers and single cells.
A. Schematic diagram of a mosaic monolayer containing K5high (green), K6Ahigh (red), K5high/K6Ahigh (K5hi6hi, yellow), and K5low/K6Alow (K5lo6lo, grey) cells during migration. Local migration speeds are compared between different keratin expression regions. B. Top: Keratin expression regions. Bottom: Local migration speeds calculated using a computer vision pipeline (see Methods). White lines, 200-μm band tracking the wound edge. See also Video 3. C. Time courses of average local migration speed 10-μm to 200-μm from the wound edge aligned relative to the global peak in migration speed. n = 36 scratch wounds. D. Relative local migration speed within each keratin expression region at different time points relative to the peak in migration speed. Relative local speeds are defined as the local migration speed for a keratin expression region minus the average migration speed across all regions 10-μm to 200-μm from the migration edge. n = 36 scratch wounds. E-F. Pairwise comparison of average local migration speed between keratin expression regions at the peak in migration speed (E) and 2-hours later (F). Each point represents one scratch wound, with x- and y-axis location corresponding to the migration speed in different keratin expression regions. n = 36 scratch wounds. See also Video 4. G-I. Movement of sparsely seeded, individual K5high and K6Ahigh keratinocytes. G, Cell trajectories aligned at the initial position, including the first hour of each track within the time window. Rings, quantiles of maximum distance from the origin. See also Video 5. H-I, Mean track velocity (H) and mean squared displacement rate (I) in K5high and K6Ahigh cells. n = 7–10 movies with 144–232 tracks per group.
Figure 4.
Figure 4.. Wound-associated K6A alters keratin filament network dynamics.
A. Keratin filaments in K5high and K6Ahigh cells. Right, pseudo-color overlay of filament images captured 3 minutes apart. B. Filament networks segmented using a computer vision pipeline (see Methods). As in (A), overlay of networks 3 minutes apart displays the dynamics of the network architecture. See also Video 6. C. Schematic diagram of filament dynamics score calculation (see Methods). D. Smoothed maps of local filament dynamics scores over different time intervals in K5high and K6Ahigh cells. E. Spatially averaged filament dynamics scores for each cell. n = 110–139 cells in 24–25 movies per group. F. Comparison of filament dynamics scores between keratinocyte cell lines expressing chimeric keratins containing the head and tail domains of K5 or K6A joined to the rod domain of the opposite keratin (K5h6r5t and K6h5r6t). n = 51–52 cells in 21–29 movies per group. G-H. Comparison of filament dynamics scores between keratinocyte cell lines expressing chimeric keratins containing only the head (G; K6Ah5rt) or tail (H; K5hr6At) domains of K6A joined to the remainder of K5 with K5high cells. G, n = 44–47 cells in 28 movies per group. H, n = 45–60 cells in 37–39 movies per group.
Figure 5.
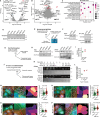
Figure 5.. Wound-associated K6A increases cellular force generation by activating myosin.
A. Traction force microscopy (TFM) of K5high and K6Ahigh cells (see Methods). Left, reconstructed traction vectors (arrows) on a heatmap of force magnitude and a watermark of keratin filament images (partially captured by the TIRF field). Inner ring, cell border based on keratin images; Outer ring, expanded boundary for strain energy calculation (see also Figure S4C). Right, strain energy density in K5high and K6Ahigh cells. Outlined dots, connected between groups, mean values of experimental replicates in separate batches of TFM substrates. n = 51–58 cells per group. B. TFM of cells expressing a chimeric keratin containing the head domain of K6A joined to the rod and tail of K5 (K6Ah5rt) or full-length K5. See also Figure S4E. n = 40 cells per group. C. Schematic diagram of the proximity ligation assay (PLA). D. PLA detecting activated myosin by colocalization of phosphorylated myosin regulatory light chain (pRLC) and non-muscle myosin heavy chain (MYH9). Left, annotated images of K5high (green outline) and K6Ahigh (red outline) cells. White diamonds, PLA detections (see Methods). Heatmap, PLA density (detections per 100 μm). K5-G, K5-mNeonGreen; K6A-R, K6A-mRuby2. Right, PLA detection density in K5high and K6Ahigh cells. Outlined dots, connected between groups, mean values of experimental replicates. n = 66–80 cells per group in 37 total images. E-F. PLA detecting activated myosin near keratin filaments by colocalization of pRLC and K5 (E) or K17 (F). E, n = 94–115 cells per group in 20 images. F, 99–108 cells per group in 23 images. G-H. PLA detecting total myosin near keratin filaments by colocalization of total myosin regulatory light chain (RLC) and K5 (G) or K17 (H). G, n = 117–119 cells per group in 19 images. H, 121–129 cells per group in 21 images.
Figure 6.
Figure 6.. Wound-associated K6A recruits non-filamentous vimentin to keratin filaments.
A-B. Proteins differentially associated with keratin filaments in K5high cells versus K6Ahigh cells were identified by proximity biotinylation, streptavidin pulldown, and mass spectrometry (see Methods). A, Volcano plot highlighting differentially associated proteins. B, Differential association compared to the maximum protein abundance across all samples. n = 2 independent replicates per group. C. Most enriched Gene Ontology Biologic Process labels among proteins differentially associated with keratin filaments between K5high and K6Ahigh cells, defined as greater than 3-fold differential association and Padj < .05. See also Figure S5A. D. Western blot analysis of vimentin expression in K5high and K6Ahigh cells. See also Figure S1E for additional blots with these samples; β-actin control repeated for reference. E-F. Keratin immunoprecipitation (IP) from K5high and K6Ahigh cells expressing FLAG-tagged keratins. E, Schematic diagram of experiment with images of the large insoluble fraction remaining following lysis with an IP-compatible buffer (see Methods). F, Western blot analysis of the soluble fraction (Input) and IP with anti-FLAG beads. Krt-FLAG, tagged keratin; Ig HC, immunoglobulin heavy chain. G-I. Cell fractionation from K5high and K6Ahigh cells expressing FLAG-tagged keratins. G, Schematic diagram of experiment. Following covalent crosslinking and lysis with a 6.5M urea buffer, lysates were separated into soluble and insoluble fractions (see Methods). H, Western blot analysis of the soluble supernatants (Sup.) and insoluble pellets. I, Quantification of the fraction of vimentin found in the pellet for each sample. J-L. Co-sedimentation analysis of in-vitro polymerized keratin filaments and unpolymerized vimentin. J, Schematic diagram of experiment. Fluorescently labelled K14 (K14–488) and either K5, K6A, or K6Ah5rt chimera were polymerized in vitro, mixed with unpolymerized fluorescently labeled vimentin (Vim-Cy3), and centrifuged at low speed to pellet intermediate filament polymers (see Methods). K, Fluorescence and Coomassie-stain images of gel electrophoresis of the pellets. Upper and lower gels represent independent experimental replicates. Note that each experimental replicate contains two each K5/K14 and vimentin control samples, which were averaged for quantification. L, Vimentin to keratin ratio in pellets, after subtracting the average amount of pelleted vimentin in the absence of keratin. M-N. Proximity ligation assay (PLA) detecting colocalization between vimentin and K5 (M) or K17 (N). Left, annotated images as in Figure 5D. Right, PLA detection density. Outlined dots, connected between groups, mean values of experimental replicates. M, n = 103–113 cells per group in 17 images. N, n = 84–105 cells per group in 18 images. O-P. PLA detecting colocalization between vimentin and ROCK (O) or MLCK (P). Note the different detection density ranges in (O) and (P). O, n = 87–121 cells per group in 20 images. P, n = 80–105 cells per group in 19 images.
Figure 7.
Figure 7.. Vimentin shuttles regulatory kinases to activate myosin near K6A-containing filaments
A. Schematic diagram of the proposed model. Non-filamentous vimentin (Vim) shuttles regulatory kinases preferentially to K6A-containing filaments, where they phosphorylate myosin regulatory light chain. B. Western blot analysis of vimentin knockdown by shRNA (shVim#1; shVim#2; scrambled control, shScrm) in keratinocytes expressing a chimeric keratin containing the head domain of K6A joined to the rod and tail of K5 (K6Ah5rt) or full-length K5 (K5high). Dashed line separates different brightness adjustments for different baseline vimentin levels. See also Figure S7B for an alternate display. C. Death of K5high and K6Ah5rt cells upon expression of shVim#2 versus shScrm. Cell death index, percentage of nuclei with membrane-impermeable DNA dye uptake (see Methods). *, P < .05. n = 4–5 samples with 112–162 total cells per group. D. Proliferation of K5high and K6Ah5rt cells upon expression of shVim#2 versus shScrm. Proliferation index, percentage of cells with EdU uptake (see Methods). *, P < .05. n = 4 samples with 2,897–6,013 total cells per group. E. Proliferation of RPE-1 retinal epithelial cells upon expression of shVim#2 versus shScrm. n = 6 samples with 1,853–1,930 total cells per group. F. Traction force microscopy (TFM) of K6Ah5rt cells upon expression of shVim#1, shVim#2, or shScrm. Left, reconstructed traction force vectors (arrows) on a heatmap of force magnitude and a watermark of keratin filament images. Inner ring, cell border based on keratin images. Outer ring, expanded boundary used for strain energy calculation. Right, comparison of strain energy densities between treatment groups. Outlined dots, connected between groups, mean values of experimental replicates in separate batches of TFM substrates. ***, P < 10−3; **, P < .01. n = 29–43 cells per group. G. TFM of K6Ah5rt or K5high cells upon expression of shVim#2, or shScrm. Annotations as in (F). n = 18–21 cells per group. H. PLA detecting myosin activation by colocalization of phosphorylated myosin regulatory light chain (pRLC) and non-muscle myosin heavy chain (MYH9) in K6Ahigh and K5high cells upon expression of shVim#2 or shScrm. ***, P < 10−3. n = 67–113 cells per group in 16–24 images per shRNA condition. I. Keratin filament network dynamics in K6Ah5rt cells and K5high cells upon expression of shVim#2 or shScrm. See also Figure S7C for filament images, segmentations, and dynamics score maps. ***, P < 10−3; **, P < .01; *, P < .05. n = 39–49 cells per group.

References

    1. Gonzales K. A. U. & Fuchs E. Skin and Its Regenerative Powers: An Alliance between Stem Cells and Their Niche. Dev Cell 43, 387–401 (2017). 10.1016/j.devcel.2017.10.001 - DOI - PMC - PubMed
    1. Hatzfeld M., Keil R. & Magin T. M. Desmosomes and Intermediate Filaments: Their Consequences for Tissue Mechanics. Cold Spring Harb Perspect Biol 9 (2017). 10.1101/cshperspect.a029157 - DOI - PMC - PubMed
    1. Moll R., Divo M. & Langbein L. The human keratins: biology and pathology. Histochem Cell Biol 129, 705–733 (2008). 10.1007/s00418-008-0435-6 - DOI - PMC - PubMed
    1. Toivola D. M., Boor P., Alam C. & Strnad P. Keratins in health and disease. Curr Opin Cell Biol 32, 73–81 (2015). 10.1016/j.ceb.2014.12.008 - DOI - PubMed
    1. Shaw T. J. & Martin P. Wound repair at a glance. J Cell Sci 122, 3209–3213 (2009). 10.1242/jcs.031187 - DOI - PMC - PubMed

Publication types