[Preprint]. 2023 May 2:2023.05.02.539144.
doi: 10.1101/2023.05.02.539144.

A leaky integrate-and-fire computational model based on the connectome of the entire adult Drosophila brain reveals insights into sensorimotor processing

Affiliations

A leaky integrate-and-fire computational model based on the connectome of the entire adult Drosophila brain reveals insights into sensorimotor processing

Philip K Shiu et al. bioRxiv. .

Update in

  • A Drosophila computational brain model reveals sensorimotor processing.
    Shiu PK, Sterne GR, Spiller N, Franconville R, Sandoval A, Zhou J, Simha N, Kang CH, Yu S, Kim JS, Dorkenwald S, Matsliah A, Schlegel P, Yu SC, McKellar CE, Sterling A, Costa M, Eichler K, Bates AS, Eckstein N, Funke J, Jefferis GSXE, Murthy M, Bidaye SS, Hampel S, Seeds AM, Scott K. Shiu PK, et al. Nature. 2024 Oct;634(8032):210-219. doi: 10.1038/s41586-024-07763-9. Epub 2024 Oct 2. Nature. 2024. PMID: 39358519 Free PMC article.

Abstract

The forthcoming assembly of the adult Drosophila melanogaster central brain connectome, containing over 125,000 neurons and 50 million synaptic connections, provides a template for examining sensory processing throughout the brain. Here, we create a leaky integrate-and-fire computational model of the entire Drosophila brain, based on neural connectivity and neurotransmitter identity, to study circuit properties of feeding and grooming behaviors. We show that activation of sugar-sensing or water-sensing gustatory neurons in the computational model accurately predicts neurons that respond to tastes and are required for feeding initiation. Computational activation of neurons in the feeding region of the Drosophila brain predicts those that elicit motor neuron firing, a testable hypothesis that we validate by optogenetic activation and behavioral studies. Moreover, computational activation of different classes of gustatory neurons makes accurate predictions of how multiple taste modalities interact, providing circuit-level insight into aversive and appetitive taste processing. Our computational model predicts that the sugar and water pathways form a partially shared appetitive feeding initiation pathway, which our calcium imaging and behavioral experiments confirm. Additionally, we applied this model to mechanosensory circuits and found that computational activation of mechanosensory neurons predicts activation of a small set of neurons comprising the antennal grooming circuit that do not overlap with gustatory circuits, and accurately describes the circuit response upon activation of different mechanosensory subtypes. Our results demonstrate that modeling brain circuits purely from connectivity and predicted neurotransmitter identity generates experimentally testable hypotheses and can accurately describe complete sensorimotor transformations.


Figures
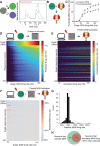
Figure 1.
Figure 1.. The computational model accurately predicts neurons that respond to sugar stimulation and neurons required for proboscis extension to sugar.
A. Schematic of the leaky integrate-and-fire model. Activation of the grey neuron at the times indicated by the arrows results in depolarization of the green and purple neurons in proportion to their connectivity from the grey neuron. When the membrane potential of the green neuron reaches the firing threshold, this neuron fires, and its membrane potential is reset to the resting potential. B. Schematic of the proboscis extension response: presentation of sugar results in extension of the proboscis. C. Predicted MN9 firing rate of either the ipsilateral or contralateral MN9 in response to unilateral right-hemisphere sugar GRN activation. D. Heatmap depicting the predicted firing rates in response to unilateral 10 to 200 Hz sugar GRN firing. The y-axis is ordered by firing rate at 200 Hz sugar activation, and depicts the top 200 most active neurons. E. Heatmap depicting the predicted MN9 firing rate when the top 200 responsive neurons are activated at 25–200 Hz. F. Heatmap depicting the change in the contralateral MN9 firing rate in response to activation of sugar GRNs at the specified firing rate, while individually silencing each of the top 200 responsive neurons. For E and F, the y-axis is ordered as in D. G. Histogram of the non-GRNs in F at 50 Hz. H. Venn diagram depicting the intersection between neurons predicted to activate MN9 and neurons predicted to cause a 20% decrease in MN9 firing when silenced.
Figure 2.
Figure 2.. The computational model predicts neurons that elicit MN9 firing.
A. Predicted MN9 firing rates when each of 106 cell types are computationally activated at 50 Hz. Cell types are ordered by predicted MN9 firing rate. B. Fraction of flies extending MN9 in response to optogenetic activation. Cell types are ordered as in A. n = 10 flies per cell type.
Figure 3.
Figure 3.. The computational model correctly predicts that Ir94e neurons are aversive, but fail to inhibit proboscis extension to a strong sugar stimulus.
A-B. Heatmap depicting the predicted MN9 firing rates in response to the combination of sugar GRN firing and bitter (A) or Ir94e (B) GRN activation. C-D. The fraction of flies exhibiting proboscis extension response upon 50 mM sucrose stimulation or 1M sucrose stimulation when Gr66a/bitter GRNs (C) or Ir94e/“low salt” GRNs (D) are optogenetically activated. Red bars indicate red light condition. n=26–32. Mean +/− 95% confidence intervals, Fisher’s exact test, ***p<.001.
Figure 4.
Figure 4.. The computational model correctly predicts that the sugar and water pathways share components and additively promote proboscis extension.
A. Heatmap depicting the predicting firing rates in response to 20 to 260 Hz water GRN firing. The y-axis is ordered by firing rate at 260 Hz water activation. B. Heatmap depicting the predicted MN9 firing rate when the top 200 responsive neurons are activated at 25–200 Hz. C. Heatmap depicting the change in MN9 firing rate in response to activation of water GRNs at the specified firing rate, while individually silencing each of the top 200 responsive neurons. D. The fraction of flies exhibiting proboscis extension response upon water stimulation. All but Usnea are predicted to cause water silencing phenotypes. Green bars indicate green light condition. n = 30–50. E. Heatmap depicting the predicted MN9 firing rates in response to the combination of sugar and water GRN activity. F. The fraction of flies exhibiting proboscis extension response upon water stimulation. D, F: Mean +/− 95% confidence intervals, Fisher’s exact test, **p<.01, ***p<.001.
Figure 5.
Figure 5.. The computational model correctly identifies key neurons in the antennal grooming circuit as well as subtype circuit responses.
A. Schematic of the known antennal grooming functional connectivity circuit. Arrows represent known functional connectivity (Hampel et al., 2015). Grey oval around aDNs indicates that JONs activate aDNs, but exactly which aDNs are not known. B. Heatmap depicting the predicting firing rates in response to 20 to 220 Hz JON firing. 147 JONs were activated, and are the neurons that have the highest firing rates. The top 300 most responsive neurons are shown. Neurons are ordered by firing rate at 220 Hz C. Heatmap depicting the predicted aDN1 firing rate when the top 300 responsive neurons are activated at 25–200 Hz. D. Heatmap depicting the change in aDN1 firing rate in response to activation of JOs at the specified firing rate, while individually silencing each of the top responsive neurons. E. Histogram of the predicted change in aDN1 firing rate as a result of silencing each non-JONs, when JONs are activated at 140 Hz. Y-axis depicts the number of neurons in each bin. Neurons previously identified are labeled. F. Venn diagram depicting the overlap between neurons predicted to be sufficient to activate aDN1 and neurons required for aDN1 activation. G. JO subtype connectivity onto aBN1 and predicted aBN1 firing in response to JO activation at the specified rate. H. Calcium imaging of aBN1 in response to optogenetic activation of each subtype.

References

    1. Baker CA, McKellar C, Nern A, Dorkenwald S, Dickson BJ, Murthy M. Neural network organization for courtship-song feature detection in Drosophila. 2022. Current Biology. 32, 3317–3333.e7 doi: 10.1016/j.cub.2022.06.019 - DOI - PMC - PubMed
    1. Bargmann CI. 2012. Beyond the connectome: How neuromodulators shape neural circuits. Bioessays 34:458–465. doi:10.1002/bies.201100185 - DOI - PubMed
    1. Bargmann CI, Marder E. 2013. From the connectome to brain function. Nat Methods 10:483–490. doi:10.1038/nmeth.2451 - DOI - PubMed
    1. Bates AS, Schlegel P, Roberts RJV, Drummond N, Tamimi IFM, Turnbull R, Zhao X, Marin EC, Popovici PD, Dhawan S, Jamasb A, Javier A, Serratosa Capdevila L, Li F, Rubin GM, Waddell S, Bock DD, Costa M, Jefferis GSXE. 2020. Complete Connectomic Reconstruction of Olfactory Projection Neurons in the Fly Brain. Current Biology 30:3183–3199.e6. doi:10.1016/j.cub.2020.06.042 - DOI - PMC - PubMed
    1. Buhmann J, Sheridan A, Malin-Mayor C, Schlegel P, Gerhard S, Kazimiers T, Krause R, Nguyen TM, Heinrich L, Lee W- CA, Wilson R, Saalfeld S, Jefferis GSXE, Bock DD, r SC, Cook M, Funke J. 2021. Automatic detection of synaptic partners in a whole-brain Drosophila electron microscopy data set. Nat Methods 18:771–774. doi:10.1038/s41592-021-01183-7 - DOI - PMC - PubMed

Publication types