[Preprint]. 2023 May 2:rs.3.rs-2814118.
doi: 10.21203/rs.3.rs-2814118/v1.

The thioredoxin system determines CHK1 inhibitor sensitivity via redox-mediated regulation of ribonucleotide reductase activity

Affiliations

The thioredoxin system determines CHK1 inhibitor sensitivity via redox-mediated regulation of ribonucleotide reductase activity

Chandra Bhushan Prasad et al. Res Sq. .

Update in

Abstract

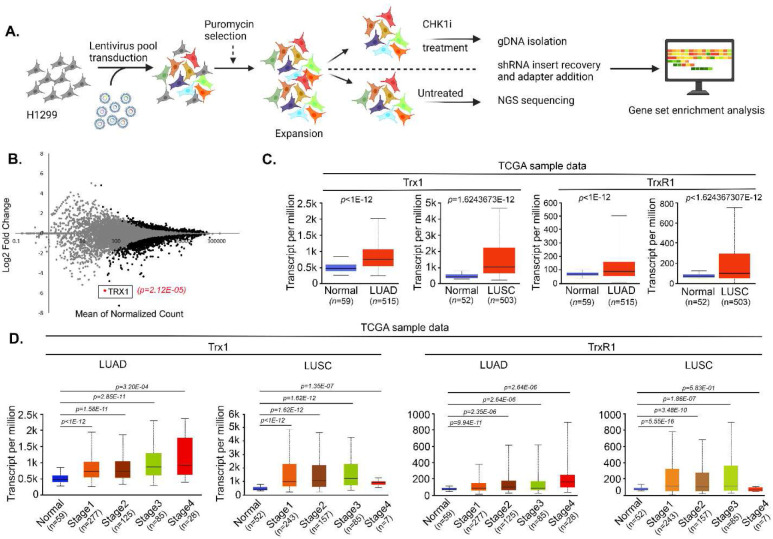
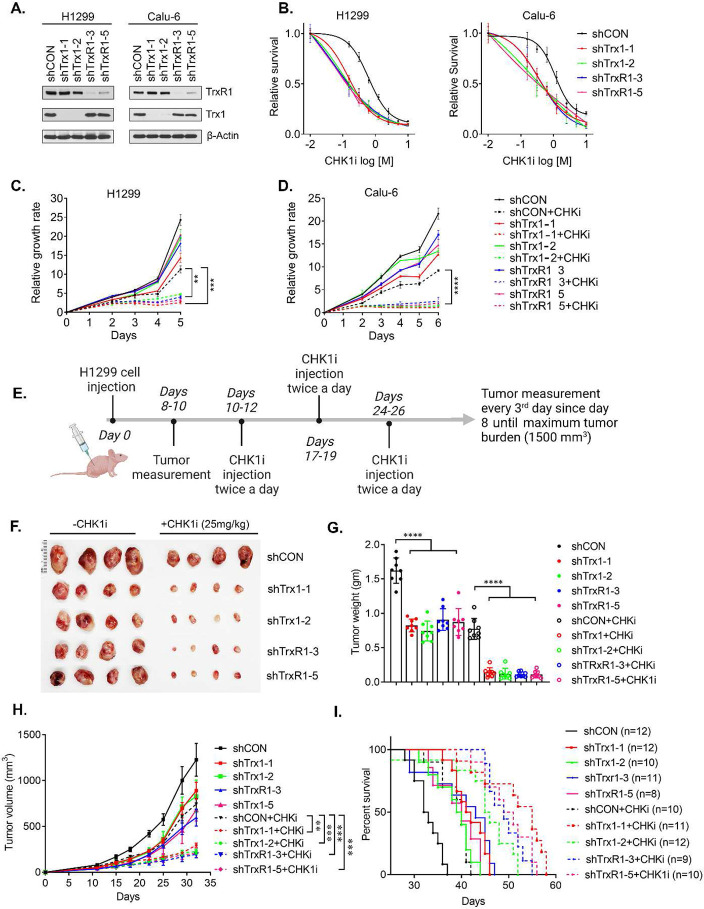
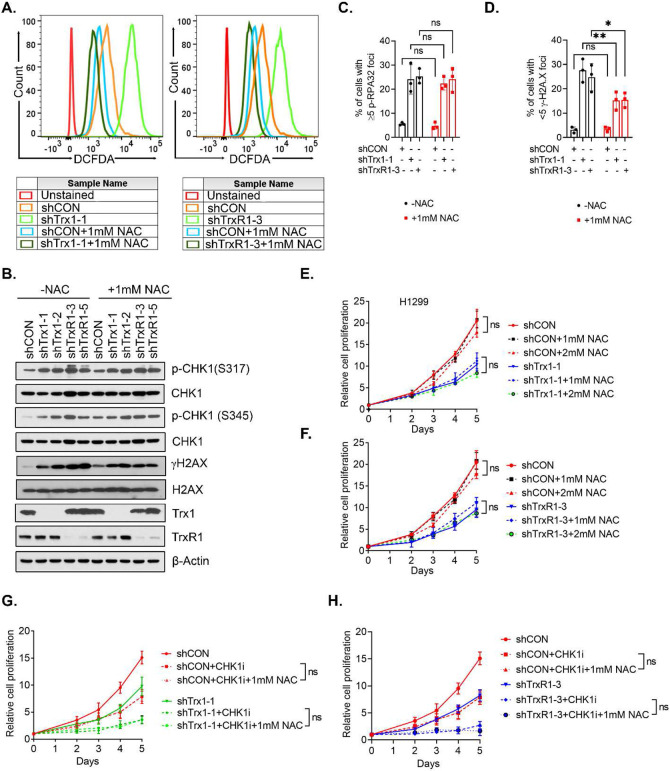
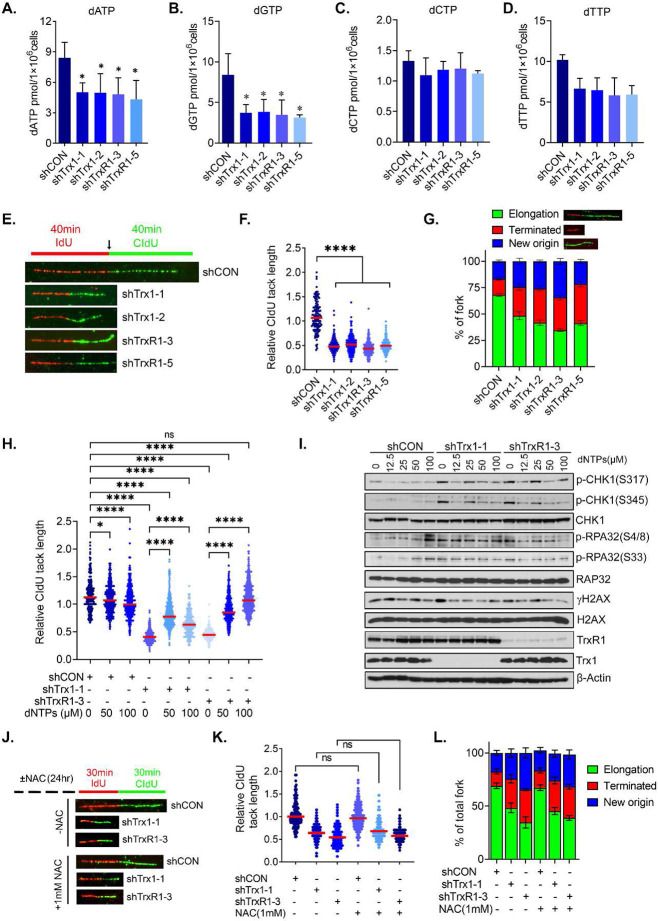
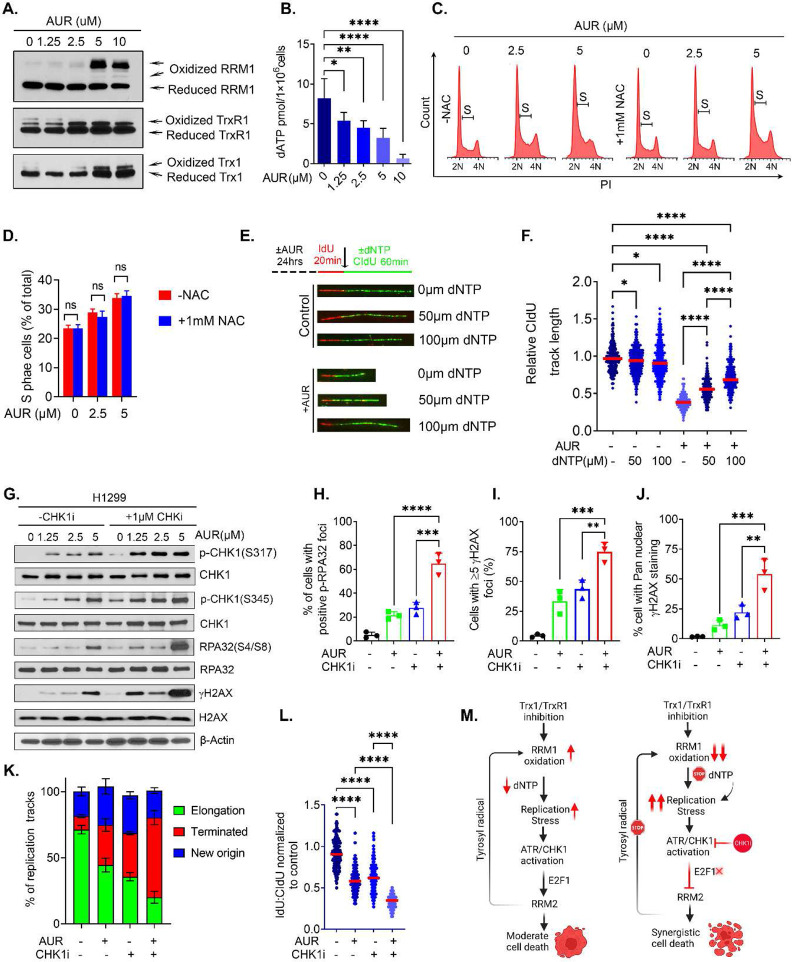
Checkpoint kinase 1 (CHK1) is critical for cell survival under replication stress (RS). CHK1 inhibitors (CHK1i's) in combination with chemotherapy have shown promising results in preclinical studies but minimal efficacy with substantial toxicity in clinical trials. To explore novel combinational strategies that can overcome these limitations, we performed an unbiased high-throughput screen in a non-small cell lung cancer (NSCLC) cell line and identified thioredoxin1 (Trx1), a major component of the mammalian antioxidant-system, as a novel determinant of CHK1i sensitivity. We established a role for redox recycling of RRM1, the larger subunit of ribonucleotide reductase (RNR), and a depletion of the deoxynucleotide pool in this Trx1-mediated CHK1i sensitivity. Further, the TrxR1 inhibitor auronafin, an anti-rheumatoid arthritis drug, shows a synergistic interaction with CHK1i via interruption of the deoxynucleotide pool. Together, these findings identify a new pharmacological combination to treat NSCLC that relies on a redox regulatory link between the Trx system and mammalian RNR activity.


Conflict of interest statement

Conflict of interest. Authors declare no competing interest.

Figures

Figure 1.
Figure 1.. Genome-wide Decode Pooled shRNA library screening identifies Trx1 as a determining factor of CHK1 inhibitor sensitivity.
A. Schematic diagram illustrating the screening workflow for genome-wide loss-of-function screening. gDNA was isolated from the reference and experimental populations of transduced H1299 cells. CHK1i, CHK1 inhibitor (LY2603618). B. A volcano plot showing the identified target genes from the screen in A. The colored dots are significant genes that have a fold change > 1.5 and any point not gray is significant P < 0.05. TRX1 is indicated as one of the top candidates (p=2.12E-05) from the screen. C. The analysis of TCGA data sets showing the transcript expression of Trx1 and TrxR1 NSCLC subsets (LUSC & LUAD) compared to normal tissue. D. Box plots of Trx1 and TrxR1 transcript expression from tissues at different stages of disease progression in patients with LUAD and LUSC patients (the number of patients from each group are indicated in parentheses along the x-axis labels) from data mined from the Oncomine database.
Figure 2.
Figure 2.. Trx1 or TrxR1 depletion and CHK1i show a synergistic interaction in vitro and in vivo.
A. Western blots of Trx1 and TrxR1 in H1299 and Calu-6 NSCLC cells after shRNA-mediated depletion. B. Cellular toxicity assays of the indicated cell lines with the indicated knockdowns to measure cell survival after treatment with CHK1i for 72 h. C, D. Proliferation assays of the indicated cells lines with the indicated knockdowns and after treatment with CHK1i for 24 h. E. A schematic diagram illustrating the scheme of the xenograft model and CHK1i administration. F. Representative photographs of the excised tumors from the indicated groups. G. The tumor weight from each indicated group at the endpoint of the experiment. H. Tumor growth curves in the indicated groups. I. Survival of the indicated groups as analyzed by Kaplan-Meier analysis. [Statistical information: All the experiment was repeated at least three times (n=3). All histograms depict mean value; error bars represent ± SD. The p- values were calculated using one way ANOVA for multiple comparison; ** p≤0.005; ***p≤0.0001; **** p <0.0001]
Figure 3.
Figure 3.. Trx1 or TrxR1 depletion in combination with CHK1i leads to profound RS, replication fork collapse and cell death.
A. Western blot analysis of markers of RS and a DNA damage marker in H1299 cells treated with 1 μM CHK1i for 1 hr. B, C. The nuclear intensities of γH2AX and p-RPA32(S33) following CHK1i treatment. D. Representative immunofluorescence images of γH2AX- and p-RPA32(S33)-positive foci. Cells were treated with 1μM CHK1i for 1hrs. Scale bar, 40 μm. E, F. Percent of cells with >= 5 foci of γH2AX (E) and p-RPA32(S33) (F) following CHK1i treatment as stated previously. G, H. Representative images from neutral comet assays to measure the degree of DNA double strand breaks in H1299 cells treated with 1 μM CHK1i for 2 hrs (G) and the quantitation of their tail lengths (H). I. Percentage of cells with Pan-γH2AX staining after CHK1i treatment. J, K. Representative immunofluorescent images of nuclear fragmentation (DAPI staining) and F-actin staining (Phalloidin) (J) after CHK1i treatment for 24 h and the quantitation of the percentage of cells with nuclear fragmentation (K). L, M. TUNEL staining (L) and its quantitation (M) of H1299 cells treated with CHK1i (1 μM) for 6 h. [Statistical information: n=3, All histograms depict mean value; error bars represent ± SD. The p-values were calculated using one way ANOVA for multiple comparison. Red line in dot plot indicates mean; ** p≤0.005; *** p≤0.0001; **** p <0.0001; ns; nonsignificant]
Figure 4.
Figure 4.. ROS is not responsible for Trx1 or TrxR1 depletion-induced RS.
A. Intracellular ROS levels in H1299 cells treated with 1 mM NAC as measured by DCFDA staining. B. Representative western blots of the indicated RS markers after NAC (1 mM) treatment in H1299 cells. C, D. Percent of H1299 cells with >= 5 foci of p-RAP32(S33) (C) γH2AX (D) after NAC treatment (1 mM). E, F. Relative cell proliferation of H1299 cells depleted for Trx1 (E) or TrxR1 (F) after NAC treatment (1 mM). G, H. Relative cell proliferation of H1299 cells after Trx1 depletion (G) or TrxR1 depletion (H) and CHK1i treatment and NAC treatment (1 mM). [Statistical information: n=3, All histograms depict mean value; error bars represent ± SD. The p-values were calculated using one way ANOVA for multiple comparison; *p ≤0.05; **p≤0.001; ns; nonsignificant]
Figure 5.
Figure 5.. Trx1 or TrxR1 depletion abrogates dNTP production and interrupts replication fork elongation.
A-D. Levels of dATP (A), dGTP (B), dCTP (C) and dTTP (D) after Trx1 or TrxR1 depletion in H1299 cells. E. Representative image of DNA fiber tracks in the indicated groups after 40 min pulses with IdU and CldU. F. Replication fork progression as measured by relative CldU track lengths (CldU to IdU ratio) of the groups in E. A CldU-to-IdU ratio closer to ~1 one indicates a normal speed of replication fork with a ratio <1 indicating a slower progression of the fork. 100-200 fibers (n=3) were counted per conditions/experiment and the ratio of each fiber is represented in dot plot. The median line is indicated in red. G. The percentage of replication fork progression, elongation termination and new origin firing in the indicated groups. H. Effects on replication fork progression after exogenous dNTP treatment in the indicated groups. I. Representative western blots of the indicated RS markers after addition of exogenous dNTPs to H1299 cells that have been depleted for Trx1 or TrxR1. J. Representative images of DNA fibers from the indicated cells treated with 1 mM NAC for 24 h. K. The effect of NAC treatment on replication fork progression in the indicated cells. L. The effect of NAC treatment on replication fork progression, elongation termination and new origin firing in the indicated groups. [Statistical information: n=3, All histograms depict mean value; error bars represent ± SD. The p-values were calculated using one way ANOVA for multiple comparison. Red line in dot plot indicates mean; *≤0.05; **** p <0.0001; ns; nonsignificant]
Figure 6.
Figure 6.. RRM1 oxidation is required for Trx1 knockdown-induced RS.
A. Representative redox western blots of oxidized and reduced RRM1 from H1299 cells under non-denaturing (−DTT) or denaturing (+DTT) conditions following iodoacetamide carboxyamidomethylation and dephosphorylation of the protein extract. B. Representative western blots of oxidized and reduced RRM1 from the indicated H1299 cells and after treatment with 1- or 2-mM NAC for 24 h. C. Representative western blots of oxidized and reduced RRM1 from Trx1-depleted H1299 cells transfected with Trx1-WT or Trx1 redox mutants. D. Representative western blots of RS markers in Trx1-depleted H1299 cells transfected with Trx1-WT or Trx1 redox mutants. E. The levels of dATP in the indicated group of cells. F. The percentage of cells in S phase among the indicated group of cells. G. The effect on replication fork progression in the indicated group of H1299 cells. H. Violin plots of relative γH2AX intensity among the indicated groups of cells. I. A schematic diagram illustrating the electron transfer flow between RRM2-RRM1 and RRM1 and the Trx system. J. Representative western blots of oxidized and reduced mutant RRM1 expression in non-reducing (-DTT) and reducing (+DTT) conditions. K. Representative western blots of oxidized and reduced mutant RRM1 in the indicated cells with or without Trx1 depletion. L. Representative western blots of the indicated proteins in Trx1-depleted cells expressing various redox mutants along with WT-RRM1. [Statistical information: n=3, All histograms depict mean value; error bars represent ± SD. The p-values were calculated using one way ANOVA for multiple comparison. Red line in dot plot and violine plots indicates mean; * ≤0.05; ** p≤0.005; **** p <0.0001; ns; nonsignificant]
Figure 7.
Figure 7.. Trx1 or TrxR1 depletion triggers the CHK1-E2F1-RRM2 pathway, which can be inhibited by CHK1i.
A. Representative western blots of the indicated proteins of the E2F1-RRM1 pathway after Trx1 or TrxR1 depletion. B. Representative western blots of E2F1 and RRM2 upon Trx1 or TrxR1 depletion and CHK1i treatment at the indicated doses. C. A schematic diagram illustrating the expected impact of CHK1i on Trx1 or TrxR1 depletion-mediated E2F1-RRM2 axis alterations and subsequent RRM1 activity. D. The levels of dATP in cells with Trx1 or TrxR1 depletion with or without CHK1i treatment. E, F. Effects on replication fork progression in cells with Trx1 or TrxR1 depletion with or without CHK1i treatment as visualized by track lengths (E) and their relative quantification (F). G, H. Representative western blots of oxidized and reduced RRM1 in Trx1-depleted cells with or without HU or CHK1i treatment (G) and their quantification below each set of western blots (H). I, J. Representative western blots of oxidized and reduced RRM1 in cells expressing various redox mutants of RRM1 treated with CHK1i or HU (I) and their quantification (J). [Statistical information: n=3, All histograms depict mean value; error bars represent ± SD. The p-values were calculated using one way ANOVA for multiple comparison. Red line in dot plot indicates mean; *≤0.05; ** p≤0.005; *** p ≤0.001; **** p <0.0001; ns; nonsignificant]
Figure 8.
Figure 8.. AUR and CHK1i have a synergistic interaction with regard to their antitumor activity and RS.
A. Relative survival of different NSCLC cell lines treated with AUR or AUR + CHK1i. B. Relative cell growth of H1299 cells treated with the indicated doses of CHK1i, AUR or AUR + CHK1i for 24 h. C-G. A dose-response matrix generated via SynergyFinder 2.0 at different concentration of AUR and CHK1i (C). Different synergy scores, such as ZIP (D), Loewe (E), Bliss (F) and HAS (G) indicate the true synergy between CHK1i and AUR. A synergy score ≤ 10 is considered to be synergistic. H, I. The percent inhibition of cell growth to measure the potency shift between AUR and CHK1i. Synergistic potency shift was induced 34752.01 times by AUR towards CHK1i. CHKi induced 7.25 times synergistic potency shift towards AUR; There was 0.15 times negative cooperativity between AUR and CHKi. J-N. Representative tumors (J), the average weight of the excised tumors at the endpoint of treatment (K), the body weights over the course of treatment (L), the growth of the tumors in the indicated groups (M) and the survival rates by Kaplan-Meier analysis (N) of a mouse xenograft H1299 model of NSCLC treated with CHK1i (25 mg/Kg) and AUR (10 mg/Kg). [Statistical information: n=3, All histograms depict mean value; error bars represent ± SD. The p-values were calculated using one way ANOVA for multiple comparison; *p≤0.05; ** p≤0.005; *** p ≤0.001]
Figure 9.
Figure 9.. AUR treatment increases RRM1 oxidation and impairs replication fork elongation due to depletion of the dNTP pool.
A. Representative western blots of oxidized and reduced RRM1 in H1299 cells treated with AUR. B. Levels of dATP in the AUR-treated cells. C, D. Effects of NAC on the accumulation of S phase cells caused by AUR treatment (C) and its quantification (D). E, F. Effects of AUR treatment on replication fork progression with or without dNTP supplementation as visualized by DNA fiber tracks (E) and their relative quantification (F). G. Representative western blots of RS markers in cells treated with AUR and an CHK1i. H-J. Percent of cells with p-RPA32(S33)-positive foci (H), those with >= 5 foci of γH2AX (I) and with pan-γH2AX nuclear staining (J) in those treated with AUR, a CHK1i or both. K. The effect of combined AUR and CHK1 inhibition or monotherapy on the replication fork progression, elongation termination and new origin firing. L. The effects of AUR and CHK1 inhibition or monotherapy on replication fork progression. The dot plots show the relative CldU track length. M. A schematic diagram illustrating our working model of how Trx1 or TrxR1 depletion or inhibition synergistically interacts with CHK1i to promote extensive anti-tumor effects than either therapy alone. [Statistical information: n=3, All histograms depict mean value; error bars represent ± SD. The p-values were calculated using one way ANOVA for multiple comparison. Red line in dot plot indicates mean; *p≤0.05; ** p≤0.005; *** p ≤0.001; **** p ≤0.0001; ns: nonsignificant]

References

    1. Lecona E. & Fernandez-Capetillo O. Targeting ATR in cancer. Nat Rev Cancer 18, 586–595, doi:10.1038/s41568-018-0034-3 (2018). - DOI - PubMed
    1. Qiu Z., Oleinick N. L. & Zhang J. ATR/CHK1 inhibitors and cancer therapy. Radiotherapy and oncology : journal of the European Society for Therapeutic Radiology and Oncology 126, 450–464, doi:10.1016/j.radonc.2017.09.043 (2018). - DOI - PMC - PubMed
    1. Dent P. Investigational CHK1 inhibitors in early phase clinical trials for the treatment of cancer. Expert Opin Investig Drugs 28, 1095–1100, doi:10.1080/13543784.2019.1694661 (2019). - DOI - PubMed
    1. Toledo L. I., Murga M. & Fernandez-Capetillo O. Targeting ATR and Chk1 kinases for cancer treatment: a new model for new (and old) drugs. Molecular oncology 5, 368–373, doi:10.1016/j.molonc.2011.07.002 (2011). - DOI - PMC - PubMed
    1. Wehler T. et al. A randomized, phase 2 evaluation of the CHK1 inhibitor, LY2603618, administered in combination with pemetrexed and cisplatin in patients with advanced nonsquamous non-small cell lung cancer. Lung Cancer 108, 212–216, doi:10.1016/j.lungcan.2017.03.001 (2017). - DOI - PubMed

Publication types