. 2023 Jul 14;83(14):2297-2311.
doi: 10.1158/0008-5472.CAN-22-3464.

Unique Transcriptional Profiles Underlie Osteosarcomagenesis Driven by Different p53 Mutants

Affiliations

Unique Transcriptional Profiles Underlie Osteosarcomagenesis Driven by Different p53 Mutants

Dhruv Chachad et al. Cancer Res. .

Abstract

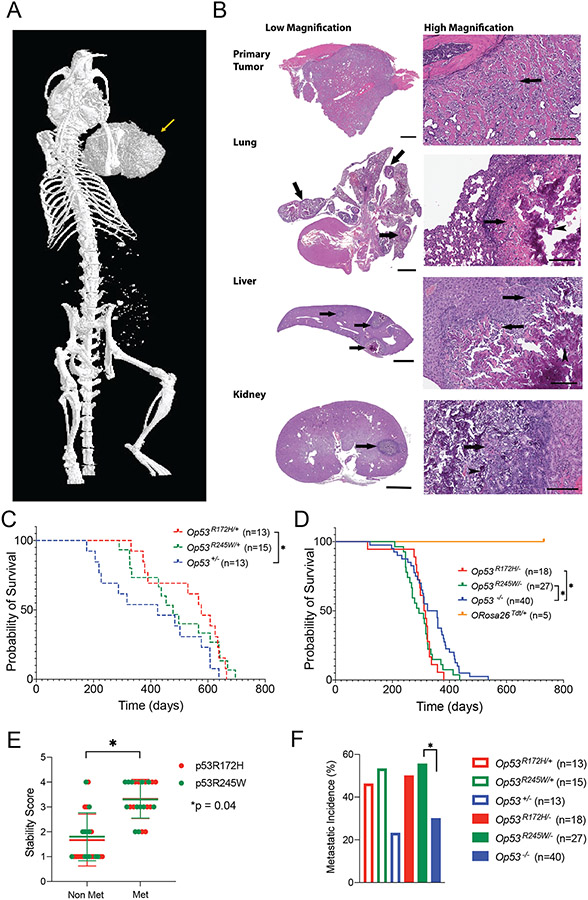
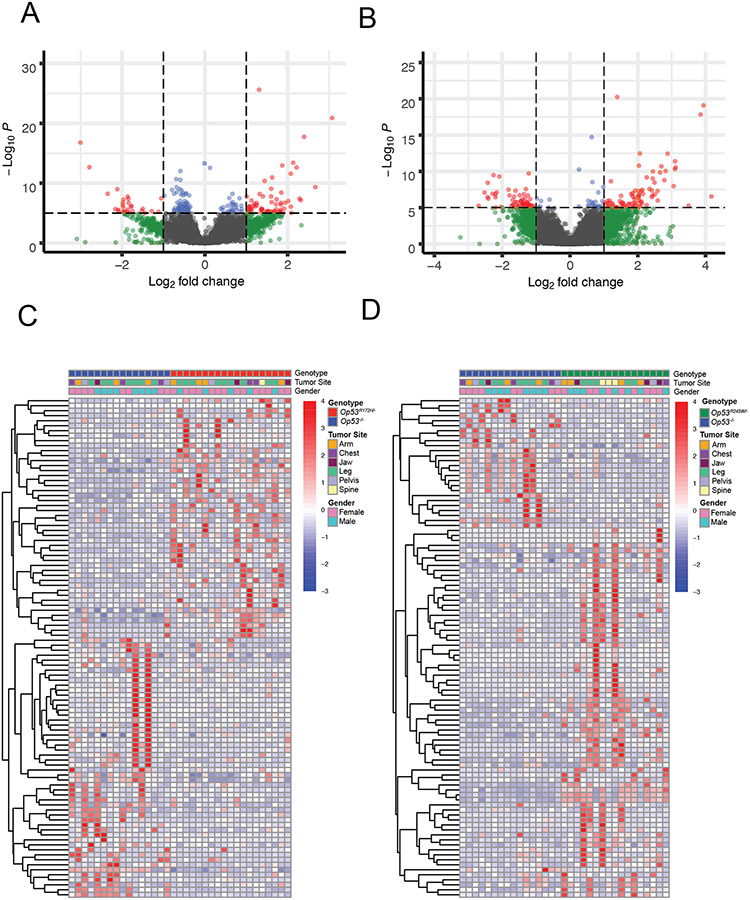
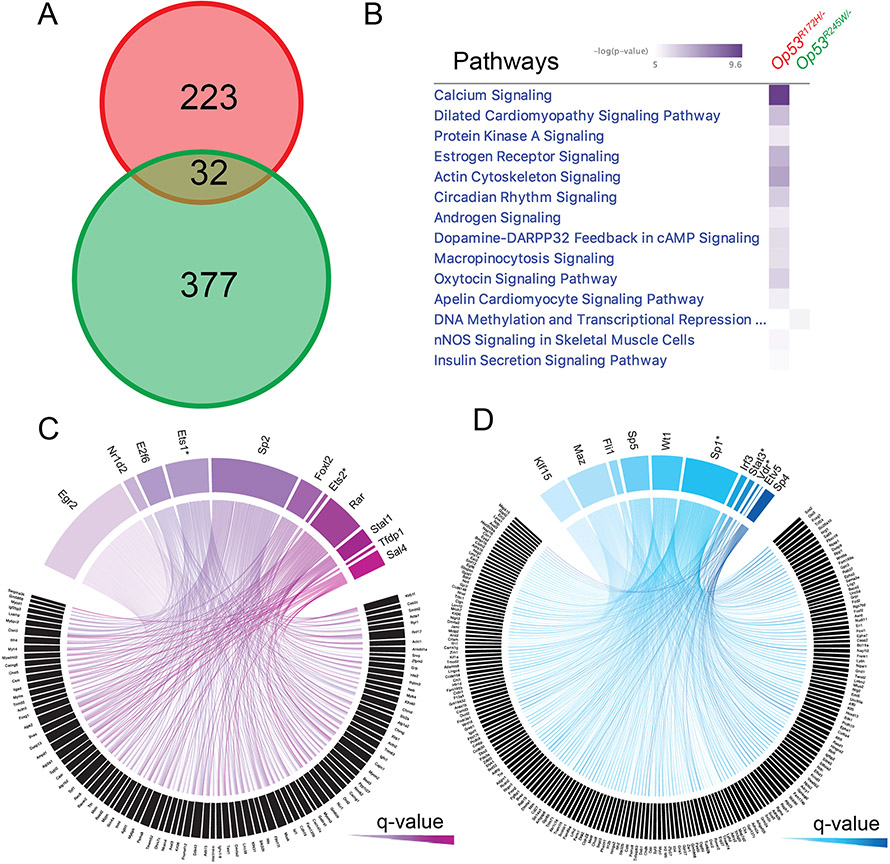
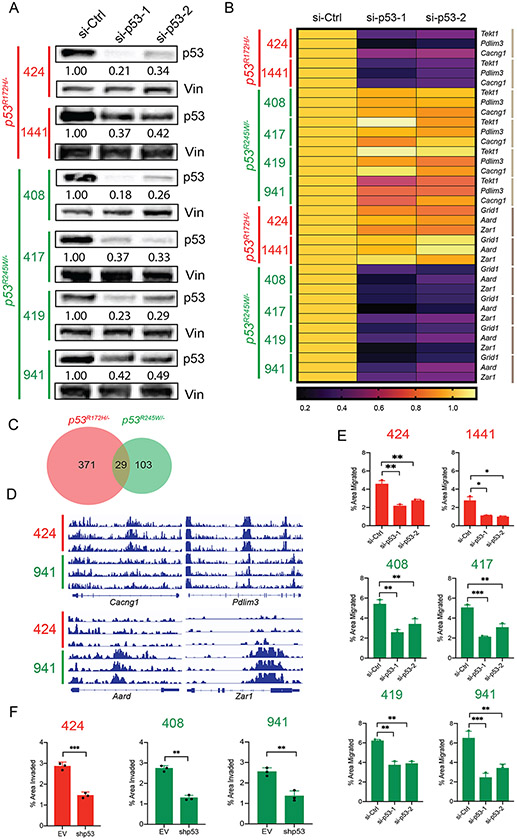
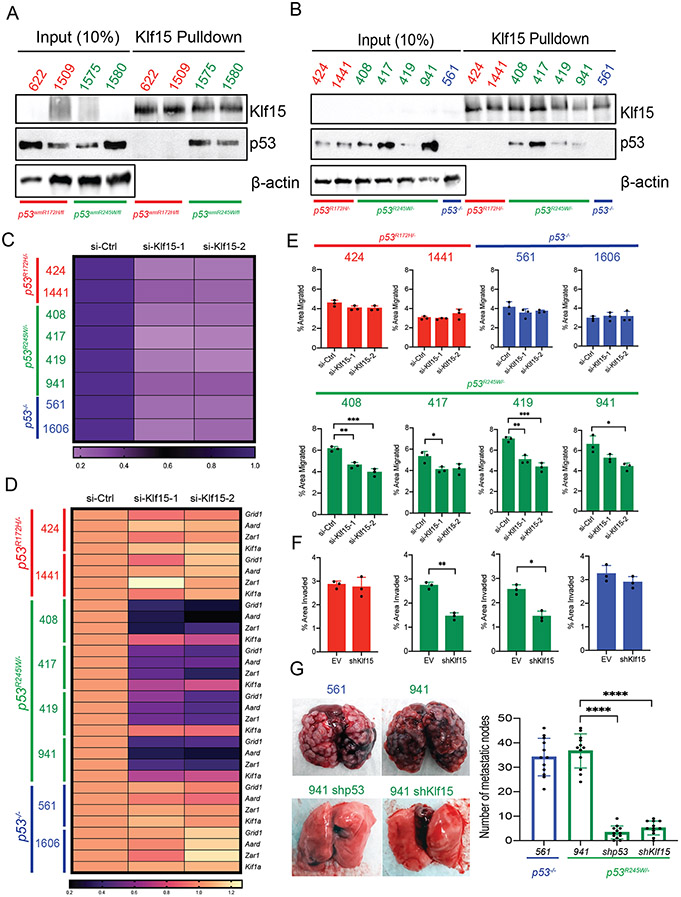
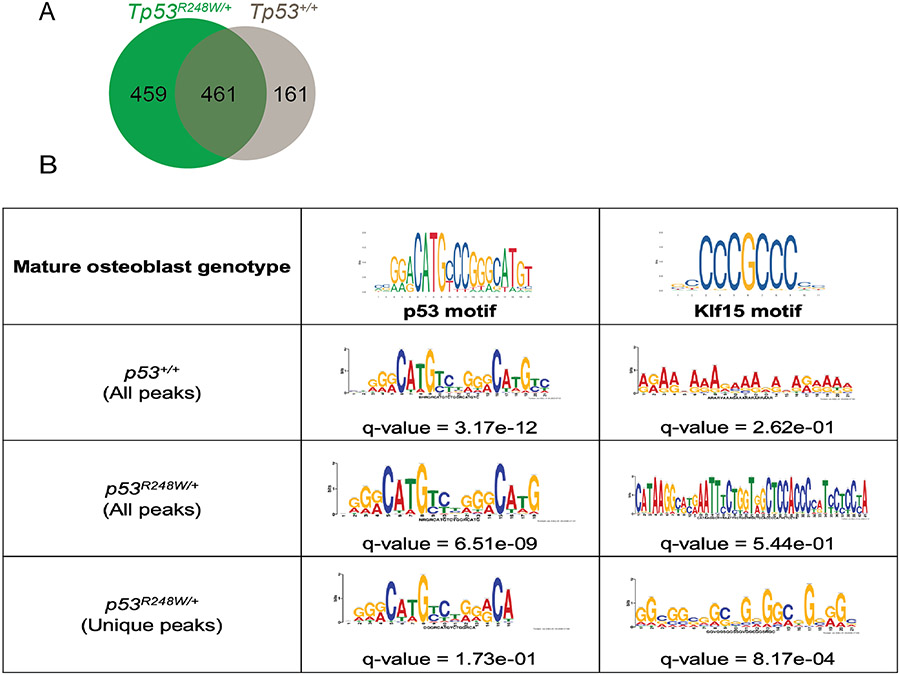
Missense mutations in the DNA binding domain of p53 are characterized as structural or contact mutations based on their effect on the conformation of the protein. These mutations show gain-of-function (GOF) activities, such as promoting increased metastatic incidence compared with p53 loss, often mediated by the interaction of mutant p53 with a set of transcription factors. These interactions are largely context specific. To understand the mechanisms by which p53 DNA binding domain mutations drive osteosarcoma progression, we created mouse models, in which either the p53 structural mutant p53R172H or the contact mutant p53R245W are expressed specifically in osteoblasts, yielding osteosarcoma tumor development. Survival significantly decreased and metastatic incidence increased in mice expressing p53 mutants compared with p53-null mice, suggesting GOF. RNA sequencing of primary osteosarcomas revealed vastly different gene expression profiles between tumors expressing the missense mutants and p53-null tumors. Further, p53R172H and p53R245W each regulated unique transcriptomes and pathways through interactions with a distinct repertoire of transcription factors. Validation assays showed that p53R245W, but not p53R172H, interacts with KLF15 to drive migration and invasion in osteosarcoma cell lines and promotes metastasis in allogeneic transplantation models. In addition, analyses of p53R248W chromatin immunoprecipitation peaks showed enrichment of KLF15 motifs in human osteoblasts. Taken together, these data identify unique mechanisms of action of the structural and contact mutants of p53.

Significance: The p53 DNA binding domain contact mutant p53R245W, but not the structural mutant p53R172H, interacts with KLF15 to drive metastasis in somatic osteosarcoma, providing a potential vulnerability in tumors expressing p53R245W mutation.


Figures

Figure 1:
Figure 1:
Osteosarcomas with different p53 missense mutations metastasize with high frequency. A: Osteosarcoma with p53R245W/+ mutation, in the long bone of the left arm (arrow) as observed using micro-CT imaging of whole mouse. B: Representative photomicrographs (10-20X for low magnification, 200X for high magnification) of an Op53R245W/+ mouse that developed osteosarcoma. Discrete tumor nodules (arrows) compress and invade non-mineralized native structures in lung, liver, and kidney (low magnification). Under high magnification, neoplastic cells show expansile growth pattern with centrally located mineralized, basophilic osteoid regions (arrowheads), surrounded by non-mineralized eosinophilic osteoid regions (arrows); scale bars: low magnification primary tumor, 900 microns; lung, liver, and kidney, 2000 microns; high magnification, 200 microns. C and D: Survival curves for different genotypes that yield osteosarcomas. E: Stability scores based on immunohistochemistry analysis for primary osteosarcomas expressing either p53R172H (N = 24) or p53R245W (N = 24) mutations. F: Metastatic incidence observed in mice with different genotypes. *p < 0.05.
Figure 2:
Figure 2:
Transcriptomic analyses of primary murine osteosarcomas show that transcriptomes of those expressing p53 missense mutations differ significantly from those that do not express p53. A and B: Volcano plots showing distribution of gene expression differences in Op53R172H/− and Op53R245W/− osteosarcomas, respectively. C and D: Heatmaps showing differential expression of top 100 genes ranked by absolute LFC in Op53R172H/− v. Op53−/− and Op53R245W/− v. Op53−/− osteosarcomas, respectively.
Figure 3:
Figure 3:
Transcriptomes regulated by p53R172H and p53R245W mutants are different. A: Venn diagram showing minimal intersection of the differentially expressed genes in Op53R172H/− (red) and Op53R245W/− (green) osteosarcomas, p = 1.00E+00. B: Dysregulated pathways in Op53R245W/− compared to Op53R172H/−, based on differing -log(P-value). C and D: Circos plots depicting the differentially upregulated genes in Op53R172H/− and Op53R245W/− osteosarcomas, and the list of transcription factors, arranged by significance, binding to enriched motifs in a 10kb region upstream of the transcription start sites of differentially upregulated genes.
Figure 4:
Figure 4:
Knockdown of mutant p53 in murine osteosarcoma cell lines results in reduction of migration potential. A: Immunoblots of p53 protein levels after treatment with two independent siRNAs against p53 in murine osteosarcoma cell lines expressing either p53R172H (424, 1441 – in red) or p53R245W (408, 417, 419, 941 – in green). B: qRT-PCR analysis of gene targets of p53R172H, Tekt1, Pdlim3, Cacng1 (denoted by light brown lines on right), and gene targets of p53R245W Grid1, Aard, Zar1 (denoted by dark brown lines on right) upon knockdown of respective p53 mutants; Gapdh served as control. C: Overlap between the number of genes in the open chromatin regions for cells expressing p53R172H (red) and p53R245W (green). D: Loci depicting the peaks corresponding to open chromatin regions for gene targets of p53R172H, Cacng1, and Pdlim3 (top panel), and for gene targets of p53R245W, Aard, and Zar1 (bottom panel) E: Murine osteosarcoma cell lines expressing p53R172H (red) or p53R245W (green) and their migration potential upon knockdown of p53. F: Murine osteosarcoma cell lines expressing p53R172H (red) or p53R245W (green) and their invasion potential upon knockdown of p53. Significance calculated by student’s t-test from at least 3 biological replicates; *p < 0.05, **p < 0.01, ***p < 0.005.
Figure 5:
Figure 5:
KLF15 selectively binds to p53R245W but not p53R172H to execute mutant p53 gain of function. A: Co-immunoprecipitation assays in primary murine osteosarcomas expressing stable p53R172H (622, 1509 – in red) or p53R245W (1575, 1580 – in green) mutants. Pulldown with KLF15 antibody (top) and probe with p53 antibody (middle); β-actin served as loading control (bottom). B: Co-immunoprecipitation assay in murine osteosarcoma cell lines with stable p53R172H (424, 1441 – in red) or p53R245W (408, 417, 419, 941 – in green) mutants or p53-null cell line (561 – in blue). Pulldown with KLF15 antibody (top) and probed with p53 antibody (middle); β-actin served as loading control (bottom). C: Expression of Klf15 upon treatment with two independent siRNAs against Klf15 as quantified by qRT-PCR in murine OS cell lines expressing p53R172H (in red), p53R245W (in green) mutants or no p53 (561, 1606 – in blue); Gapdh used as control. D: Gene expression analysis by qRT-PCR in murine osteosarcoma cell lines for transcriptional targets of KLF15 and p53R245W – Grid1, Aard, Zar1. Kif1a is a gene target of p53R245W but is not a transcriptional target of KLF15 and was used as a negative control; Gapdh served as control. E: Effects of Klf15 knockdown on migration potential of murine osteosarcoma cell lines. F: Effects of Klf15 knockdown on invasion potential on murine osteosarcoma cell lines expressing p53R172H (red), p53R245W (green) or null for p53 (blue). G: Mouse lungs with metastatic nodes after tail-vein injections of p53-null cells (blue) or cells expressing p53R245W (green), with a stable knockdown of p53R245W, or stable knockdown of Klf15 (green) quantified on the right. Significance calculated by student’s t-test from experiments using at least 3 biological replicates; *p < 0.05, **p < 0.01, ***p < 0.005, ****p < 0.001.
Figure 6:
Figure 6:
ChIP seq for Tp53 shows mutant p53R248W occupancy at peaks enriched for KLF15 motifs. A: Genes associated to ChIP peaks for mature human osteoblast cells expressing p53R248W (green) or wild-type p53. B: Enriched motifs and associated q-values within the ChIP peaks for osteoblasts.

References

    1. Kim MP and Lozano G, Mutant p53 partners in crime. Cell Death & Differentiation, 2018. 25(1): p. 161–168. - PMC - PubMed
    1. Oren M and Rotter V, Mutant p53 gain-of-function in cancer. Cold Spring Harb Perspect Biol, 2010. 2(2): p. a001107. - PMC - PubMed
    1. Olivier M, Hollstein M, and Hainaut P, TP53 mutations in human cancers: origins, consequences, and clinical use. Cold Spring Harb Perspect Biol, 2010. 2(1): p. a001008. - PMC - PubMed
    1. Cho Y, Gorina S, Jeffrey PD, and Pavletich NP, Crystal structure of a p53 tumor suppressor-DNA complex: understanding tumorigenic mutations. Science, 1994. 265(5170): p. 346. - PubMed
    1. Joerger AC, Allen MD, and Fersht AR, Crystal structure of a superstable mutant of human p53 core domain. Insights into the mechanism of rescuing oncogenic mutations. J Biol Chem, 2004. 279(2): p. 1291–6. - PubMed

Publication types