. 2023 May 19;8(83):eade5872.
doi: 10.1126/sciimmunol.ade5872. Epub 2023 May 19.

Cytolytic CD8+ T cells infiltrate germinal centers to limit ongoing HIV replication in spontaneous controller lymph nodes

Affiliations

Cytolytic CD8+ T cells infiltrate germinal centers to limit ongoing HIV replication in spontaneous controller lymph nodes

David R Collins et al. Sci Immunol. .

Abstract

Follicular CD8+ T cells (fCD8) mediate surveillance in lymph node (LN) germinal centers against lymphotropic infections and cancers, but the precise mechanisms by which these cells mediate immune control remain incompletely resolved. To address this, we investigated functionality, clonotypic compartmentalization, spatial localization, phenotypic characteristics, and transcriptional profiles of LN-resident virus-specific CD8+ T cells in persons who control HIV without medications. Antigen-induced proliferative and cytolytic potential consistently distinguished spontaneous controllers from noncontrollers. T cell receptor analysis revealed complete clonotypic overlap between peripheral and LN-resident HIV-specific CD8+ T cells. Transcriptional analysis of LN CD8+ T cells revealed gene signatures of inflammatory chemotaxis and antigen-induced effector function. In HIV controllers, the cytotoxic effectors perforin and granzyme B were elevated among virus-specific CXCR5+ fCD8s proximate to foci of HIV RNA within germinal centers. These results provide evidence consistent with cytolytic control of lymphotropic infection supported by inflammatory recruitment, antigen-specific proliferation, and cytotoxicity of fCD8s.


Conflict of interest statement

COMPETING INTERESTS

The authors declare that they have no competing interests.

Figures

Fig. 1.
Fig. 1.. HIV-specific CD8+ T cells isolated from spontaneous controller LNs proliferate and develop cytolytic function upon antigenic stimulation.
(A) Representative proliferation as measured by CFSE dilution in CD8+ T cells from EC PB or LN upon 6-day stimulation with HLA-optimal HIV peptide followed by staining with cognate pHLA tetramer. (B) Summary of PB and LN HIV-specific CD8+ T cell proliferation (n = 11). Each data point represents the average of triplicate values. Wilcoxon matched-pairs signed rank test was used to calculate p value. (C) Representative HIV antigen-specific degranulation as measured by surface CD107A upregulation relative to unstimulated controls (gray histograms, left panels) and co-expression of intracellular perforin and granzyme B upon 4-hour stimulation of CD8+ T cells from EC PB and LN with cognate pHLA tetramer before (d0, middle panels) and after (d6, right panels) peptide expansion, gated on pHLA tetramer+ CD107A+ cells. (D-E) Summary of cytotoxicity as measured in C among PB (D) and LN (E) HIV-specific pHLA tetramer+ CD8+ T cells before (d0) and after (d6) peptide-specific proliferation (n = 9). Wilcoxon matched-pairs signed rank tests were used to calculate p values. (F) Summary of combined ability of HIV-specific CD8+ T cells to proliferate and acquire cytotoxicity as measured by the product of proliferation (as measured in A-B) and d6 cytotoxicity (as measured in C-E) among controllers (n = 5, circles) and ART-suppressed noncontrollers (n = 4, squares). Lines represent medians. Paired (PB vs LN) and unpaired (controllers vs ART) t tests were used to calculate p values. Gray boxes contain symbol keys: circles represent controller, squares ART; open or closed circles denote controllers with undetectable or detectable plasma HIV RNA, respectively.
Fig. 2.
Fig. 2.. HIV-specific CD8+ T cells in PB and LN share clonotypic composition.
(A) Schematic overview of fluorescence-activated cell sorting (FACS) isolation of triplicate populations of 500–2,500 HIV pHLA tetramer+ CD8+ T cells from matched PB and LN specimens, followed by RNA isolation and next-generation sequencing (NGS). (B) Summary metrics for T cell receptor (TCR) beta gene (TRBC) CDR3 read depth per sample. (C) TCR diversity as measured by inverse Simpson diversity index in matched PB and LN from 8 individuals. Gray box contains symbol key: circles represent controllers (n = 7) and square ART (n = 1); open or closed circles denote controllers with undetectable or detectable plasma HIV RNA, respectively. Paired t-test was used to calculate p value. (D) Clonotypic composition of HIV-specific pHLA tetramer+ CD8+ T cells as measured by TRBC CDR3 sequences among triplicate matched PB and LN samples from 8 individuals as in C. MHSI, Morisita-Horn Similarity Index.
Fig. 3.
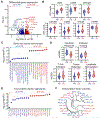
Fig. 3.. Transcriptional profiling of HIV-specific CD8+ T cells reveals chemotactic and effector signatures in LN.
(A) Volcano plot summarizing differential gene expression between PB and LN HIV-specific CD8+ T cells isolated from 8 participants as in Fig. 2A. Dashed line represents significance cutoff (q = 0.05). (B) Violin plots of VST-normalized counts for select differentially expressed genes in PB and LN. Each data point represents one replicate sample, circles represent controllers (n = 7) and square ART (n = 1); open or closed circles denote controllers with undetectable or detectable plasma HIV RNA, respectively. Paired t-tests were used to calculate p values. (C) Summary of top ten most significantly differentially expressed gene set subnets enriched in LN and in PB. (D) Single-sample gene set enrichment analyses (ssGSEA) for genes associated with interferon responses, chemotactic CD8+ LN follicular homing, virus-specific CD8+ T cell activation, CD8+ T cell lymphoid tissue retention and lymphoid-emigrant CD8+ T cell tissue recirculation. Each data point represents one sample, circles represent controllers (n = 7) and square ART (n = 1); open or closed circles denote controllers with undetectable or detectable plasma HIV RNA, respectively. Paired t-tests were used to calculate p values. (E) Summary of inferred transcription factor activity significantly enriched in LN and in PB. (F) Hierarchical dendrogram summarizing relationships between inferred transcriptional regulators significantly enriched in LN (red) and PB (blue).
Fig. 4.
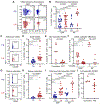
Fig. 4.. Cytolytic HIV-specific effector-memory CD8+ T cells are elevated in LN during HIV control.
(A) Representative ex vivo intracellular perforin and granzyme B expression in total and pHLA tetramer+ CD8+ T cells from PB and LN of a controller. (B) Summary of ex vivo perforin and granzyme B expression among total and HIV-specific pHLA tetramer+ (tet+) CD8+ T cells in PB and LN in HIV+ individuals (n = 12). Lines represent medians. Wilcoxon matched-pairs signed rank tests were used to calculate p values. (C) Summary of perforin and granzyme B expression among total LN CD8+ T cells among HIV controllers (n = 7, circles), ART-suppressed noncontrollers (n = 10, squares) and HIV-negative individuals (n = 6; crosses). Lines represent medians. Unpaired t tests were used to calculate p values. (D) Representative surface CD45RA and CD62L memory subset marker expression on total or pHLA tetramer+ CD8+ T cells from PB and LN. (E) Summary of memory subset composition among total (n = 22) and HIV-specific pHLA tetramer+ (n = 8) CD8+ T cells in PB and LN. Stacked bars represent mean, error bars represent 95% confidence intervals. (F) Frequencies of dual perforin and granzyme B expression among CD8+ T cell memory subsets in LN (n = 22). Lines represent medians. Wilcoxon matched-pairs signed rank tests were used to calculate p values. Gray boxes contain symbol keys: circles represent controllers, squares ART and crosses HIV-; open or closed circles denote controllers with undetectable or detectable plasma HIV RNA, respectively.
Fig. 5.
Fig. 5.. Cytolytic fCD8s are retained in spontaneous controller LNs.
(A) Representative surface CCR5 and CXCR3 staining and gating on total and HIV-specific pHLA tetramer+ CCR5+ CD8+ T cells in PB and LN. (B) Summary of CCR5 expression among total (n = 21) and HIV-specific pHLA tetramer+ (n = 9) CD8+ T cells in PB and LN. Lines represent medians. Paired t-tests were used to calculate p values. (C) Representative surface CXCR5 and PD-1 staining and gating on CXCR5+ CD8+ T cells in PB and LN. (D) Summary of CXCR5 expression among CD8+ T cells from paired PB and LN (n = 22). Lines represent medians. Wilcoxon matched-pairs signed rank test was used to calculate p value. (E) Summary of CXCR5 expression among HIV-specific pHLA tetramer+ CD8+ T cells in spontaneous controllers (n = 5) and ART-suppressed non-controllers (n = 5). Lines represent medians. Unpaired t test was used to calculate p value. (F) Summary of perforin and granzyme B co-expression among CXCR5+ and CXCR5− subsets of total (n = 15) and HIV-specific pHLA tetramer+ (n = 5) LN CD8+ T cells. Lines represent medians. Paired t tests were used to calculate p values.(G) Representative surface CD69 and CD103 staining and gating on CD69+ CD8+ T cells in PB and LN. (H) Summary of CD69 and CD103 co-expression among CD8+ T cells from paired PB and LN (n = 22). Lines represent medians. Wilcoxon matched-pairs signed rank test was used to calculate p value. (I) Summary of CD69 expression among total (n = 22) and HIV-specific pHLA tetramer+ (n = 10) CD8+ T cells in PB and LN. Lines represent medians. Wilcoxon matched-pairs signed rank tests were used to calculate p values. (J) Summary of CD69 expression among LN HIV-specific pHLA tetramer+ CD8+ T cells in spontaneous controllers (n = 4) and ART-suppressed non-controllers (n = 6). Lines represent medians. Unpaired t test was used to calculate p value. Gray boxes contain symbol keys: circles represent controllers, squares ART and crosses HIV-; open or closed circles denote controllers with undetectable or detectable plasma HIV RNA, respectively.
Fig. 6.
Fig. 6.. Cytolytic CD8+ T cells are present in controller LNs during HIV replication.
(A) Representative immunofluorescence (IF) and RNAscope micrographs of spontaneous controller LN stained for HIV gagpol RNA (white), CD8 (red), perforin (yellow) and granzyme B (blue). Cellular interactions within follicular GCs are highlighted by enlarged insets. (B) Spearman correlation between density of perforin/granzyme B co-expressing CD8+ cells and density of cells expressing HIV gagpol RNA across entire LN tissue cross-sections. Each data point represents one HIV controller (n = 11) ; open or closed circles denote controllers with undetectable or detectable plasma HIV RNA, respectively. (C) Follicular GC regions of interest (ROI) demarcated by orange lines based upon morphology, relative CD8 exclusion (red), and IgD staining (green) of adjacent sections. (D) Spearman correlation between frequencies of perforin/granzyme B co-expressing CD8+ cells and of HIV gagpol RNA expressing cells within follicular GCs. Each data point represents one follicular GC (n = 52) from 6 total HIV controller LNs; open or closed circles denote GCs from controllers with undetectable or detectable plasma HIV RNA, respectively.
Fig. 7.
Fig. 7.. fCD8s express cytolytic effector molecules proximal to HIV-infected cells in GCs.
(A) Representative IF and RNAscope micrographs depicting automated nuclear segmentation to identify cell boundaries within follicular GC ROI based on DAPI nuclear staining (orange masks, left). Identification of HIV gagpol RNA+ (green masks), CD8+ perforin− (gray masks, center) or CD8+ perforin+ granzyme B+ (cyan masks, right) cells within follicular GC ROI demarcated based on staining as in fig. 6C. (B) fCD8s co-expressing perforin and granzyme B within the indicated distance ranges (as average cell diameters corresponding to 8.3 μm increments) from the nearest HIV gagpol RNA+ cell, expressed as number of cells (right axis, cyan) and percent of total fCD8s within each distance range (left axis, red, Spearman correlation) among 57,606 fCD8s within 52 GCs from 6 controller LNs as in fig. 6D. (C) Percent of noncytolytic (perforin–, gray) and cytolytic (perforin+ granzyme B+, cyan) fCD8s observed significantly (p < 0.05) closer to nearest HIV gagpol RNA+ cell than computationally simulated random effector cell positions. X2 test with Yates’ correction (X2 = 1931.4, df = 1, n = 57,606) was used to calculate p value for between-group comparison.

References

    1. von Andrian UH, Mempel TR, Homing and cellular traffic in lymph nodes. Nat Rev Immunol 3, 867–878 (2003). - PubMed
    1. Allen CD, Okada T, Cyster JG, Germinal-center organization and cellular dynamics. Immunity 27, 190–202 (2007). - PMC - PubMed
    1. Bajenoff M, Egen JG, Koo LY, Laugier JP, Brau F, Glaichenhaus N, Germain RN, Stromal cell networks regulate lymphocyte entry, migration, and territoriality in lymph nodes. Immunity 25, 989–1001 (2006). - PMC - PubMed
    1. Matloubian M, Lo CG, Cinamon G, Lesneski MJ, Xu Y, Brinkmann V, Allende ML, Proia RL, Cyster JG, Lymphocyte egress from thymus and peripheral lymphoid organs is dependent on S1P receptor 1. Nature 427, 355–360 (2004). - PubMed
    1. Shiow LR, Rosen DB, Brdickova N, Xu Y, An J, Lanier LL, Cyster JG, Matloubian M, CD69 acts downstream of interferon-alpha/beta to inhibit S1P1 and lymphocyte egress from lymphoid organs. Nature 440, 540–544 (2006). - PubMed

Publication types