. 2023 Apr 25;14(5):2276-2292.
doi: 10.1364/BOE.480286. eCollection 2023 May 1.

Dynamics of single cell femtosecond laser printing

Affiliations

Dynamics of single cell femtosecond laser printing

Jun Zhang et al. Biomed Opt Express. .

Abstract

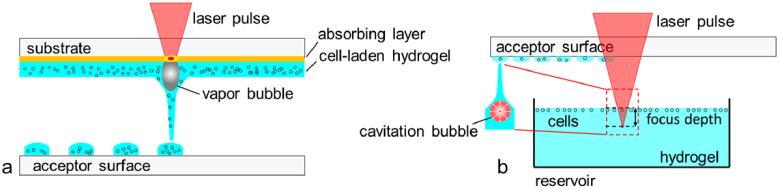
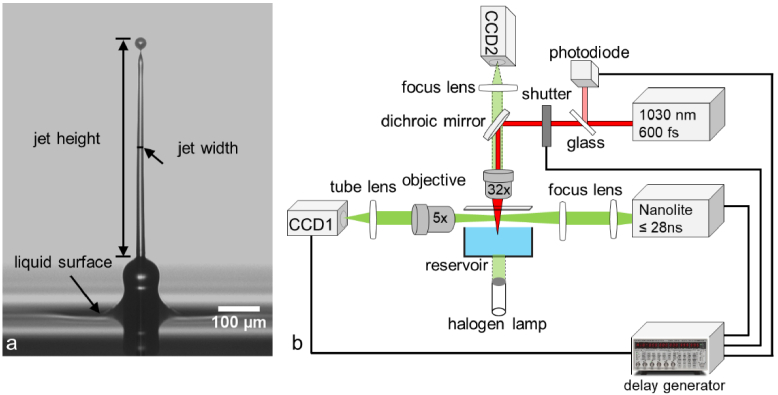
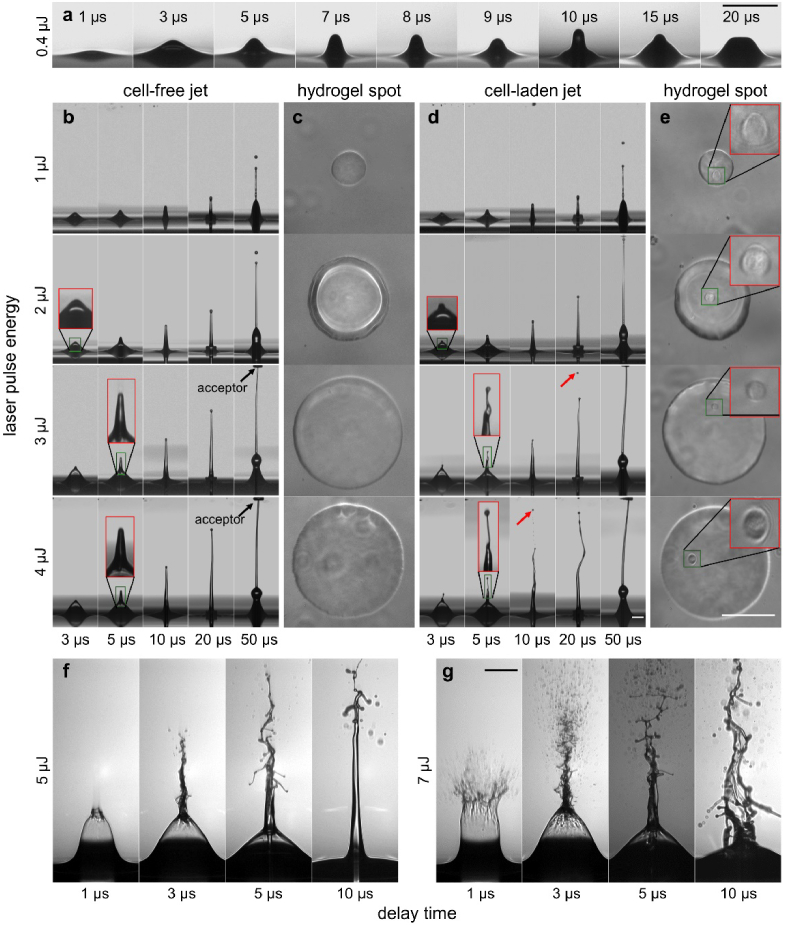
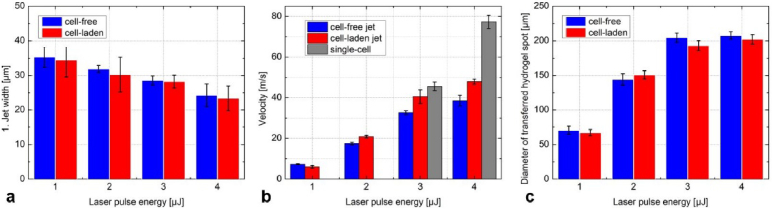
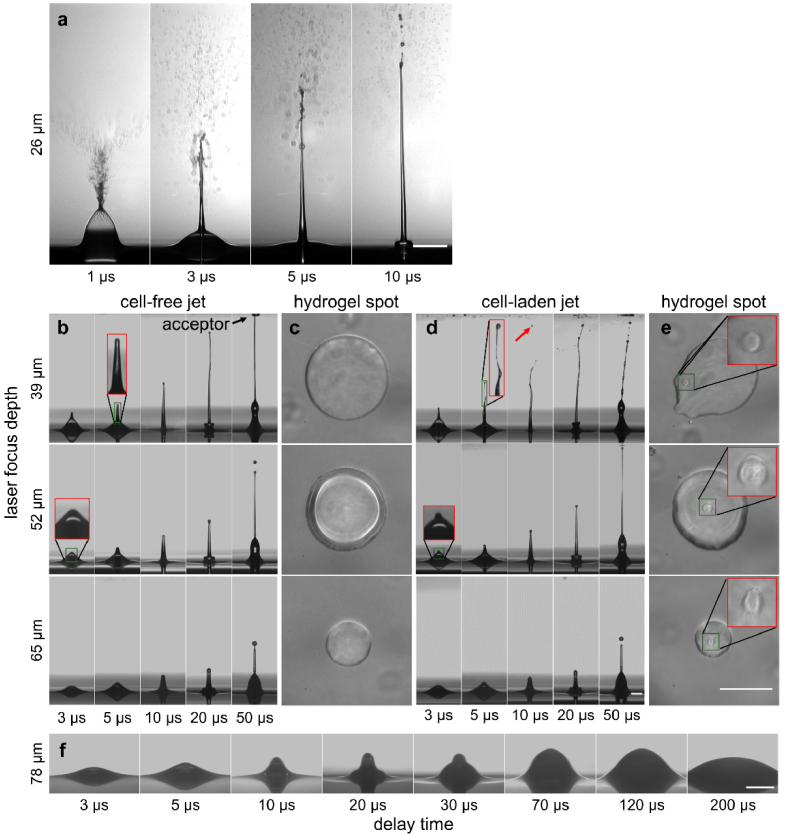
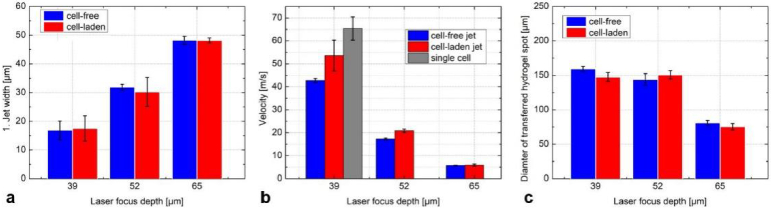
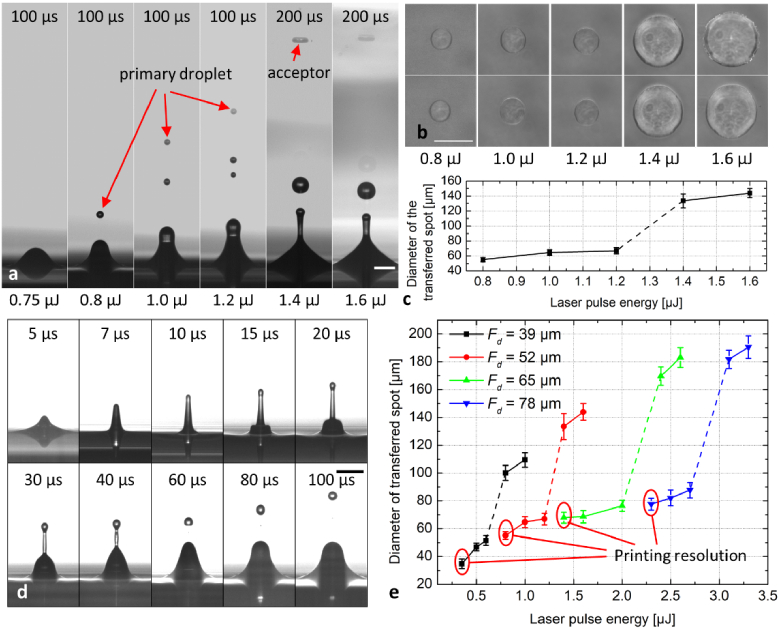
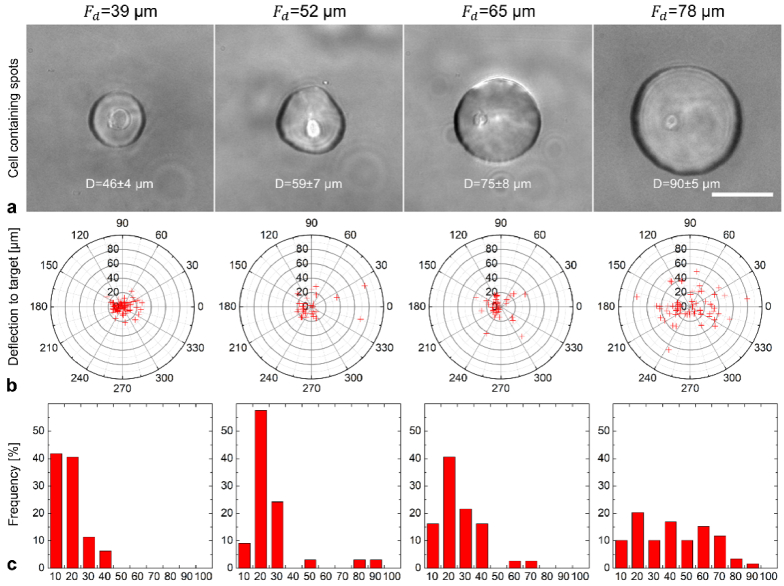
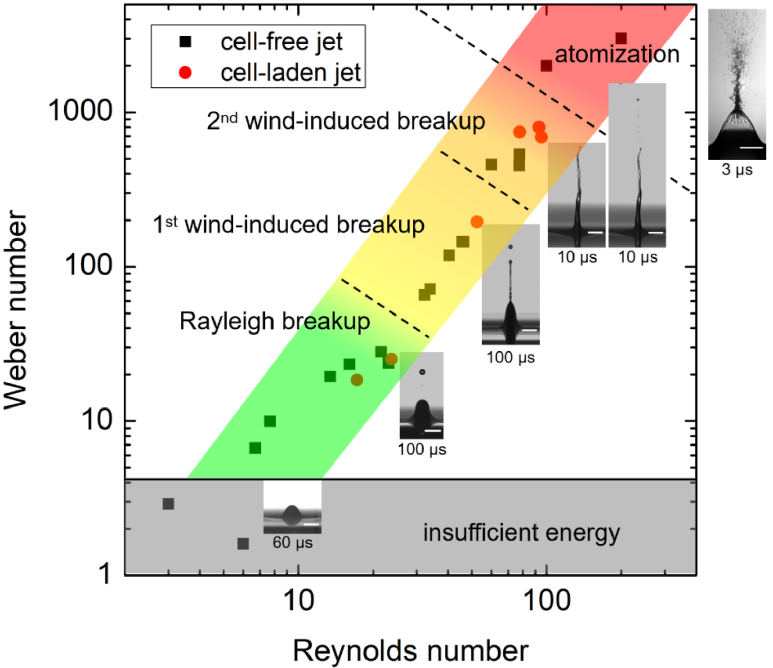
In the present study, we investigated the dynamics of a femtosecond (fs) laser induced bio-printing with cell-free and cell-laden jets under the variation of laser pulse energy and focus depth, by using time-resolved imaging. By increasing the laser pulse energy or decreasing the focus depth thresholds for a first and second jet are exceeded and more laser pulse energy is converted to kinetic jet energy. With increasing jet velocity, the jet behavior changes from a well-defined laminar jet, to a curved jet and further to an undesired splashing jet. We quantified the observed jet forms with the dimensionless hydrodynamic Weber and Rayleigh numbers and identified the Rayleigh breakup regime as the preferred process window for single cell bioprinting. Herein, the best spatial printing resolution of 42 ± 3 µm and single cell positioning precision of 12.4 µm are reached, which is less than one single cell diameter about 15 µm.


Conflict of interest statement

The authors declare that there are no conflicts of interest related to this article.

Figures

Fig. 1.
Fig. 1.
(a) Schematic setup of a standard laser-induced forward transfer of cells with a sacrificial absorbing layer. (b) Schematic setup used for film-free fs laser bioprinting by focusing the laser pulse into a transparent hydrogel. Due to non-linear optical effects, the laser pulse is absorbed without the need of an absorbing layer [14].
Fig. 2.
Fig. 2.
Time-resolved imaging method. (a) Representative image highlighting how height and FWHM were measured from an obtained photograph of a hydrogel jet at a delay time of 10 µs. (b) Pump-probe setup comprising the optical path of the fs-pump (red, vertical) and the ns-probe pulses (green, horizontal) with camera CCD1. A vertical light green beam indicates the optical path for imaging the surface of the free or cell-laden reservoir onto a camera CCD2 [18].
Fig. 3.
Fig. 3.
Time-resolved images of the laser-induced jet dynamics in variation of laser pulse energy from 0.4 to 7 µJ, while the focus depth was fixed at 52 µm. (a) The laser pulse energy is too low to transfer the hydrogel. (b) Cell-free and (d) cell-laden jets (single B16F1 cells) and (c and e) the corresponding transferred hydrogel spots on the acceptor slide. The lower part of the time series images shows an angled view onto the reservoir’s hydrogel surface. The upper margin of the images gives an angled view onto the acceptor slide (indicated with black arrows). The red rectangles display a 3-fold magnification of the green rectangles in the respective columns. Red arrows indicate the single cells separated from the jet. (f and g) At 5 and 7 µJ jets tend to develop in an unstable turbulent and splashing form. All scale bars are 100 µm.
Fig. 4.
Fig. 4.
(a) Widths of the first jet at fixed delay time of 10 µs. (b) Velocities of the cell-free, cell-laden jet and the separated single-cell. (c) The diameter of the transferred hydrogel spots on the acceptor slide with the variation of the laser pulse energy. The jet velocity and the spot diameter are at minimum for the low energy of 1 µJ. At 3 and 4 µJ the transferred single cell separates from the first jet and shows a much higher velocity.
Fig. 5.
Fig. 5.
Time-resolved images of the laser-induced jet dynamics in variation of focus depth from 26 µm to 78 µm with fixed laser pulse energy at 2 µJ. (a) Jet develops turbulent and splashing at a focus depth of 26 µm. (b) Bell-free and (d) cell-laden jets and (c and e) the corresponding transferred hydrogel spots on the acceptor slide. At 65 µm only first jet is reaching the acceptor. The red rectangles display a 3-fold magnification of the green marked region. Red arrows indicate the single cells separated from the jet. (f) A focus depth of 78 µm is too high to generate a transferring jet. All scale bars are 100 µm long. Jets become thicker and slower with decreasing focus depth.
Fig. 6.
Fig. 6.
(a) Widths of the first jet at fixed delay time of 10 µs. (b) Velocities of the cell-free, cell-laden jet and the separated single-cell. (c) The diameter of the transferred hydrogel spots on the acceptor slide with the variation of the laser focus depth at constant pulse energy of 2 µJ. The jet velocity and the spot diameter are minimal for the high focus depth of 65 µm, when only the first jet is reaching the acceptor. At 39 µm the transferred single cells separated from the first jet and develop with a significantly higher velocity.
Fig. 7.
Fig. 7.
(a) Jet form by carefully increasing laser pulse energies at a fixed focus depth of 52 µm and delay times of 100 µs or 200 µs slightly below and above the single jet threshold of 0.8 µJ. (b) Microscope image of the corresponding transferred hydrogel spots on the acceptor slide and (c) their diameters versus laser pulse energy. (d) Time-resolved image of the breakup process from the first jet by using the threshold energy at 0.8 µJ. (e) Plot of the transferred spot diameter by increasing the laser pulse energy and focus depth. All scale bars are 100 µm.
Fig. 8.
Fig. 8.
(a) Bright field microscopy images of the transferred hydrogel spots each containing one single B16F1 cell on the acceptor slide. Scale bar is 50 µm. (b) Distribution of the actual cell positions on the acceptor with average values as coordinate origin. At at 39 µm focus depth the standard deviation of cells amounts to 12.4 µm. (c) The histogram displays the frequencies in percent of the radial deviations from the origin with the given value in µm on the abscissa.
Fig. 9.
Fig. 9.
Display of the color-coded characteristic regimes and corresponding shadowgrapic images as a function of Weber and Reynolds numbers in a double-logarithmic plot. Grey squares (cell-free) and red dots (cell-laden) are experimental data points from Supplemental Table S1. As the Weber and Reynolds numbers increase, the jet behavior changes from no material transfer (grey) to laminar jets to Rayleigh breakup (green) and the first wind-induced breakup regime (yellow) to a curved or even splashing jet form due to the second wind-induced (orange) and atomization breakup (red). All scale bars are 100 µm. Desired regimes for the fs bioprinting are coded in Green.

Similar articles

Cited by

References

    1. Gruene M., Unger C., Koch L., Deiwick A., Chichkov B., “Dispensing pico to nanolitre of a natural hydrogel by laser-assisted bioprinting,” Biomed Eng Online 10(1), 19 (2011).10.1186/1475-925X-10-19 - DOI - PMC - PubMed
    1. Duocastella M., “Laser-induced Forward Transfer of Liquids for Miniaturized Biosensors Preparation,” J. Laser Micro/Nanoeng. 3(1), 1–4 (2008).10.2961/jlmn.2008.01.0001 - DOI
    1. Serra P., “Laser-induced forward Transfer: a Direct-writing Technique for Biosensors Preparation,” J. Laser Micro/Nanoeng. 1(3), 236–242 (2006).10.2961/jlmn.2006.03.0017 - DOI
    1. Colina M., Serra P., Fernández-Pradas J. M., Sevilla L., Morenza J. L., “DNA deposition through laser induced forward transfer,” Biosens. Bioelectron. 20(8), 1638–1642 (2005).10.1016/j.bios.2004.08.047 - DOI - PubMed
    1. Serra P., Colina M., Fernández-Pradas J. M., Sevilla L., Morenza J. L., “Preparation of functional DNA microarrays through laser-induced forward transfer,” Appl. Phys. Lett. 85(9), 1639–1641 (2004).10.1063/1.1787614 - DOI

LinkOut - more resources