

Label-free intratissue activity imaging of alveolar organoids with dynamic optical coherence tomography
- PMID: 37206117
- PMCID: PMC10191660
- DOI: 10.1364/BOE.488097
Label-free intratissue activity imaging of alveolar organoids with dynamic optical coherence tomography
Abstract
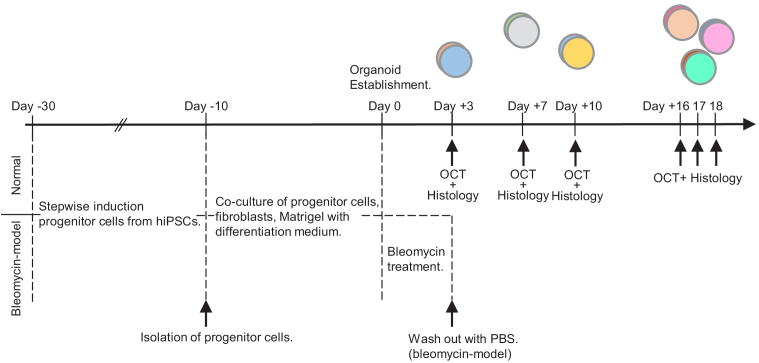
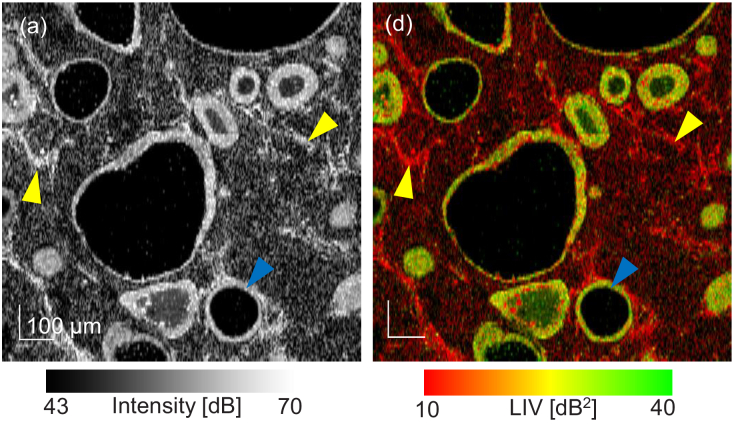
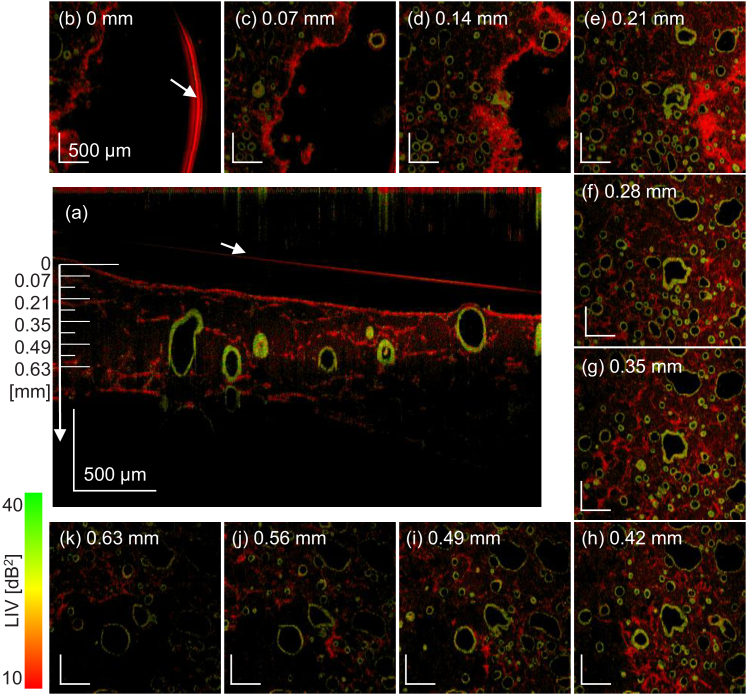
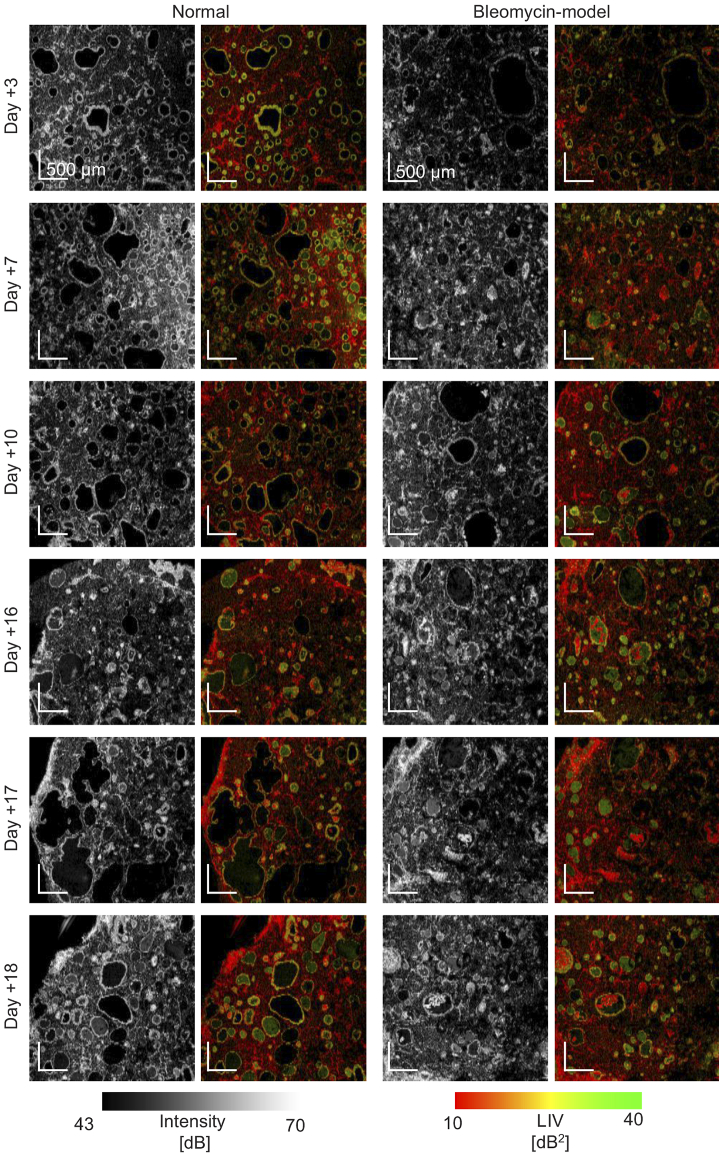
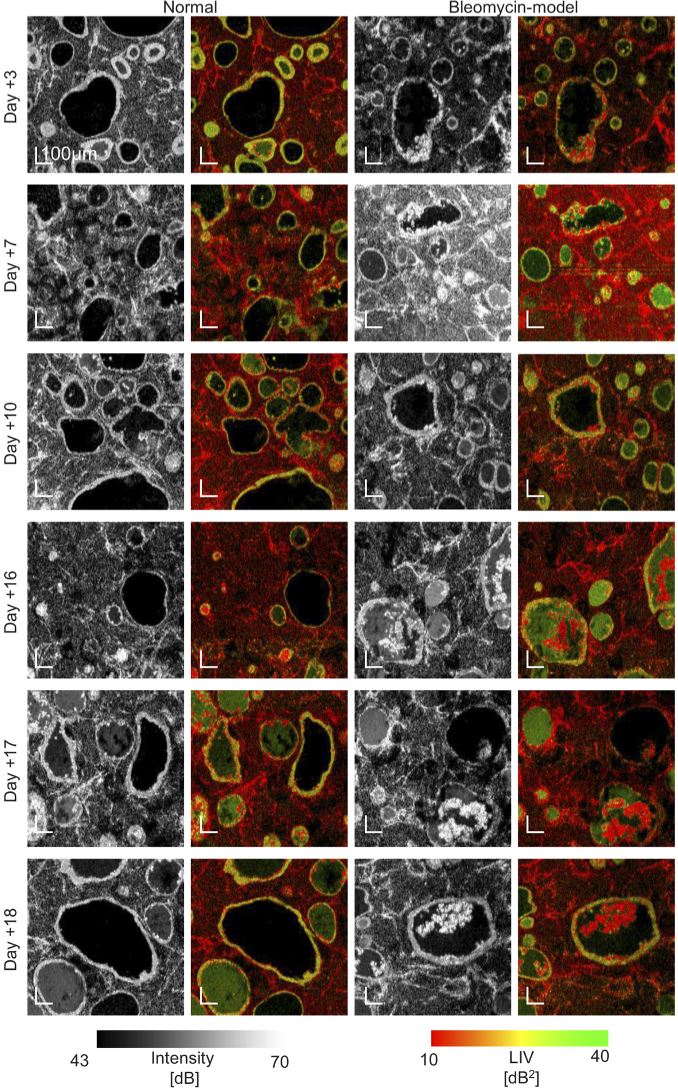
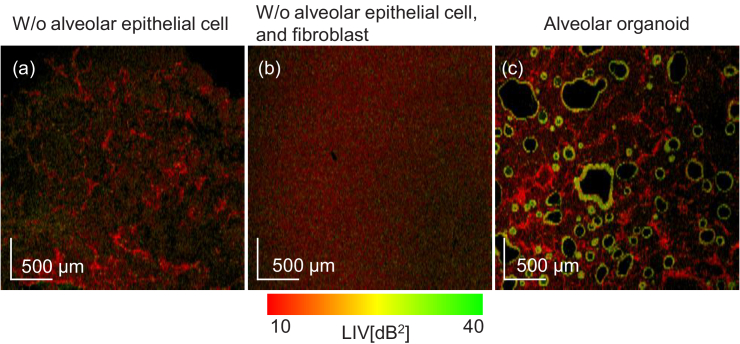
An organoid is a three-dimensional (3D) in vitro cell culture emulating human organs. We applied 3D dynamic optical coherence tomography (DOCT) to visualize the intratissue and intracellular activities of human induced pluripotent stem cells (hiPSCs)-derived alveolar organoids in normal and fibrosis models. 3D DOCT data were acquired with an 840-nm spectral domain optical coherence tomography with axial and lateral resolutions of 3.8 µm (in tissue) and 4.9 µm, respectively. The DOCT images were obtained by the logarithmic-intensity-variance (LIV) algorithm, which is sensitive to the signal fluctuation magnitude. The LIV images revealed cystic structures surrounded by high-LIV borders and mesh-like structures with low LIV. The former may be alveoli with a highly dynamics epithelium, while the latter may be fibroblasts. The LIV images also demonstrated the abnormal repair of the alveolar epithelium.
Published by Optica Publishing Group under the terms of the Creative Commons Attribution 4.0 License. Further distribution of this work must maintain attribution to the author(s) and the published article’s title, journal citation, and DOI.
Conflict of interest statement
Morishita, Mukherjee, Abd El-Sadek, Lim, Makita, Tomita, Yasuno: Yokogawa Electric Corp. (F), Sky Technology (F), Nikon (F), Kao Corp. (F), Topcon (F), Tomey Corp (F). Suzuki: Chugai Pharmaceutical Co, Ltd (R), Nippon Boehringer Ingelheim (R), Sysmex Corporation (R). Lichtenegger: None. Yamamoto: HiLung Inc. (I, P). Nagamoto: HiLung Inc. (I).
Figures
Similar articles
-
Line-field dynamic optical coherence tomography platform for volumetric assessment of biological tissues.Biomed Opt Express. 2024 Jun 7;15(7):4162-4175. doi: 10.1364/BOE.527797. eCollection 2024 Jul 1. Biomed Opt Express. 2024. PMID: 39022542 Free PMC article.
-
Renal tubular function and morphology revealed in kidney without labeling using three-dimensional dynamic optical coherence tomography.Sci Rep. 2023 Sep 15;13(1):15324. doi: 10.1038/s41598-023-42559-3. Sci Rep. 2023. PMID: 37714913 Free PMC article.
-
Neural-network based high-speed volumetric dynamic optical coherence tomography.Biomed Opt Express. 2024 Apr 19;15(5):3216-3239. doi: 10.1364/BOE.519964. eCollection 2024 May 1. Biomed Opt Express. 2024. PMID: 38855683 Free PMC article.
-
Structural and Functional Characterization of Human Stem-Cell-Derived Retinal Organoids by Live Imaging.Invest Ophthalmol Vis Sci. 2017 Jul 1;58(9):3311-3318. doi: 10.1167/iovs.16-20796. Invest Ophthalmol Vis Sci. 2017. PMID: 28672397 Free PMC article. Review.
-
Pluripotent stem cell-derived kidney organoids: An in vivo-like in vitro technology.Eur J Pharmacol. 2016 Nov 5;790:12-20. doi: 10.1016/j.ejphar.2016.06.059. Epub 2016 Jul 1. Eur J Pharmacol. 2016. PMID: 27375081 Review.
Cited by
-
Deep learning based characterization of human organoids using optical coherence tomography.Biomed Opt Express. 2024 Apr 17;15(5):3112-3127. doi: 10.1364/BOE.515781. eCollection 2024 May 1. Biomed Opt Express. 2024. PMID: 38855657 Free PMC article.
-
Line-field dynamic optical coherence tomography platform for volumetric assessment of biological tissues.Biomed Opt Express. 2024 Jun 7;15(7):4162-4175. doi: 10.1364/BOE.527797. eCollection 2024 Jul 1. Biomed Opt Express. 2024. PMID: 39022542 Free PMC article.
-
30 Years of Optical Coherence Tomography: introduction to the feature issue.Biomed Opt Express. 2023 Sep 26;14(10):5484-5487. doi: 10.1364/BOE.505569. eCollection 2023 Oct 1. Biomed Opt Express. 2023. PMID: 37854547 Free PMC article.
-
Dynamic-OCT simulation framework based on mathematical models of intratissue dynamics, image formation, and measurement noise.Biomed Opt Express. 2025 Jun 23;16(7):2875-2897. doi: 10.1364/BOE.564025. eCollection 2025 Jul 1. Biomed Opt Express. 2025. PMID: 40677806 Free PMC article.
-
Quantitative evaluation of the site-dependent cell viability in three-dimensional hepatocyte spheroids based on dynamic optical coherence tomography.J Biomed Opt. 2025 Mar;30(3):035003. doi: 10.1117/1.JBO.30.3.035003. Epub 2025 Mar 14. J Biomed Opt. 2025. PMID: 40134833 Free PMC article.
References
-
- Bartfeld S., Bayram T., van de Wetering M., Huch M., Begthel H., Kujala P., Vries R., Peters P. J., Clevers H., “In vitro expansion of human gastric epithelial stem cells and their responses to bacterial infection,” Gastroenterology 148(1), 126–136.e6 (2015).10.1053/j.gastro.2014.09.042 - DOI - PMC - PubMed
LinkOut - more resources
Full Text Sources