Spatial and temporal dynamics at an actively silicifying hydrothermal system
- PMID: 37206339
- PMCID: PMC10188993
- DOI: 10.3389/fmicb.2023.1172798
Spatial and temporal dynamics at an actively silicifying hydrothermal system
Abstract
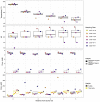
Steep Cone Geyser is a unique geothermal feature in Yellowstone National Park (YNP), Wyoming, actively gushing silicon-rich fluids along outflow channels possessing living and actively silicifying microbial biomats. To assess the geomicrobial dynamics occurring temporally and spatially at Steep Cone, samples were collected at discrete locations along one of Steep Cone's outflow channels for both microbial community composition and aqueous geochemistry analysis during field campaigns in 2010, 2018, 2019, and 2020. Geochemical analysis characterized Steep Cone as an oligotrophic, surface boiling, silicious, alkaline-chloride thermal feature with consistent dissolved inorganic carbon and total sulfur concentrations down the outflow channel ranging from 4.59 ± 0.11 to 4.26 ± 0.07 mM and 189.7 ± 7.2 to 204.7 ± 3.55 μM, respectively. Furthermore, geochemistry remained relatively stable temporally with consistently detectable analytes displaying a relative standard deviation <32%. A thermal gradient decrease of ~55°C was observed from the sampled hydrothermal source to the end of the sampled outflow transect (90.34°C ± 3.38 to 35.06°C ± 7.24). The thermal gradient led to temperature-driven divergence and stratification of the microbial community along the outflow channel. The hyperthermophile Thermocrinis dominates the hydrothermal source biofilm community, and the thermophiles Meiothermus and Leptococcus dominate along the outflow before finally giving way to more diverse and even microbial communities at the end of the transect. Beyond the hydrothermal source, phototrophic taxa such as Leptococcus, Chloroflexus, and Chloracidobacterium act as primary producers for the system, supporting heterotrophic growth of taxa such as Raineya, Tepidimonas, and Meiothermus. Community dynamics illustrate large changes yearly driven by abundance shifts of the dominant taxa in the system. Results indicate Steep Cone possesses dynamic outflow microbial communities despite stable geochemistry. These findings improve our understanding of thermal geomicrobiological dynamics and inform how we can interpret the silicified rock record.
Keywords: Steep Cone Geyser; Yellowstone National Park; geochemistry; hydrothermal spring; microbial ecology; microbial mats; rock record; silicification.
Copyright © 2023 Rasmussen, Stamps, Vanzin, Ulrich and Spear.
Conflict of interest statement
SU was employed by Arcadis, U.S., Inc. The remaining authors declare that the research was conducted in the absence of any commercial or financial relationships that could be construed as a potential conflict of interest.
Figures


References
-
- Albuquerque L., Ferreira C., Tomaz D., Tiago I., Veríssimo A., da Costa M. S., et al. . (2009). Meiothermus rufus sp. Nov., a new slightly thermophilic red-pigmented species and emended description of the genus Meiothermus. Syst. Appl. Microbiol. 32, 306–313. doi: 10.1016/J.SYAPM.2009.05.002, PMID: - DOI - PubMed
-
- Albuquerque L., Polónia A. R. M., Barroso C., Froufe H. J. C., Lage O., Lobo-Da-Cunha A., et al. . (2018). Raineya orbicola gen. Nov., sp. Nov. a slightly thermophilic bacterium of the phylum bacteroidetes and the description of Raineyaceae fam. Nov. Int. J. Syst. Evol. Microbiol. 68, 982–989. doi: 10.1099/IJSEM.0.002556/CITE/REFWORKS, PMID: - DOI - PMC - PubMed
-
- Allewalt J. P., Bateson M. M., Revsbech N. P., Slack K., Ward D. M. (2006). Effect of temperature and light on growth of and photosynthesis by Synechococcus isolates typical of those predominating in the Octopus spring microbial mat Community of Yellowstone National Park. Appl. Environ. Microbiol. 72, 544–550. doi: 10.1128/AEM.72.1.544-550.2006, PMID: - DOI - PMC - PubMed
-
- Andersen K. S., Kirkegaard R. H., Karst S. M., Albertsen M. (2018). ampvis2: An R package to analyse and visualise 16S rRNA amplicon data. bioRxiv.
-
- Barnett D. J. M., Arts I. C. W., Penders J. (2021). microViz: an R package for microbiome data visualization and statistics. J. Open Source Softw. 6:3201. doi: 10.21105/JOSS.03201 - DOI
LinkOut - more resources
Full Text Sources

