. 2023 Apr 17;14(19):5069-5078.
doi: 10.1039/d3sc00955f. eCollection 2023 May 17.

Transcription activation by the resistance protein AlbA as a tool to evaluate derivatives of the antibiotic albicidin

Affiliations

Transcription activation by the resistance protein AlbA as a tool to evaluate derivatives of the antibiotic albicidin

Simone Kosol et al. Chem Sci. .

Abstract

The rising numbers of fatal infections with resistant pathogens emphasizes the urgent need for new antibiotics. Ideally, new antibiotics should be able to evade or overcome existing resistance mechanisms. The peptide antibiotic albicidin is a highly potent antibacterial compound with a broad activity spectrum but also with several known resistance mechanisms. In order to assess the effectiveness of novel albicidin derivatives in the presence of the binding protein and transcription regulator AlbA, a resistance mechanism against albicidin identified in Klebsiella oxytoca, we designed a transcription reporter assay. In addition, by screening shorter albicidin fragments, as well as various DNA-binders and gyrase poisons, we were able to gain insights into the AlbA target spectrum. We analysed the effect of mutations in the binding domain of AlbA on albicidin sequestration and transcription activation, and found that the signal transduction mechanism is complex but can be evaded. Further demonstrating AlbA's high level of specificity, we find clues for the logical design of molecules capable of avoiding the resistance mechanism.


Conflict of interest statement

There are no conflicts to declare.

Figures

Fig. 1
Fig. 1. Structure of albicidin (1) and aza-His albicidin (2) with its six building blocks: methyl p-coumaric acid (MCA-1) in block A; a p-aminobenzoic acid (pABA) in block B, β-cyano-l-alanine in block C (or aza-l-His in case of 2), a second pABA in block D, and 4-amino-2-hydroxy-3-methoxybenzoic acids in blocks E and F. The grey frame in the background illustrates the shape of the molecule in structural studies.
Fig. 2
Fig. 2. Promoter binding of AlbA. (A) MerR-type model of transcription activation by AlbA upon binding of albicidin. The LBD is coloured in teal, the coiled-coil domain in blue and the DBD is shown in purple. (B) Suggested palindromic binding site (two 8-base sequences separated by a 1-base spacer, highlighted in purple) of AlbA in the 19 bp long spacer between the −35 and −10 regions (bold nucleotides). The 41 bp fragment (pAlbA) containing the AlbA promoter region which was used in binding assays is indicated by a dashed box. The sequence logo below shows conserved bases in MerR-type promoters with 19 bp spacers. (C) Ethidium bromide-stained EMSA gel of the DNA fragment pAlbA (100 ng per lane) incubated with increasing concentrations of AlbA (lanes 3-12). Controls of pAlbA with 10.2 μM AlbAS (AlbA without DBD) (lane 1) and AlbA alone (lane 2, c = 18.4 μM) are shown on the left side of the gel. (D) Gel band intensities in the EMSA assays fitted against AlbA concentrations show binding of AlbA to pAlbA in absence (black) and presence (blue) of 1.5× fold excess of albicidin (gels see Fig. S1A†). The fitting resulted in dissociation constants Kd of 7.8 ± 1.1 μM and 4.9 ± 0.7 μM, respectively. Error bars represent gel band quantification errors based on noise levels. (E) Time curve of luminescence intensities during the response reporter assay after addition of 0, 0.5, 1.0, 1.5, 2.0 and 5.0 μM aza-His albicidin (2). The error bars represent the standard deviation of each data point measured in triplicate. The inset shows the maxima of each curve with the error bars representing the standard deviation of each maximum.
Fig. 3
Fig. 3. AlbA transcription activation by shorter albicidin fragments. (A) Crystal structure of the ligand binding domain of AlbA (AlbAS, cyan, PDB-ID: 6et8) with H-bonds to albicidin (magenta) shown as dashed blue lines. Side-chains of amino acid residues involved in H-bonds or π–π interactions are shown as sticks with nitrogen atoms in blue and oxygen atoms in red. (B) Surface representation of the binding pocket with bound albicidin. AlbA residues involved in hydrogen bonds with albicidin are shown as sticks. Amino acid labels correspond to their position in full-length AlbA. (C) The transcription response of AlbA upon addition of 1.5 μM of an albicidin fragment (3–9) is normalized to the full-length control (2). Fragments B-D (8), A-D (5) and 2 contain the aza-His in block C (Fig. 1 and S5†). Error bars depict the standard deviation of the mean maximum of triplicate measurements.
Fig. 4
Fig. 4. Transcription activation of AlbA variants is not coupled to tight albicidin binding. (A) Box plots and superimposed data points (black diamonds) of the luminescence signal maxima of AlbA mutants and wild-type AlbA (n = 20). The boxes show the interquartile range between upper and lower quartiles, the median (black line) and mean (white squares) are shown. Error bars show 1.5× interquartile range. Mutants with significantly different luminescence output are marked with one (*, Wilcoxon–Mann–Whitney test p ≤ 0.05) or two (**, p ≤ 0.01) asterisks. (B) Dissociation constants (Kd) of AlbA variants and 2 (see Table S2†). Mutants with variations in the binding pocket are highlighted in magenta. The grey bar shows the fitting error interval of the wild-type protein Kd and error bars show the fitting errors. (C) E. coli growth inhibition assays in the presence of AlbA or a mutant protein and 2. Triplicates for each mutant are shown (Rep 1–3). (D) Structure of AlbAS (transparent grey, PDB-ID: 6et8) with bound albicidin in pink and the clamp helices shown in opaque white. Residues altered in the mutant proteins are depicted as sticks and balls coloured according to their performance in transcription activation assays compared to AlbA-WT.
Fig. 5
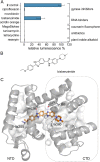
Fig. 5. The AlbA binding pocket is specific. (A) Relative luminescence in transcription activation assays with DNA gyrase inhibitors as well as DNA binders. Error bars represent the standard deviation of the mean maximum from triplicate measurements. See Fig. S9 for the chemical structures. (B) Structural formula of bisbenzimide (Hoechst33342) and (C) AutoDock Vina model of bisbenzimide docked in the AlbA binding pocket. Sidechains of residues interacting with bisbenzimide via H-bonds (dashed blue lines) or π–π interactions are shown as sticks. Oxygen atoms are indicated in red, nitrogen is depicted in blue and polar hydrogens are shown as white balls.
Fig. 6
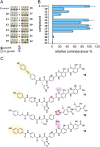
Fig. 6. AlbA binding and transcription response of albicidin derivatives. (A) E. coli growth inhibition assays employing albicidin derivatives 10–22 (Fig. S11†) preincubated with AlbA. In the upper rows (−), only the derivative was added to monitor the antibiotic activity and in the bottom rows (+), an equimolar mixture of the derivative and AlbA was added. Triplicates for each derivative are shown. (B) Relative luminescence in transcription activation assays with albicidin derivatives 10–22. Error bars represent the standard deviation of the mean maximum from triplicate measurements. (C) Chemical structures of albicidin derivatives 10–13 with low transcription activation and antibacterial activity. Variations of building blocks are highlighted.

References

    1. Murray C. J. Ikuta K. S. Sharara F. Swetschinski L. Robles Aguilar G. Gray A. Han C. Bisignano C. Rao P. Wool E. Johnson S. C. Browne A. J. Chipeta M. G. Fell F. Hackett S. Haines-Woodhouse G. Kashef Hamadani B. H. Kumaran E. A. P. McManigal B. Agarwal R. Akech S. Albertson S. Amuasi J. Andrews J. Aravkin A. Ashley E. Bailey F. Baker S. Basnyat B. Bekker A. Bender R. Bethou A. Bielicki J. Boonkasidecha S. Bukosia J. Carvalheiro C. Castañeda-Orjuela C. Chansamouth V. Chaurasia S. Chiurchiù S. Chowdhury F. Cook A. J. Cooper B. Cressey T. R. Criollo-Mora E. Cunningham M. Darboe S. Day N. P. J. De Luca M. Dokova K. Dramowski A. Dunachie S. J. Eckmanns T. Eibach D. Emami A. Feasey N. Fisher-Pearson N. Forrest K. Garrett D. Gastmeier P. Giref A. Z. Greer R. C. Gupta V. Haller S. Haselbeck A. Hay S. I. Holm M. Hopkins S. Iregbu K. C. Jacobs J. Jarovsky D. Javanmardi F. Khorana M. Kissoon N. Kobeissi E. Kostyanev T. Krapp F. Krumkamp R. Kumar A. Kyu H. H. Lim C. Limmathurotsakul D. Loftus M. J. Lunn M. Ma J. Mturi N. Munera-Huertas T. Musicha P. Mussi-Pinhata M. M. Nakamura T. Nanavati R. Nangia S. Newton P. Ngoun C. Novotney A. Nwakanma D. Obiero C. W. Olivas-Martinez A. Olliaro P. Ooko E. Ortiz-Brizuela E. Peleg A. Y. Perrone C. Plakkal N. Ponce-de-Leon A. Raad M. Ramdin T. Riddell A. Roberts T. Robotham J. V. Roca A. Rudd K. E. Russell N. Schnall J. Scott J. A. G. Shivamallappa M. Sifuentes-Osornio J. Steenkeste N. Stewardson A. J. Stoeva T. Tasak N. Thaiprakong A. Thwaites G. Turner C. Turner P. van Doorn H. R. Velaphi S. Vongpradith A. Vu H. Walsh T. Waner S. Wangrangsimakul T. Wozniak T. Zheng P. Sartorius B. Lopez A. D. Stergachis A. Moore C. Dolecek C. Naghavi M. Lancet. 2022;399:629–655. doi: 10.1016/S0140-6736(21)02724-0. - DOI - PMC - PubMed
    1. Laws M. Shaaban A. Rahman K. M. FEMS Microbiol. Rev. 2019;43:490–516. doi: 10.1093/femsre/fuz014. - DOI - PMC - PubMed
    1. Hobson C. Chan A. N. Wright G. D. Chem. Rev. 2021;121:3464–3494. doi: 10.1021/acs.chemrev.0c01214. - DOI - PubMed
    1. Fischbach M. A. Walsh C. T. Science. 2009;325:1089–1093. doi: 10.1126/science.1176667. - DOI - PMC - PubMed
    1. Royer M. Costet L. Vivien E. Bes M. Cousin A. Damais A. Pieretti I. Savin A. Megessier S. Viard M. Frutos R. Gabriel D. W. Rott P. C. Mol. Plant-Microbe Interact. 2004;17:414–427. doi: 10.1094/MPMI.2004.17.4.414. - DOI - PubMed