. 2023 May 3:17:1130347.
doi: 10.3389/fnins.2023.1130347. eCollection 2023.

Brain effects of gestating germ-free persist in mouse neonates despite acquisition of a microbiota at birth

Affiliations

Brain effects of gestating germ-free persist in mouse neonates despite acquisition of a microbiota at birth

Alexandra Castillo-Ruiz et al. Front Neurosci. .

Abstract

At birth, mammals experience a massive colonization by microorganisms. We previously reported that newborn mice gestated and born germ-free (GF) have increased microglial labeling and alterations in developmental neuronal cell death in the hippocampus and hypothalamus, as well as greater forebrain volume and body weight when compared to conventionally colonized (CC) mice. To test whether these effects are solely due to differences in postnatal microbial exposure, or instead may be programmed in utero, we cross-fostered GF newborns immediately after birth to CC dams (GF→CC) and compared them to offspring fostered within the same microbiota status (CC→CC, GF→GF). Because key developmental events (including microglial colonization and neuronal cell death) shape the brain during the first postnatal week, we collected brains on postnatal day (P) 7. To track gut bacterial colonization, colonic content was also collected and subjected to 16S rRNA qPCR and Illumina sequencing. In the brains of GF→GF mice, we replicated most of the effects seen previously in GF mice. Interestingly, the GF brain phenotype persisted in GF→CC offspring for almost all measures. In contrast, total bacterial load did not differ between the CC→CC and GF→CC groups on P7, and bacterial community composition was also very similar, with a few exceptions. Thus, GF→CC offspring had altered brain development during at least the first 7 days after birth despite a largely normal microbiota. This suggests that prenatal influences of gestating in an altered microbial environment programs neonatal brain development.

Keywords: bacterial load; cell death; colonic content; cross-fostering; forebrain size; microglia.


Conflict of interest statement

The authors declare that the research was conducted in the absence of any commercial or financial relationships that could be construed as a potential conflict of interest.

Figures

FIGURE 1
FIGURE 1
Experimental design. GF newborns were cross-fostered immediately after birth to CC dams (GF→CC group) and compared to offspring fostered within the same microbiota status (CC→CC, GF→GF groups).
FIGURE 2
FIGURE 2
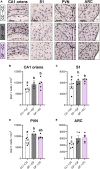
Microglial effects of gestating germ-free persist in mouse neonates despite introduction to a microbiota at birth. (A) Photomicrographs of Iba1 + stained tissue in representative CC→CC, GF→GF, and GF→CC mice, showing the brain regions analyzed: CA1 oriens, S1, PVN, and ARC (regions smaller than field of view indicated with black lines). 3V, third ventricle. Scale bar = 100 μm. (B,C) Microglial density was higher in groups gestated GF in the CA1 oriens (B) and S1 (C), regardless of introduction to a microbiota at birth in the GF→CC group. (D) In contrast, microglial density in the PVN was no different between GF→CC and either control group, suggesting partial normalization of the microglial phenotype by microbiota introduction at birth. (E) No differences between groups were seen in the ARC. Group means with different letters are significantly different from each other. Mean + SEM and individual data points are depicted, with gray symbols representing sham cross-fostered mice in control groups.
FIGURE 3
FIGURE 3
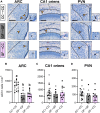
Cell death effects of gestating germ-free persist in the ARC of mouse neonates despite introduction to a microbiota at birth. (A) Photomicrographs of AC3 + stained tissue (counterstained with thionin) in representative CC→CC, GF→GF, and GF→CC mice, showing the brain regions analyzed: ARC, CA1 oriens, and PVN (all regions indicated with black lines). Arrowheads point to cells shown at higher magnification in the insets. 3V, third ventricle. Scale bar = 100 μm (main photomicrograph) and 20 μm (insets). (B) Cell death density was lower in groups gestated GF in the ARC, regardless of introduction to a microbiota at birth in the GF→CC group. (C,D) Cell death density did not differ between groups in the CA1 oriens (C) or PVN. (D) Group means with different letters are significantly different from each other. Mean + SEM and individual data points are depicted, with gray symbols representing sham cross-fostered mice in control groups.
FIGURE 4
FIGURE 4
Effects of gestating germ-free on body weight and forebrain size persist in mouse neonates despite introduction to a microbiota at birth. Body weight (A) and forebrain size (B) were greater in GF→GF and GF→CC mice, in comparison to the CC→CC group. Group means with different letters are significantly different from each other. Mean + SEM and individual data points are depicted, with gray symbols representing sham cross-fostered mice in control groups.
FIGURE 5
FIGURE 5
Introduction to a microbiota at birth normalizes the bacterial load of mice gestated germ-free at P7. (A) Relative quantification of the 16S rRNA gene from colon content showed similar levels of bacterial DNA in the groups harboring microbiota. The GF→GF group was used as reference group for fold change calculations. (B) Size of the colon content sample was unlikely to affect the assessment of bacterial load as there were no differences in this measure between groups. Group means with different letters are significantly different from each other. Mean + SEM and individual data points are depicted, with gray symbols representing sham cross-fostered mice in control groups.
FIGURE 6
FIGURE 6
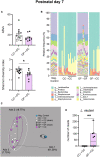
Introduction to a microbiota at birth largely normalizes bacterial composition of mice gestated germ-free by P7. (A) Measures of alpha-diversity revealed no difference between CC→CC and GF→CC groups in the number (richness) of ASVs (top). In contrast, when richness and abundance were considered by using the Shannon diversity index, the GF→CC group showed slightly lower diversity (bottom). Mean + SEM and individual data points are depicted, with gray symbols representing sham cross-fostered mice in control groups. *p = 0.01. (B) Relative abundance of bacterial groups per sample (columns), showing that overall bacterial composition was normalized in the GF→CC group as this group was similar to the CC→CC controls but markedly different from negative control samples and GF→GF controls. Asterisks identify the sham cross-fostered mice in control groups. The 12 most abundant taxa are shown in the color key. Sequences were classified to the lowest taxonomic level that could confidently be identified. f, family; g, genus. (C) PCoA plots based on Bray-Curtis dissimilarity, showing that GF→CC and CC→CC groups were similar in bacterial community composition as individual samples (symbols) clustered together but separate from controls (clustering indicated with ellipses). Note that most samples for negative control and GF→GF groups overlap due to tight clustering; n = 6 and 10 for those groups, respectively. Percent of variance explained by principal coordinates is indicated on the axes. (D) Boxplots of the number of reads per sample of the ASV identified as Lactobacillus reuteri. While the CC→CC group did not return positive L. reuteri reads, half of the samples in the GF→CC group did. **p = 0.003.
FIGURE 7
FIGURE 7
Introduction to a microbiota at birth normalizes the bacterial load of mice gestated germ-free at P3. (A) Relative quantification of the 16S rRNA gene from colon content showed similar levels of bacterial DNA in the groups harboring microbiota. GF→GF group was used as reference group for fold change calculations. (B) There were no differences in weight of the colonic content between groups. Group means with different letters are significantly different from each other. Mean + SEM and individual data points are depicted, with gray symbols representing sham cross-fostered mice in control groups.
FIGURE 8
FIGURE 8
Introduction to a microbiota at birth largely normalizes bacterial composition of mice gestated germ-free by P3. (A) Measures of alpha-diversity revealed a difference between CC→CC and GF→CC groups in the number (richness) of ASVs: the CC→CC group showed doubled the number of ASVs (top). In contrast, when richness and abundance were considered by using the Shannon diversity index, there was no difference between groups (bottom). Mean + SEM and individual data points are depicted, with gray symbols representing sham cross-fostered mice in control groups. ***p = 0.0004. (B) Relative abundance of bacterial groups per sample (columns), showing that overall bacterial composition was similar between GF→CC and CC→CC groups, with the exception of higher abundance of Streptococcus in the CC→CC group. These two groups, however, were markedly different from negative and GF→GF groups. Asterisks indicate the sham cross-fostered mice in control groups. The 12 most abundant taxa are shown in the color key. Sequences were classified to the lowest taxonomic level they could confidently be identified. f, family; g, genus. (C) PCoA plots based on Bray-Curtis dissimilarity, showing that GF→CC and CC→CC individual samples (symbols) clustered somewhat further apart than at P7 but markedly separate from controls (clustering indicated with ellipses). Note that most samples for negative control and GF→GF groups overlap due to tight clustering; n = 6 and 14 in those groups, respectively. Percent of variance explained by principal coordinates is indicated on the axes. (D) Boxplots of the number of reads per sample of the ASV identified as Streptococcus acidominimus. Gray symbols represent sham, cross-fostering in control mice. ****p < 0.0001.

References

    1. Ahern T. H., Krug S., Carr A. V., Murray E. K., Fitzpatrick E., Bengston L., et al. (2013). Cell death atlas of the postnatal mouse ventral forebrain and hypothalamus: Effects of age and sex. J. Comp. Neurol. 521 2551–2569. 10.1002/cne.23298 - DOI - PMC - PubMed
    1. Bäckhed F., Ding H., Wang T., Hooper L. V., Koh G. Y., Nagy A., et al. (2004). The gut microbiota as an environmental factor that regulates fat storage. Proc. Natl. Acad. Sci. U.S.A. 101 15718–15723. 10.1073/pnas.0407076101 - DOI - PMC - PubMed
    1. Bokulich N. A., Chung J., Battaglia T., Henderson N., Jay M., Li H., et al. (2016). Antibiotics, birth mode, and diet shape microbiome maturation during early life. Sci. Transl. Med. 8:343ra382. 10.1126/scitranslmed.aad7121 - DOI - PMC - PubMed
    1. Bolyen E., Rideout J. R., Dillon M. R., Bokulich N. A., Abnet C. C., Al-Ghalith G. A., et al. (2019). Reproducible, interactive, scalable and extensible microbiome data science using QIIME 2. Nat. Biotechnol. 37 852–857. 10.1038/s41587-019-0209-9 - DOI - PMC - PubMed
    1. Brownlie E. J. E., Chaharlangi D., Wong E. O., Kim D., Navarre W. W. (2022). Acids produced by lactobacilli inhibit the growth of commensal Lachnospiraceae and S24-7 bacteria. Gut Microbes 14:2046452. 10.1080/19490976.2022.2046452 - DOI - PMC - PubMed

LinkOut - more resources