. 2023 May 3:14:1173848.
doi: 10.3389/fimmu.2023.1173848. eCollection 2023.

Elevated MPP6 expression correlates with an unfavorable prognosis, angiogenesis and immune evasion in hepatocellular carcinoma

Affiliations

Elevated MPP6 expression correlates with an unfavorable prognosis, angiogenesis and immune evasion in hepatocellular carcinoma

Qianqian Cheng et al. Front Immunol. .

Abstract

Background: Membrane palmitoylated proteins (MPPs) are engaged in various biological processes, such as cell adhesion and cell polarity. Dysregulated MPP members have different effects on hepatocellular carcinoma (HCC) development. However, the role of MPP6 in HCC has been unknown.

Method: HCC transcriptome and clinical data from different public databases were downloaded and analyzed, and the results were further validated by qRT-PCR, Western blotting and immunohistochemistry (IHC) using HCC cell lines and tissues. The association between MPP6 and prognosis, potential pathogenic mechanisms, angiogenesis, immune evasion, tumor mutation burden (TMB) and treatment response in HCC patients was analyzed by bioinformatics and IHC staining.

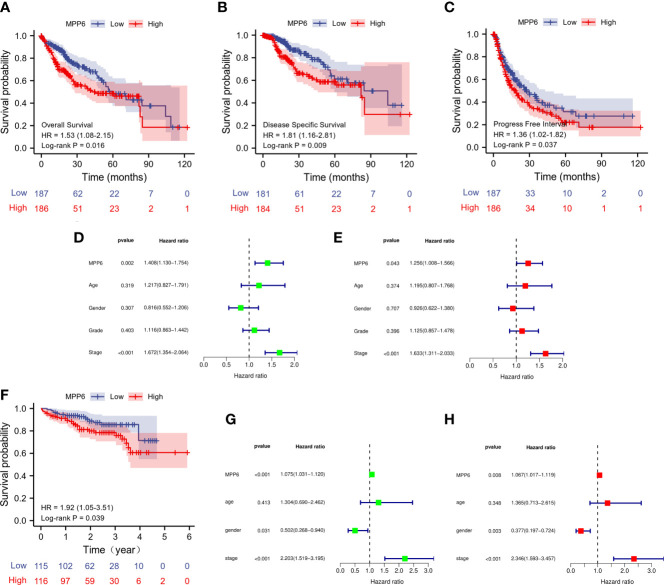
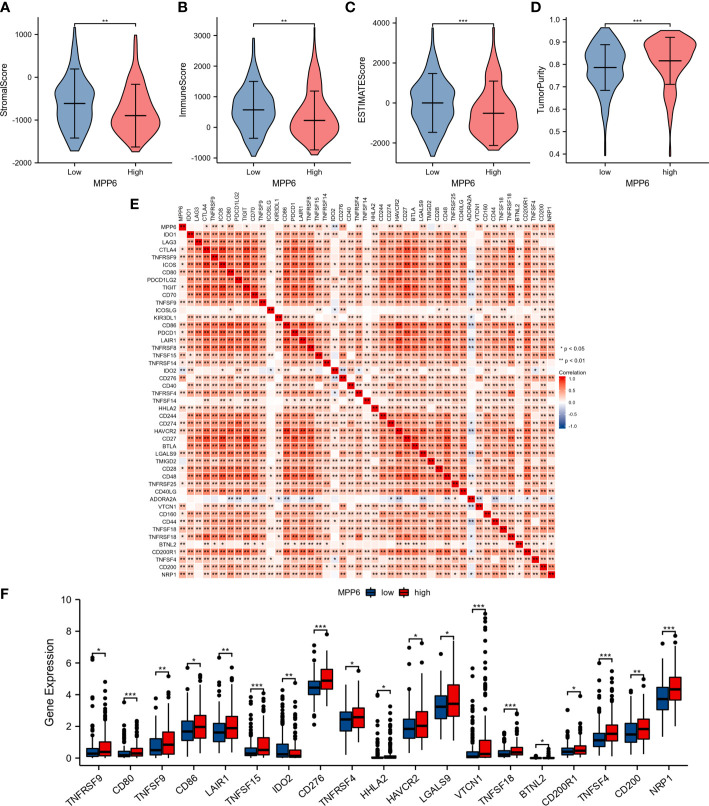
Results: MPP6 was significantly overexpressed in HCC, and its expression was related to T stage, pathologic stage, histologic grade and adverse prognosis in HCC patients. Gene set enrichment analysis revealed that differentially expressed genes were mainly enriched in the synthesis of genetic materials and the WNT signaling pathway. GEPIA database analysis and IHC staining suggested that MPP6 expression had a positive correlation with angiogenesis. Single-cell dataset analysis indicated that MPP6 was associated with features of the tumor microenvironment. Additional analyses discovered that MPP6 expression was inversely related to immune cell infiltration and was involved in tumor immune evasion. MPP6 expression was positively associated with TMB, and patients with high TMB had an adverse prognosis. Immunotherapy was more effective in HCC patients with low MPP6 expression, whereas those with high MPP6 expression responded better to sorafenib, gemcitabine, 5-FU, and doxorubicin.

Conclusions: Elevated MPP6 expression is associated with an unfavorable prognosis, angiogenesis and immune evasion in HCC. Moreover, MPP6 has the potential to be used to assess TMB and treatment response. Therefore, MPP6 might serve as a novel prognostic biomarker and therapeutic target for HCC.

Keywords: MPP6; angiogenesis; hepatocellular carcinoma; immune evasion; prognosis; treatment response.


Conflict of interest statement

The authors declare that the research was conducted in the absence of any commercial or financial relationships that could be construed as a potential conflict of interest.

Figures

Figure 1
Figure 1
MPP6 expression in HCC. (A) MPP6 mRNA expression in malignant tumor and normal tissues based on the TCGA database. (B, C) MPP6 mRNA expression in normal liver and HCC tissues based on GSE112791 (GPL570 platform) and GSE101685 datasets. (D) MPP6 mRNA expression in HCC cell lines (Huh7, Hep3B, BEL-7404, and SMMC-7721) compared with the normal hepatic cell line LO2 by qRT−PCR. (E) MPP6 protein expression in normal liver and HCC tissues based on the UALCAN website. (F) MPP6 protein expression in LO2 and HCC cell lines (Huh7, Hep3B, BEL-7404, and SMMC-7721) by Western blotting. (G) Immunohistochemical staining analysis of MPP6 in normal liver and HCC tissues. *P <0.05; **P <0.01; ***P <0.001; ns: P >0.05.
Figure 2
Figure 2
Correlation analysis of MPP6 expression with clinicopathological characteristics in HCC patients based on the TCGA database. (A) Heatmap showing the connection between MPP6 and clinicopathological characteristics in HCC. (B–H) Relationship between MPP6 and age, gender, T stage, N stage, M stage, pathologic stage, and histologic grade. *P <0.05; **P <0.01; ns, P >0.05.
Figure 3
Figure 3
Prognostic analysis of MPP6 expression in HCC based on TCGA and ICGC databases. (A–C) KM curves of OS, DSS, and PFI for HCC patients with different MPP6 expression in the TCGA database. (D, E) Cox regression analyses of OS in the TCGA database. (F) KM curves of OS for HCC patients with different MPP6 expression in Japan cohort released in the ICGC database. (G, H) Cox regression analyses of OS in Japan cohort released in the ICGC database.
Figure 4
Figure 4
DEGs analysis of high and low MPP6 expression groups in TCGA database. (A) Volcano plot of DEGs of high and low MPP6 expression groups. (B) Heatmap of the top 20 DEGs correlated with MPP6. (C) GO enrichment analysis based on significantly DEGs correlated with MPP6. (D) Identification of MPP6-related signaling pathways by GSEA in high MPP6 expression groups. (E) Identification of MPP6-related signaling pathways by GSEA in low MPP6 expression groups.
Figure 5
Figure 5
Analysis between MPP6 expression and angiogenic factors in HCC. (A) GO enrichment analysis by CAMOIP online database. (B–D) Relevance of expression between MPP6 and VEGFA, VEGFR2 and CD34 based on the GEPIA database. (E, F) Expression of VEGFA, VEGFR2 and CD34 in HCC samples with MPP6 staining intensity of “+” and “+++” based on the study cohort.
Figure 6
Figure 6
Correlation between MPP6 and TME at the single-cell level in the TISCH open access tool. (A) Heatmap showing MPP6 expression in various cells from diverse datasets. (B–D) MPP6 expression in various cells based on the GSE146115, GSE146409 and GSE166635 cohorts.
Figure 7
Figure 7
Relationship between MPP6 and alteration of the immune landscape. (A–D) Comparison of stromal score, immune score, ESTIMATE score and tumor purity in different MPP6 expression groups. (E) Relevance of expression between MPP6 and immune checkpoint genes. (F) Differential expression of immune checkpoint genes in different MPP6 expression groups. *P <0.05; **P <0.01; ***P <0.001.
Figure 8
Figure 8
Correlation analysis of MPP6 with immune cell infiltration in HCC. (A) Differences in immune cell infiltration in different MPP6 expression groups. (B) Relationship between MPP6 and immune cell infiltration. (C–S) Correlation of MPP6 expression with infiltration level of pDC, cytotoxic cells, DC, CD8 T cells, B cells, neutrophils, T cells, Treg, Th17 cells, NK cells, Tgd, mast cells, macrophages, Tcm, TFH, T helper cells, and Th2 cells. *P <0.05; **P <0.01; ***P <0.001; ns, P >0.05.
Figure 9
Figure 9
Association between immune evasion and MPP6 expression. (A) Distribution of CD3+ T cells, CD4+ T cells and CD8+ T cells in HCC samples with MPP6 staining intensity of “+” based on the study cohort. (B) Distribution of CD3+ T cells, CD4+ T cells and CD8+ T cells in HCC samples with MPP6 staining intensity of “+++” based on the study cohort.
Figure 10
Figure 10
Prediction of treatment responses of HCC patients. (A–D) The IC50 values of sorafenib, gemcitabine, 5-FU and doxorubicin in different MPP6 expression groups. (E–H) Response to immunotherapy in high and low MPP6 expression patients.

References

    1. Sung H, Ferlay J, Siegel RL, Laversanne M, Soerjomataram I, Jemal A, et al. . Global cancer statistics 2020: globocan estimates of incidence and mortality worldwide for 36 cancers in 185 countries. CA: Cancer J Clin (2021) 71(3):209–49. doi: 10.3322/caac.21660 - DOI - PubMed
    1. Xia C, Dong X, Li H, Cao M, Sun D, He S, et al. . Cancer statistics in China and united states, 2022: profiles, trends, and determinants. Chin Med J (2022) 135(5):584–90. doi: 10.1097/cm9.0000000000002108 - DOI - PMC - PubMed
    1. Siegel RL, Miller KD, Wagle NS, Jemal A. Cancer statistics, 2023. CA: Cancer J Clin (2023) 73(1):17–48. doi: 10.3322/caac.21763 - DOI - PubMed
    1. Funke L, Dakoji S, Bredt DS. Membrane-associated guanylate kinases regulate adhesion and plasticity at cell junctions. Annu Rev Biochem (2005) 74:219–45. doi: 10.1146/annurev.biochem.74.082803.133339 - DOI - PubMed
    1. Oliva C, Escobedo P, Astorga C, Molina C, Sierralta J. Role of the maguk protein family in synapse formation and function. Dev Neurobiol (2012) 72(1):57–72. doi: 10.1002/dneu.20949 - DOI - PubMed

Publication types