. 2023 May 3:14:1163198.
doi: 10.3389/fimmu.2023.1163198. eCollection 2023.

Interleukin 36 receptor-inducible matrix metalloproteinase 13 mediates intestinal fibrosis

Affiliations

Interleukin 36 receptor-inducible matrix metalloproteinase 13 mediates intestinal fibrosis

Kristina Koop et al. Front Immunol. .

Abstract

Background: Fibrostenotic disease is a common complication in Crohn's disease (CD) patients hallmarked by transmural extracellular matrix (ECM) accumulation in the intestinal wall. The prevention and medical therapy of fibrostenotic CD is an unmet high clinical need. Although targeting IL36R signaling is a promising therapy option, downstream mediators of IL36 during inflammation and fibrosis have been incompletely understood. Candidate molecules include matrix metalloproteinases which mediate ECM turnover and are thereby potential targets for anti-fibrotic treatment. Here, we have focused on understanding the role of MMP13 during intestinal fibrosis.

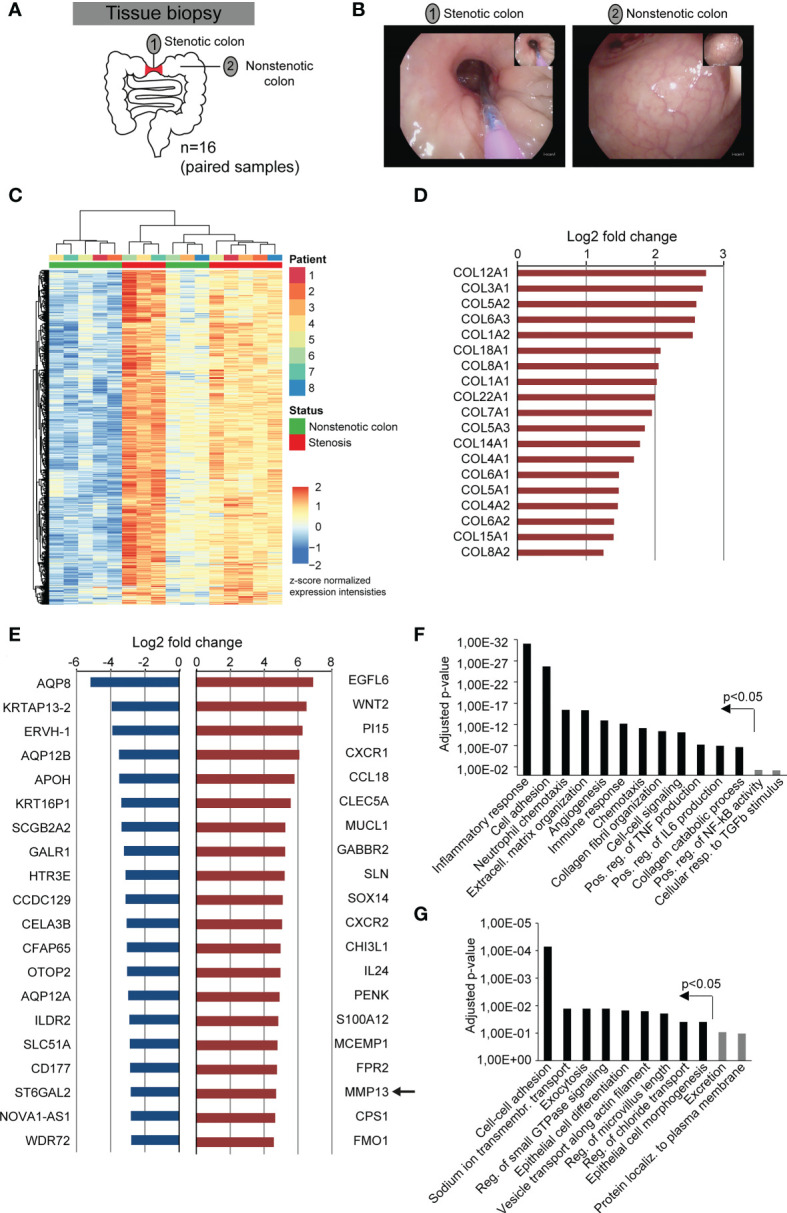
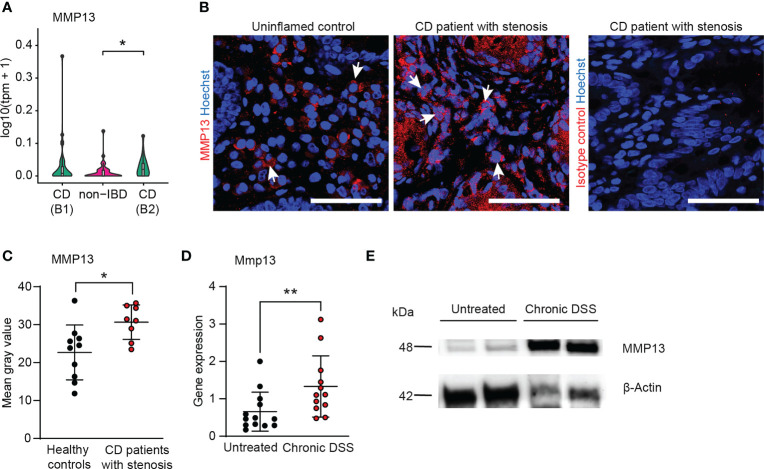
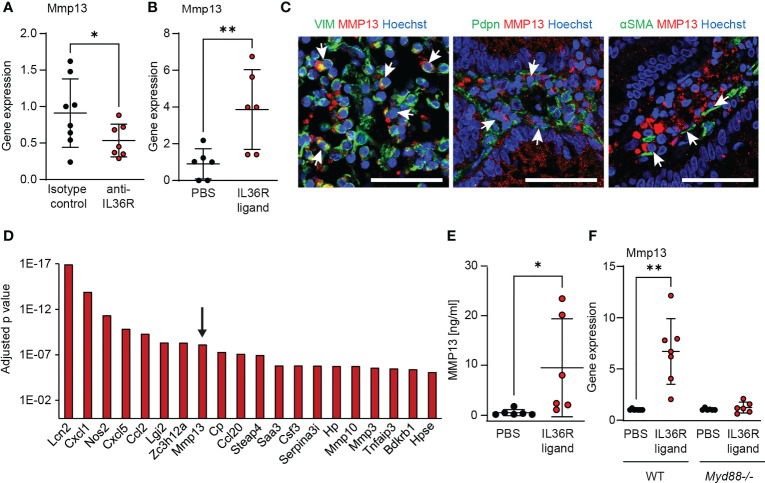
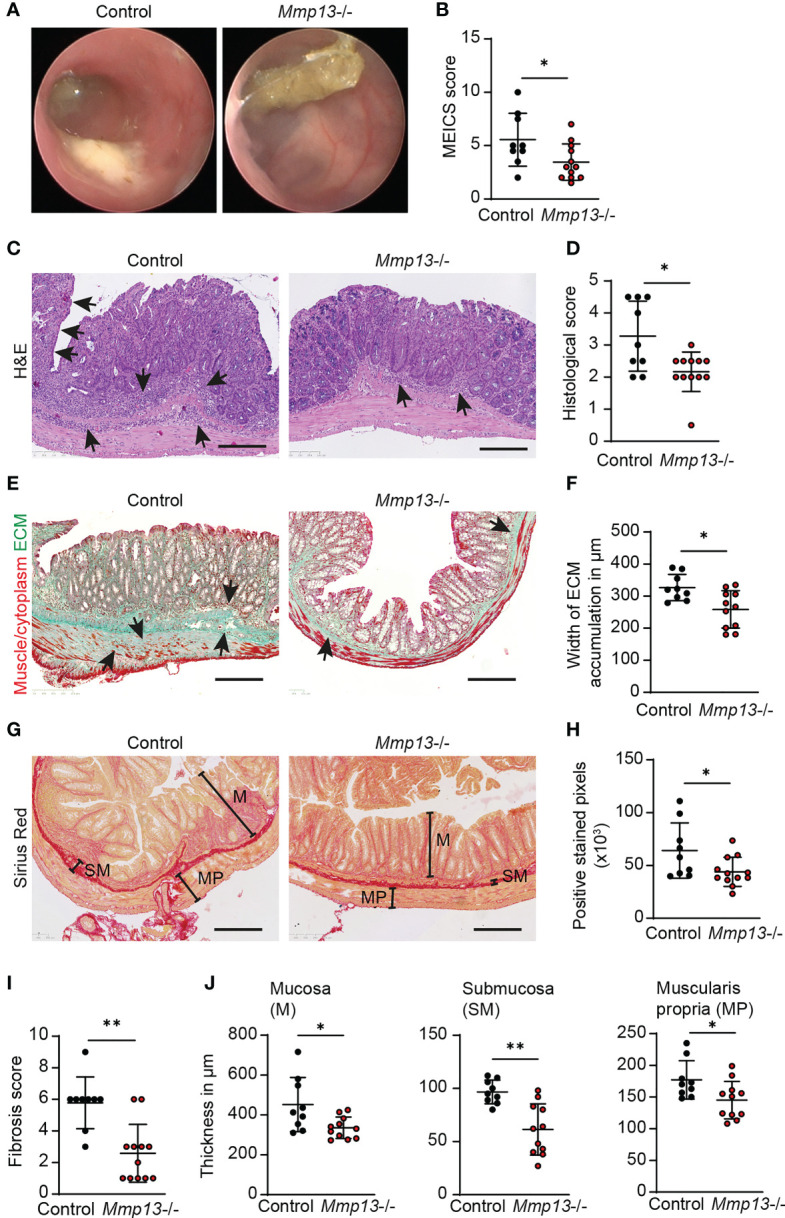
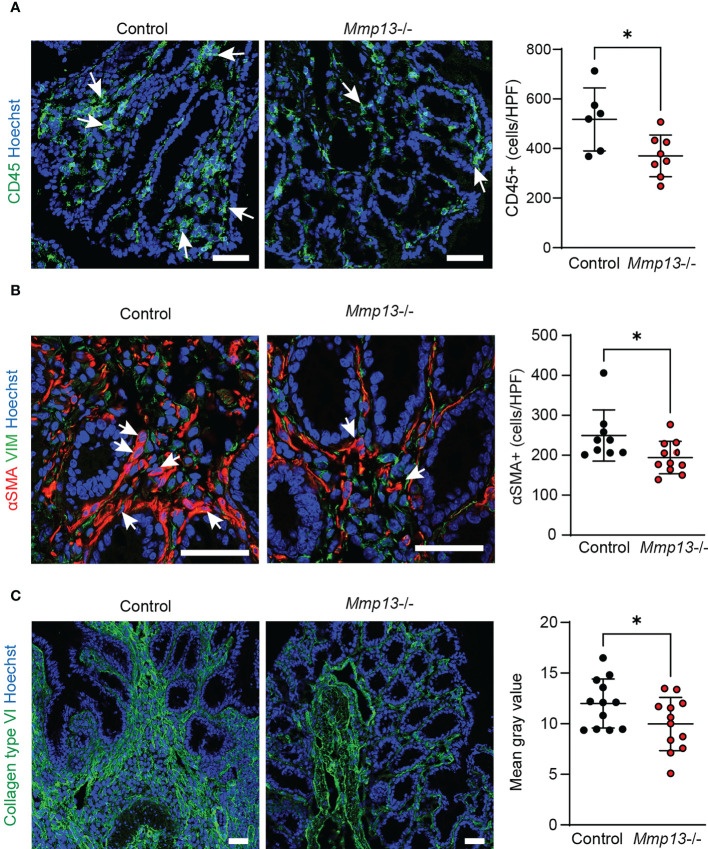
Methods: We performed bulk RNA sequencing of paired colon biopsies taken from non-stenotic and stenotic areas of patients with CD. Corresponding tissue samples from healthy controls and CD patients with stenosis were used for immunofluorescent (IF) staining. MMP13 gene expression was analyzed in cDNA of intestinal biopsies from healthy controls and in subpopulations of patients with CD in the IBDome cohort. In addition, gene regulation on RNA and protein level was studied in colon tissue and primary intestinal fibroblasts from mice upon IL36R activation or blockade. Finally, in vivo studies were performed with MMP13 deficient mice and littermate controls in an experimental model of intestinal fibrosis. Ex vivo tissue analysis included Masson's Trichrome and Sirius Red staining as well as evaluation of immune cells, fibroblasts and collagen VI by IF analysis.

Results: Bulk RNA sequencing revealed high upregulation of MMP13 in colon biopsies from stenotic areas, as compared to non-stenotic regions of patients with CD. IF analysis confirmed higher levels of MMP13 in stenotic tissue sections of CD patients and demonstrated αSMA+ and Pdpn+ fibroblasts as a major source. Mechanistic experiments demonstrated that MMP13 expression was regulated by IL36R signaling. Finally, MMP13 deficient mice, as compared to littermate controls, developed less fibrosis in the chronic DSS model and showed reduced numbers of αSMA+ fibroblasts. These findings are consistent with a model suggesting a molecular axis involving IL36R activation in gut resident fibroblasts and MMP13 expression during the pathogenesis of intestinal fibrosis.

Conclusion: Targeting IL36R-inducible MMP13 could evolve as a promising approach to interfere with the development and progression of intestinal fibrosis.

Keywords: IL-36; collagen type VI; collagenase 3; extracellular matrix (ECM); il36 receptor; intestinal fibrosis; matrix metalloproteinase 13 (MMP13); αSMA+ fibroblasts.


Conflict of interest statement

Author PB was employed by Boehringer Ingelheim Pharma GmbH & Co KG. Author JR was employed by Staburo GmbH. Author AM was employed by Boehringer Ingelheim Pharmaceuticals Inc. The remaining authors declare that the research was conducted in the absence of any commercial or financial relationships that could be construed as a potential conflict of interest.

Figures

Figure 1
Figure 1
Fibrostenotic areas of CD patients are hallmarked by the expression of genes associated with extracellular matrix remodeling and inflammation. (A) Experimental setup shows the collection of endoscopic samples from areas of stenosis and unaffected colon during routine endoscopy of 8 different CD patients. (B) Representative endoscopy pictures from a stenotic area and from normal colon of the same CD patient is shown. (C–G) Bulk RNA-sequencing was performed of samples collected as shown in (A). (C) Heatmap of gene expression with DEGs (p adj < 0.01, |log2fc| >1.5) is shown. (D) Log2 fold change of all genes encoding collagen chains that match the criteria p adj < 0.05 and |log2fc| >2 are shown. (E) 20 significantly differentially expressed genes (p adj < 0.05) with the highest downregulation and upregulation between non-stenotic and stenotic tissue of CD patients are shown. (F, G) Differentially upregulated (F) and downregulated (G) genes (p adj < 0.05, |log2fc| >1) were used for gene ontology analysis by DAVID. P-values include Benjamini-Hochberg correction.
Figure 2
Figure 2
MMP13 is highly induced in human and murine fibrosis. (A) Bulk RNA sequencing was performed from biopsies taken during routine endoscopy from patients with CD B1 (non-stricturing, non-penetrating, Montreal classification n= 45), with CD B2 (stricturing n= 22) and non-IBD controls (n= 51) within the IBDome cohort. The expression of MMP13 is depicted. (B, C) Colon tissue sections from CD patients with stenosis (IF cohort) (n= 11) and from healthy controls (n= 8) were stained by immunofluorescence for MMP13 or Isotype control. The mean gray values were assessed by Image J. Representative pictures are shown. (D) Wildtype mice received 3 cycles of DSS and animals without treatment were used as control. Gene expression in colon tissue was analyzed at day 63 by qPCR (n= 12-13 per group). (E) Protein lysates (50µg) isolated from colons of untreated wildtype animals and of mice from chronic DSS-induced colitis were used for detection of MMP13 by Western Blot. β-Actin was used as loading control. Quantitative data were analyzed with Wilcoxon-Mann-Whitney test (*p>0.05, **p>0.01, two-tailed) and mean values are shown with standard deviation. Scale bar represents 50µm.
Figure 3
Figure 3
MMP13 is produced by intestinal fibroblasts upon IL36R activation. (A) RNA was isolated from colons of wildtype animals that were treated with an anti-IL36R antibody or an isotype control antibody (each 250µg, twice a week) during chronic DSS-induced colitis. Mmp13 expression was detected by qPCR (n= 7-8 per group). (B) Wildtype animals were injected with 2µg IL36R ligand mix and the expression of Mmp13 was analyzed by qPCR in colon lysates at the next day compared to the PBS injected controls. (n= 6 per group) (C) Representative pictures from co-stainings of MMP13 with vimentin (VIM), Pdpn or αSMA of CD patients with stenosis from the IF cohort are shown. Arrows indicate double positive cells. (D) Colon fibroblasts were enriched from wildtype animals and the cells were used for stimulation with IL36R ligands (100ng/ml) or PBS as control over 9 days. Fresh stimulants were given every third day. Quadruplicates were used for bulk RNA sequencing. The adjusted p value of the 20 highest regulated genes (threshold p<0.05, log2fc>2, mean count>50) is depicted. (E) Murine colon fibroblasts were used for chronic IL36R stimulation (100ng/ml) over 7 days. New cytokines were added every 2-3 day. Supernatants were used for detection of MMP13 protein by ELISA (n= 6). (F) Colon fibroblasts were enriched from untreated wildtype and Myd88-/- mice. The cells were stimulated for 4h with IL36R ligands (100ng/ml) or PBS (n= 6-7 per group) and gene expression was detected by qPCR. Quantitative data were analyzed by unpaired t test (*p>0.05, **p>0.01, one-tailed) and mean values are shown with standard deviation in (A, B, E, F) Scale bar represents 50µm.
Figure 4
Figure 4
Mmp13 deficient mice show reduced fibrosis during experimental colitis. (A, B) Chronic DSS-induced colitis with 3 repeated cycles of DSS administration in the drinking water was performed with Mmp13-/- and heterozygous littermate controls. (A) Colonoscopy was performed at day 63 and (B) the murine endoscopic index of colitis severity (MEICS) was used to score the mucosal inflammation (n= 9-11 per group). (C, D) Distal colon sections from Mmp13-/- mice vs controls from chronic DSS colitis were used for H&E stainings. Histopathological scoring of H&E stained colon sections was performed at day 63. Arrows highlight immune cell infiltration and erosion of the IEC layer. (E, F) Sections of distal colon tissue from Mmp13-/- and controls from (A) was used for Masson’s trichrome staining. Arrows indicate the accumulation of extracellular matrix. The width of ECM accumulation reflects the thickness of the submucosa, muscularis mucosa and muscularis propria. (G, H) 3 repetitive cycles of DSS were administered to Mmp13-/- and littermate controls. Distal colon tissue of these mice was used for Sirius Red staining. Based on the Sirius Red stainings, the amount of ECM was quantified as positive stained pixels by Qupath. (I) The fibrosis scoring including the distribution of ECM within the colon wall as well as the percent involvement of the tissue was assessed from colon tissue of control vs. Mmp13-/- mice from chronic DSS colitis, that was stained with Sirius Red. (J) Colon tissue of Mmp13-/- mice and littermate controls, that was stained for Sirius Red, was used for measurement of the thickness of the mucosa (M) (maximal width), submucosa (SM), and muscularis propria (MP) as indicated in (G) Quantitative data were analyzed by with Wilcoxon-Mann-Whitney test (*p>0.05, **p>0.01, two-tailed) and mean values are shown with standard deviation. Scale bar represents 250µm.
Figure 5
Figure 5
Mmp13 deficient mice are characterized by diminished numbers of immune cells, fibroblasts and reduced deposition of collagen type VI in experimental fibrosis. Mmp13-/- mice or littermate controls were used for 3 repeated cycles of DSS administration in the drinking water followed by 14 days of recovery with water. At day 63, colon tissue was harvested and used for IF studies. (A) Immune cells were detected by staining for CD45. (n= 6-8 per group). (B) Activated fibroblasts were stained for αSMA. (n= 9-11 per group). (C) Collagen type VI was stained in colon tissue sections from Mmp13-/- vs controls (n= 7-11 per group). Quantitative data were analyzed by unpaired t test (*p>0.05, one-tailed) and mean values are shown with standard deviation. Positive cells were quantified by Qupath (A, B) and the mean gray values of collagen type VI (C) was assessed by Image J Arrows indicate positive cells. Scale bar represents 50µm.

References

    1. Lin SN, Mao R, Qian C, Bettenworth D, Wang J, Li J. Development of antifibrotic therapy for stricturing crohn’s disease: lessons from randomized trials in other fibrotic diseases. Physiol Rev (2022) 102:605–52. doi: 10.1152/physrev.00005.2021 - DOI - PMC - PubMed
    1. Cosnes J, Gower-Rousseau C, Seksik P, Cortot A. Epidemiology and natural history of inflammatory bowel diseases. Gastroenterology (2011) 140:1785–94. doi: 10.1053/j.gastro.2011.01.055 - DOI - PubMed
    1. Rieder F, Fiocchi C, Rogler G. Mechanisms, management, and treatment of fibrosis in patients with inflammatory bowel diseases. Gastroenterology (2017) 152:340–350 e6. doi: 10.1053/j.gastro.2016.09.047 - DOI - PMC - PubMed
    1. Burke JP, Mulsow JJ, O’Keane C, Docherty NG, Watson RW, O'Connell PR, et al. . Fibrogenesis in crohn’s disease. Am J Gastroenterol (2007) 102:439–48. doi: 10.1111/j.1572-0241.2006.01010.x - DOI - PubMed
    1. Lawrance IC, Rogler G, Bamias G, Breynaert C, Florholmen J, Pellino G. Cellular and molecular mediators of intestinal fibrosis. J Crohns Colitis (2017) 11:1491–503. doi: 10.1016/j.crohns.2014.09.008 - DOI - PMC - PubMed

Publication types