
Using brain cell-type-specific protein interactomes to interpret neurodevelopmental genetic signals in schizophrenia

Yu-Han H Hsu et al. iScience. .

Abstract

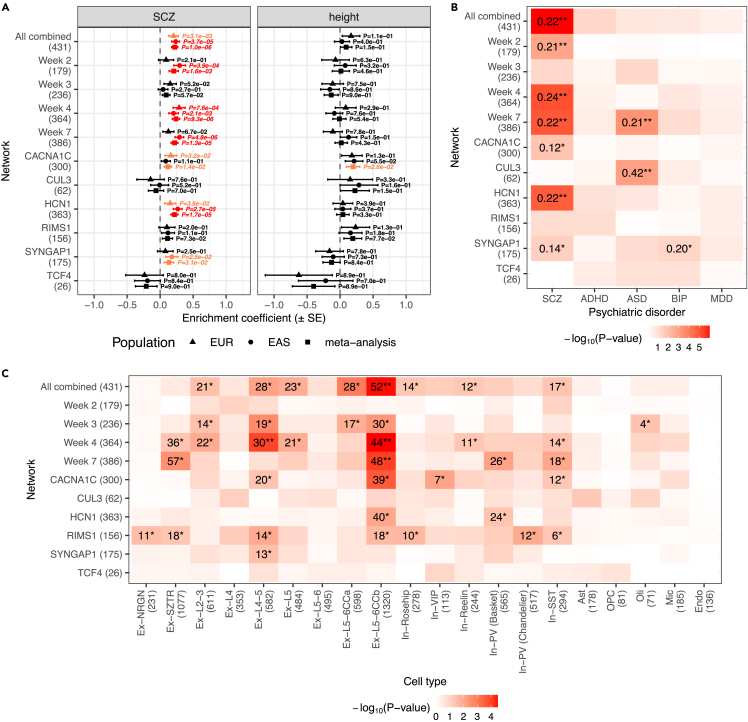
Genetics have nominated many schizophrenia risk genes and identified convergent signals between schizophrenia and neurodevelopmental disorders. However, functional interpretation of the nominated genes in the relevant brain cell types is often lacking. We executed interaction proteomics for six schizophrenia risk genes that have also been implicated in neurodevelopment in human induced cortical neurons. The resulting protein network is enriched for common variant risk of schizophrenia in Europeans and East Asians, is down-regulated in layer 5/6 cortical neurons of individuals affected by schizophrenia, and can complement fine-mapping and eQTL data to prioritize additional genes in GWAS loci. A sub-network centered on HCN1 is enriched for common variant risk and contains proteins (HCN4 and AKAP11) enriched for rare protein-truncating mutations in individuals with schizophrenia and bipolar disorder. Our findings showcase brain cell-type-specific interactomes as an organizing framework to facilitate interpretation of genetic and transcriptomic data in schizophrenia and its related disorders.

Keywords: Cellular neuroscience; Developmental neuroscience; Molecular interaction; Proteomics.


Conflict of interest statement

K.C.E. is a co-founder of Q-State Biosciences, Quralis, and Enclear, and currently employed at BioMarin Pharmaceutical. Other authors declare no competing interests.

Figures

None
Graphical abstract
Figure 1
Figure 1
Selection of schizophrenia index genes and proteins for interactome experiments (A) Three-step procedure to identify Sets 1–3 by refining schizophrenia GWAS [PGC phase 2] data, where Set 3 was defined as ‘index genes’ and used as the basis for downstream experiments. Set 3 genes are color-coded based on the type of orthogonal evidence supporting their involvement in neuropsychiatric or neurodevelopmental phenotypes. (B) Cumulative density of gnomAD pLI scores for different gene sets. ‘Genome’ indicates genes in the pLI dataset [excluding Sets 1–3]; ‘Sets 1–3’ indicate genes in Sets 1–3 with available pLI scores; ‘SCHEMA 5% FDR’ and ‘SCHEMA EWS’ indicate genes with FDR < 0.05 or 3.7e-3 [exome-wide significance] in the SCHEMA exome sequencing analysis, respectively. (C) Frontal cortex RNA expression of gene sets across ten developmental stages. Median expression and standard error [SE] of each gene set were derived from the BrainSpan exon microarray dataset. ‘Random’ indicates genes randomly sampled from the BrainSpan dataset; ‘Sets 1–3’ indicate genes in Sets 1–3 with available BrainSpan data; ‘SCHEMA’ indicates exome-wide significant genes from SCHEMA. Shaded regions indicate median expression of genes with FDR < 3.7e-3 [exome-wide significance], 0.05, 0.25, or 0.5 in SCHEMA with darker gray indicating greater significance. (D) Western blot analysis of index proteins in iPSCs, NPCs [at day 3 of differentiation], iNs [at weeks 2–7 of differentiation], three cancer cell lines [TF-1, K562, U937], HEK293 cells, and mouse cortex. SATB2 and ZNF804A are excluded from this panel due to lack of detectable expression in iNs. See also Figure S1, Data S4, and Tables S1, S2, S3, and S4.
Figure 2
Figure 2
Cell-type-specific protein interactomes in cortical human neurons (A) Scatter plot showing log2 FC correlation between replicate 1 [x-axis] and replicate 2 [y-axis] of an IP of CACNA1C at week 3 of neuron differentiation [Pearson’s r = 0.74]. (B) Volcano plot showing log2 FC [x-axis] and -log10 p-value [y-axis] of the CACNA1C IP from (A). For (A) and (B), the index protein [CACNA1C] is shown in red, significant interactors [log2 FC > 0 and FDR ≤ 0.1] in green, and non-interactors [i.e., other detected proteins] in blue. Known InWeb interactors are indicated by black border circles, with the subset that are significant in the IP highlighted in yellow [overlap p = 1.8e-2]. Calcium channel components [alpha, beta, and alpha2delta subunits] are in orange. (C) Replication rates of a subset of interactions tested in forward or reverse IPs followed by western blotting [IP-WB]. (D) Pairwise co-expression Z-scores between index genes and their interactors [Int], non-interactors [NonInt], known InWeb interactors [InWeb], and all protein-coding genes [All] derived from a spatial transcriptomic dataset in human dorsolateral prefrontal cortex. Boxes and whiskers in violin plots indicate the interquartile range [IQR] and 1.5x IQR, respectively. Double asterisks indicate p < 0.05/6 [adjusting for six pairwise comparisons] as calculated by two-tailed Wilcoxon rank-sum tests. Number of gene pairs plotted for each gene type is indicated toward the bottom. (E) The combined interaction network of six index proteins resulting from 19 individual IPs. Index proteins and their interactors are indicated as red and purple nodes, respectively. Size and color of the interactor nodes scale with the number of index proteins linked to each interactor, with larger and darker nodes representing more recurrent interactors [distribution shown in upper right pie chart]. Edges represent protein interactions with colors indicating whether each interaction is known in InWeb [blue] or potentially novel [gray; distribution shown in lower right pie chart]. See also Figures S2 and S7, Data S5 and S6, and Tables S4, S5, S6, S7, S8, S9, and S10.
Figure 3
Figure 3
Enrichment of common variant risks and transcriptional perturbations in the index protein interactomes Networks tested are the combined network of all IPs [All combined], the combined networks at each time point [Week 2 to Week 7], the combined networks for CACNA1C, HCN1, RIMS1, and SYNGAP1, and the individual IP networks for CUL3 and TCF4; the number of genes in each network is shown in parentheses on the y-axes. (A) Common variant enrichment of schizophrenia [SCZ] or height in Europeans [EUR], East Asians [EAS], or their meta-analysis. Enrichment coefficients, standard errors [SE], and p-values were calculated using MAGMA. p < 0.05 or p < 0.05/22 [adjusting for 11 networks and two ancestries] results are highlighted in orange or red, respectively. (B) Common variant enrichment of SCZ, attention deficit hyperactivity disorder [ADHD], autism spectrum disorders [ASD], bipolar disorder [BIP], or major depressive disorder [MDD] calculated using MAGMA. Cross-ancestry meta-analysis results are shown for SCZ; EUR ancestry results are shown for other disorders. Enrichment coefficients reaching p < 0.05 or p < 0.05/22 significance are shown in the heatmap followed by single or double asterisks, respectively. (C) Enrichment of cell-type-specific differentially expressed genes [DEGs] in the prefrontal cortex of schizophrenia patients compared to controls; the number of DEGs in each cell type is shown in parentheses on the x-axis. p-values were calculated using one-tailed hypergeometric tests. Gene counts in overlaps reaching p < 0.05 or p < 0.05/220 [adjusting for 11 networks and 20 cell types] significance are shown in the heatmap followed by single or double asterisks, respectively. See also Figures S8 and S9, Tables S11 and S12.
Figure 4
Figure 4
Prioritizing genes in schizophrenia GWAS loci using brain cell-type-specific interactome data (A) Social Manhattan plot of genes encoding the index proteins [red] and their interactors [purple] in genome-wide significant loci in PGC schizophrenia GWAS [phase 3]. Size of the interactor nodes and their labels scale with the number of index genes linked to each interactor; those that were also prioritized by FINEMAP or SMR analysis are highlighted in magenta. Gray lines indicate observed protein-protein interactions in our data; interactions that have been replicated by IP-WB are highlighted in blue. (B) Cumulative density of gnomAD pLI scores for different gene sets. ‘Genome’ indicates genes in the pLI dataset [excluding PGC3 genes]; ‘PGC3’ indicates genes in PGC GWAS [phase 3] loci; ‘FINEMAP’, ‘SMR’, and ‘Network’ indicate PGC3 genes prioritized by FINEMAP, SMR, or our interactome data, respectively; ‘Overlap’ indicates genes overlapping between Network and FINEMAP or SMR; ‘SCHEMA 5% FDR’ and ‘SCHEMA EWS’ indicate genes with FDR < 0.05 or 3.7e-3 [exome-wide significance] in SCHEMA, respectively. (C) Frontal cortex RNA expression of gene sets across ten developmental stages. Median expression and standard error [SE] of each gene set were derived from the BrainSpan exon microarray dataset. ‘Random’ indicates genes randomly sampled from the BrainSpan dataset; ‘PGC3’, ‘FINEMAP’, ‘SMR’, ‘Network’, and ‘Overlap’ indicate gene sets as described in (B); ‘SCHEMA’ indicates exome-wide significant genes from SCHEMA. Shaded regions indicate median expression of genes with FDR < 3.7e-3 [exome-wide significance], 0.05, 0.25, or 0.5 in SCHEMA with darker gray indicating greater significance. (D) Western blot analysis on independent IPs of index proteins [named on the top] to detect the presence of selected locus proteins [named on the side of each gel]. Green and red circles at the bottom represented whether the tested interaction was significant or non-significant by IP-MS, respectively. Each lane represents 10% of the IP material analyzed by IP-MS. L = ladder. Molecular weights are in KDa. See also Figure S10 and Table S13.

References

    1. Charlson F.J., Ferrari A.J., Santomauro D.F., Diminic S., Stockings E., Scott J.G., McGrath J.J., Whiteford H.A. Global epidemiology and burden of schizophrenia: findings from the global burden of disease study 2016. Schizophr. Bull. 2018;44:1195–1203. doi: 10.1093/schbul/sby058. - DOI - PMC - PubMed
    1. GBD 2017 Disease and Injury Incidence and Prevalence Collaborators Global, regional, and national incidence, prevalence, and years lived with disability for 354 diseases and injuries for 195 countries and territories, 1990-2017: a systematic analysis for the Global Burden of Disease Study 2017. 2018;392:1789–1858. doi: 10.1016/S0140-6736(18)32279-7. - DOI - PMC - PubMed
    1. Schizophrenia Working Group of the Psychiatric Genomics Consortium Biological insights from 108 schizophrenia-associated genetic loci. Nature. 2014;511:421–427. doi: 10.1038/nature13595. - DOI - PMC - PubMed
    1. Genovese G., Fromer M., Stahl E.A., Ruderfer D.M., Chambert K., Landén M., Moran J.L., Purcell S.M., Sklar P., Sullivan P.F., et al. Increased burden of ultra-rare protein-altering variants among 4,877 individuals with schizophrenia. Nat. Neurosci. 2016;19:1433–1441. doi: 10.1038/nn.4402. - DOI - PMC - PubMed
    1. Marshall C.R., Howrigan D.P., Merico D., Thiruvahindrapuram B., Wu W., Greer D.S., Antaki D., Shetty A., Holmans P.A., Pinto D., et al. Contribution of copy number variants to schizophrenia from a genome-wide study of 41,321 subjects. Nat. Genet. 2017;49:27–35. doi: 10.1038/ng.3725. - DOI - PMC - PubMed

LinkOut - more resources