. 2023 May 19;14(1):2882.
doi: 10.1038/s41467-023-38541-2.

Characterisation of IL-23 receptor antagonists and disease relevant mutants using fluorescent probes

Affiliations

Characterisation of IL-23 receptor antagonists and disease relevant mutants using fluorescent probes

Charles S Lay et al. Nat Commun. .

Abstract

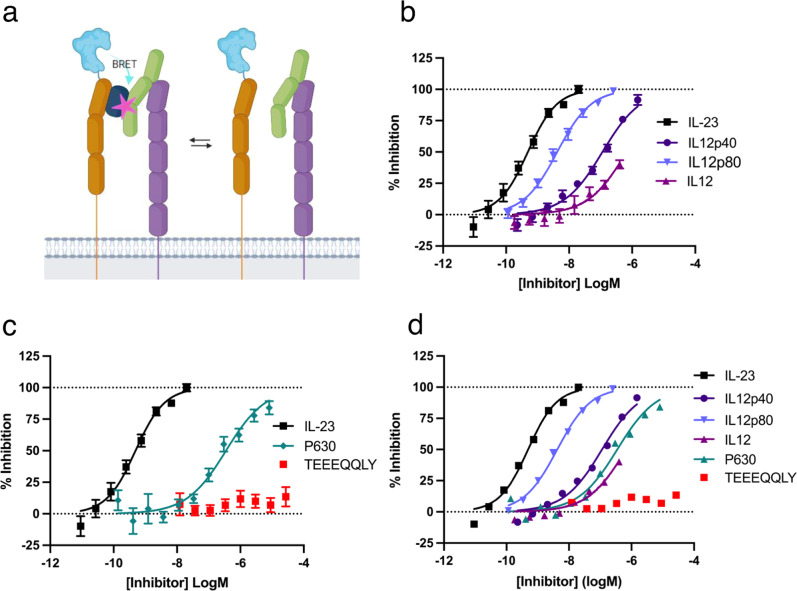
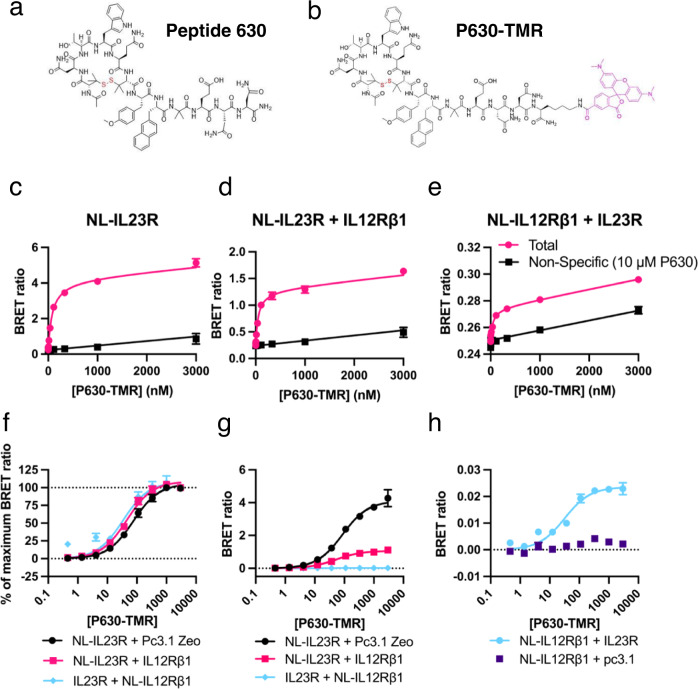
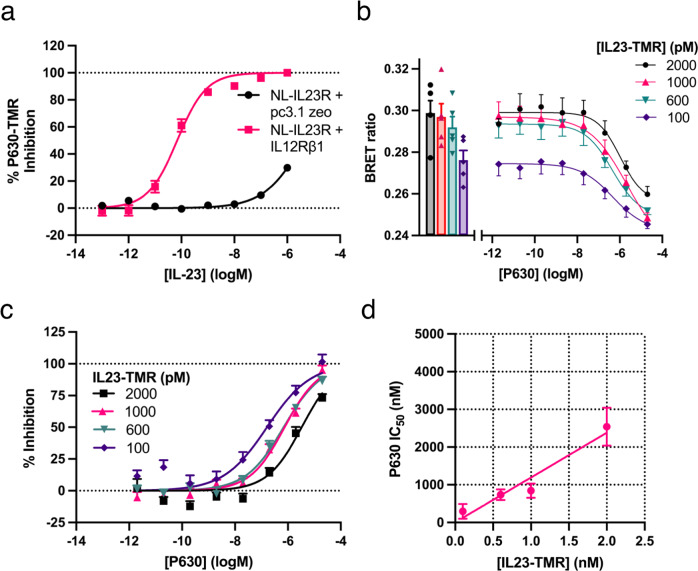
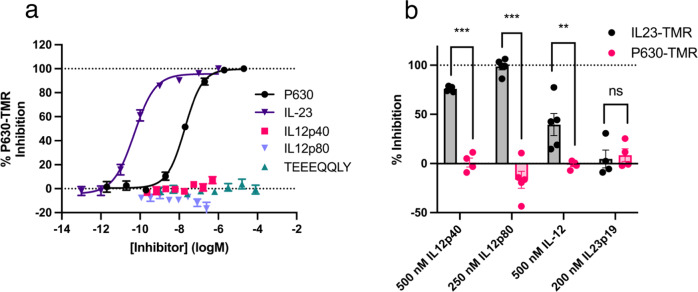
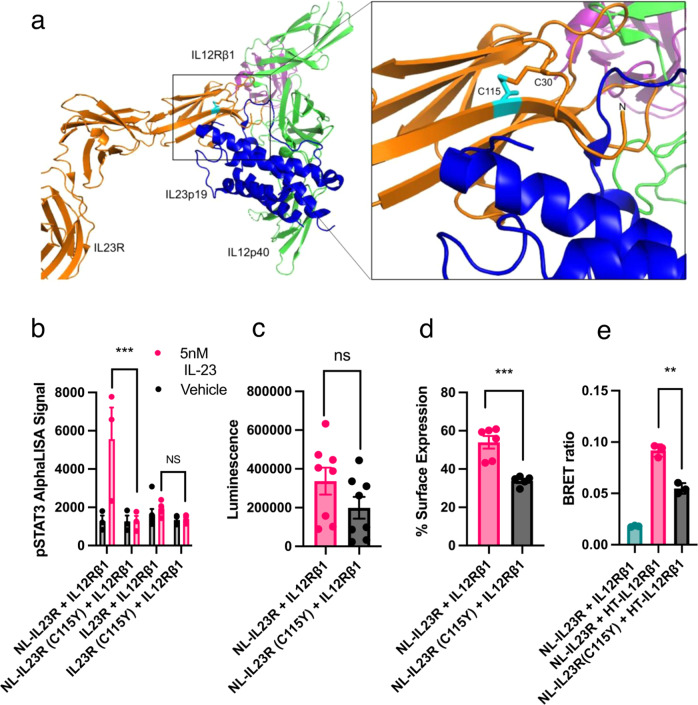
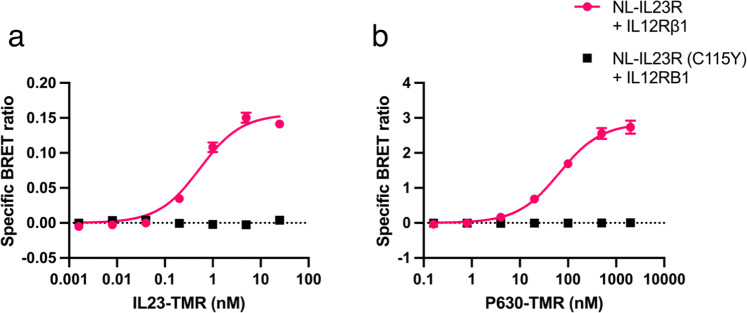
Association of single nucleotide polymorphisms in the IL-23 receptor with several auto-inflammatory diseases, led to the heterodimeric receptor and its cytokine-ligand IL-23, becoming important drug targets. Successful antibody-based therapies directed against the cytokine have been licenced and a class of small peptide antagonists of the receptor have entered clinical trials. These peptide antagonists may offer therapeutic advantages over existing anti-IL-23 therapies, but little is known about their molecular pharmacology. In this study, we use a fluorescent version of IL-23 to characterise antagonists of the full-length receptor expressed by living cells using a NanoBRET competition assay. We then develop a cyclic peptide fluorescent probe, specific to the IL23p19:IL23R interface and use this molecule to characterise further receptor antagonists. Finally, we use the assays to study the immunocompromising C115Y IL23R mutation, demonstrating that the mechanism of action is a disruption of the binding epitope for IL23p19.


Conflict of interest statement

P.D.C. and A.I.L. are employees of GSK. The remaining authors declare no competing interests.

Figures

Fig. 1
Fig. 1. Using IL23-TMR to characterise IL-23 receptor antagonists.
a A schematic demonstrated the principles of the BRET competition assay using IL12p40 as an example. Schematic created with Biorender.com. IL23R is shown in orange, IL12Rβ1 in purple, IL23p19 in blue, IL12p40 in green and the presence of a TAMRA fluorophore by a pink star. The competitive inhibition of the binding of 300 pM IL23-TMR by increasing concentrations of (b) endogenously produced IL-12p40 containing proteins and (c) synthetic IL-23 receptor antagonists with previously generated IL-23 competition data for comparison. d The combined data from b and c plotted without error bars. In b and c, data are mean ± SEM from 5 independent experiments conducted in either duplicate or triplicate. Details on absolute number of data points included for each concentration are provided in the associated Source Data file. Ki values obtained in the 5 independent experiments are shown in Table 2.
Fig. 2
Fig. 2. Creation and characterisation of a fluorescent cyclic peptide probe for IL23R.
The chemical structures of (a) P630 and (b) P630-TMR. The BRET ratio measured when increasing concentrations of P630-TMR were applied to cells expressing (c) NL-IL23R alone, (d) NL-IL23R with IL12Rβ1 or (e) NL- IL12Rβ1 and IL23R in the presence or absence of 10 μM P630. f The data shown in ce normalised to % maximum BRET ratio. g The BRET data shown in ce with non-specific binding subtracted. h The specific binding of P630-TMR to cells expressing NL- IL12Rβ1 in the presence or absence of IL23R. Data are normally mean ± SEM from five independent experiments. Details on absolute number of data points included for each concentration are provided in the associated Source Data file. In each individual saturation experiment triplicate determinations were normally made for total binding and duplicate measurements were made for non-specific binding. Kd values obtained in the 5 independent experiments are shown in Table 2.
Fig. 3
Fig. 3. P630-TMR binding to binary NanoBiT IL-23 receptor complexes.
a A schematic depicting the NanoBiT assay methodology, with IL23R shown in orange and IL12Rβ1 shown in purple. Schematic created with Biorender.com. b The BRET ratio generated when increasing concentrations of P630-TMR were applied to cells expressing NanoBiT complemented receptors. c The effect of P630 on NanoLuc complementation and hence receptor dimerisation. d The data from (b) normalised to % of P630-TMR specific Bmax and plotted with data generated in Fig. 2d, e for reference. Data in b are mean ± SEM from three independent experiments. In each individual experiment, triplicate determinations were made for total binding and duplicate or triplicate determinations made for non-specific binding. Data in c are the mean values obtained in five independent experiments, each conducted with six replicates. Ns no significant difference (two-tailed, paired t test of the paired mean values obtained in each experiment; p = >0.05). Data in d are the mean ± SEM from five (NL-IL23R and NL-23R + IL12Rβ1) or three (HiBit-IL23R + LgBit-IL12Rβ1) independent experiments. Source data are provided as a Source Data file.
Fig. 4
Fig. 4. The displacement of P630-TMR by IL-23 is dependent on the co-expression of IL12Rβ1 with IL23R.
a The displacement of 75 nM P630-TMR by increasing concentrations of IL-23 from cells expressing NL-IL23R in the presence or absence of IL12Rβ1. b The displacement of different concentrations of IL23-TMR by increasing concentrations of P630. c The data shown in b normalised to % inhibition (total inhibition was defined by an excess of IL-23). d The relationship between P630 IC50 determined in c and the concentration of IL23-TMR used. Data are mean ± SEM from four (a: NL-IL23R + pc3.1 zeo) or five independent experiments performed in triplicate. In b the bars show the mean values obtained in each of five independent experiments and the data points show the mean ± SEM of the values obtained in the five independent experiments. Source data are provided as a Source Data file.
Fig. 5
Fig. 5. P630-TMR measures antagonism at the IL23R/IL23p19 interface.
a The displacement of 75 nM P630-TMR by increasing concentrations of various IL-23 receptor binders. b The displacement of either 75 nM P630-TMR or 300 pM IL23-TMR by a single concentration of several antagonists. Data in a are mean ± SEM from three (TEEEQQLY), four (P630, IL12p40) or five (IL-23, IL12p80) independent experiments performed in triplicate. Data in b are mean ± SEM from five independent experiments performed in triplicate apart from 200 nM IL23p19 (4 experiments) and 500 nM IL12p40 with P630-TMR (4 experiments). In b statistical analysis (two-tailed, non-paired, t-test) was performed on the mean values obtained in each independent experiment. ** indicates a statistical significance of p < 0.01. *** indicates a statistical significance of p < 0.001. Absolute p values in b were 0.000001 (IL-12p40), 0.000002 (IL12p80), 0.0069 (IL12) and 0.74 (IL23p19). Source data are provided as a Source Data file.
Fig. 6
Fig. 6. A single nucleotide polymorphism linked to immunodeficiency blocks binding of IL23-TMR and P630-TMR.
a Left: Crystal structure of N-terminal domains 1–3 of IL23R (orange) in complex with IL-23 (IL23p19 = blue, IL12p40 = green) and the N-terminal domain of IL12Rβ1 (PDB: 6WDQ). Right: The interface between IL23R and IL23p19 with C115 coloured cyan. b The phospho-STAT3 signal generated when cells expressing different constructs were treated with 5 nM IL-23. Data are mean ± SEM from five or six (untagged) or three (NanoLuc tagged) independent experiments conducted in triplicate. For the IL23R + IL12Rβ1 data set, one outlier (11108.7) was detected using the Grubbs test (with alpha = 0.001) and removed from the statistical analysis. Statistical significance of the C115Y mutation on the alphaLISA data was assessed using a 2-way ANOVA with Tukey’s multiple comparison test. ***p < 0.001. The p value for the comparison of NL tagged construct response was 0.0001 and the p value for the comparison of untagged receptor was 0.951. c Luminescence signal measured when IL12Rβ1 was expressed with either NL-IL23R or the C115Y mutant. Data are mean ± SEM generated from the mean luminescence values of seven (C115Y) or eight independent experiments performed in pentuplicate. d The proportion of luminescence from c that emanated from extracellular protein (as defined by the reduction in luminescence after treatment with 60 μM NanoLuc extracellular inhibitor). Data are mean ± SEM generated from the mean luminescence values of five (C115Y) or six independent experiments performed in triplicate. e The BRET ratio generated from HaloTag-618 labelled cells expressing NL tagged wildtype or C115Y IL23R with HT-IL12Rβ1 or unlabelled IL12Rβ1. Data are mean ± SEM generated from the mean BRET values of three independent experiments performed in pentuplicate. Statistical significance of differences in mean values shown in ce were measured using a 2-sided, non-paired t test with ** indicating a p value of <0.005 and *** indicating a p value of <0.0005. The p values for the results shown in c, d and e were p = 0.148, 0.0005 and 0.0013 respectively. Source data are provided as a Source Data file.
Fig. 7
Fig. 7. Effect of C115Y on the binding of IL23-TMR and P630-TMR.
BRET ratio generated when increasing concentrations of (a) IL23-TMR or (b) P630-TMR were applied to cells expressing wildtype (pink) or C115Y (black) mutant receptor. Data are mean ± SEM from five (C115Y) or four (wildtype) independent experiments conducted in duplicate or triplicate. Details on absolute number of data points included for each concentration are provided in the associated Source Data file.

References

    1. Liongue C, Sertori R, Ward AC. Evolution of cytokine receptor signaling. J. Immunol. 2016;197:11–18. doi: 10.4049/jimmunol.1600372. - DOI - PubMed
    1. Morris R, Kershaw NJ, Babon JJ. The molecular details of cytokine signaling via the JAK/STAT pathway. Protein Sci. 2018;27:1984–2009. doi: 10.1002/pro.3519. - DOI - PMC - PubMed
    1. Oh CK, Geba GP, Molfino N. Investigational therapeutics targeting the IL-4/IL-13/STAT-6 pathway for the treatment of asthma. Eur. Respir. Rev. 2010;19:46–54. doi: 10.1183/09059180.00007609. - DOI - PMC - PubMed
    1. Hassani M, Koenderman L. Immunological and hematological effects of IL-5(Rα)-targeted therapy: An overview. Allergy.: Eur. J. Allergy. Clin. Immunol. 2018;73:1979–1988. doi: 10.1111/all.13451. - DOI - PMC - PubMed
    1. Jones SA, Jenkins BJ. Recent insights into targeting the IL-6 cytokine family in inflammatory diseases and cancer. Nat. Rev. Immunol. 2018;18:773–789. doi: 10.1038/s41577-018-0066-7. - DOI - PubMed

Publication types

MeSH terms