. 2023 May 19;14(1):2859.
doi: 10.1038/s41467-023-38605-3.

ERK and USP5 govern PD-1 homeostasis via deubiquitination to modulate tumor immunotherapy

Affiliations

ERK and USP5 govern PD-1 homeostasis via deubiquitination to modulate tumor immunotherapy

Xiangling Xiao et al. Nat Commun. .

Erratum in

Abstract

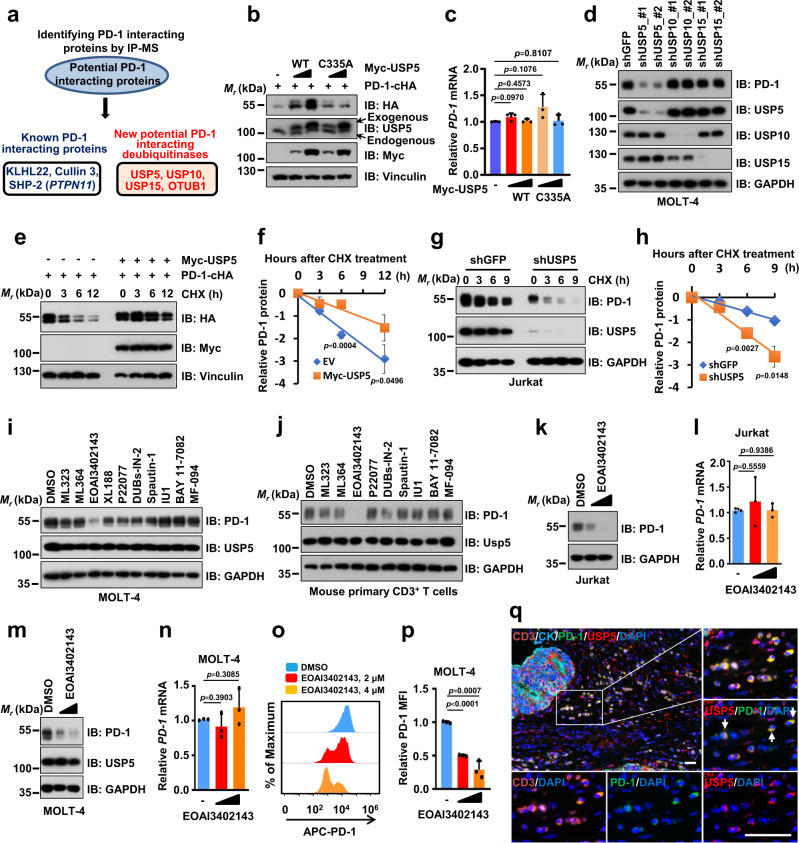
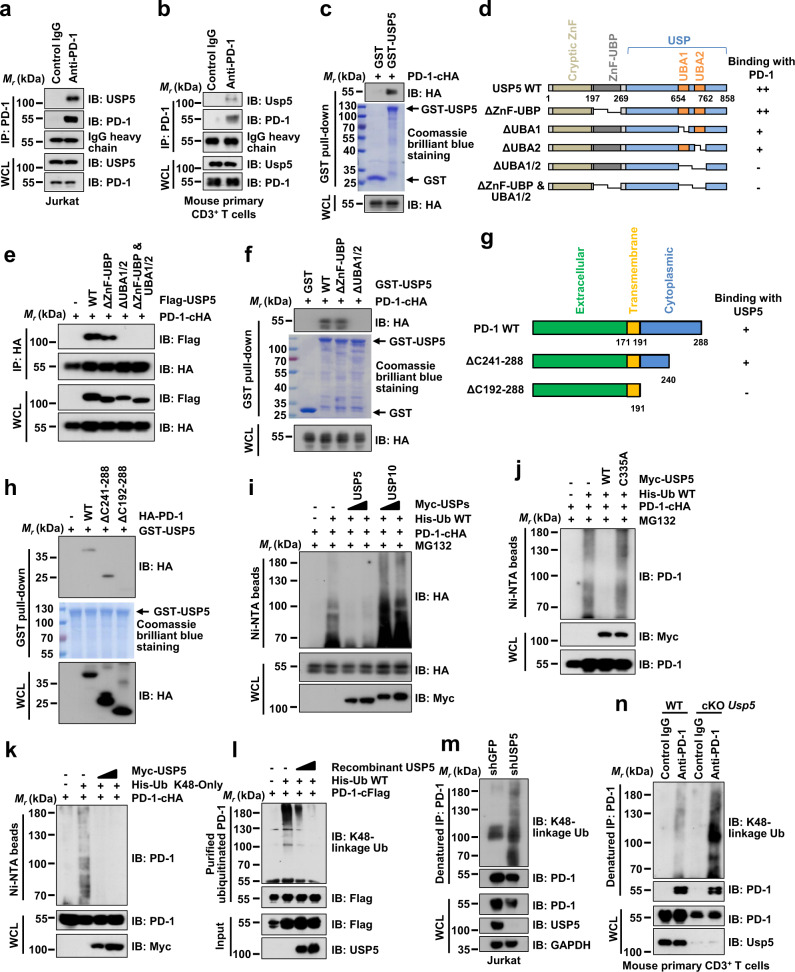
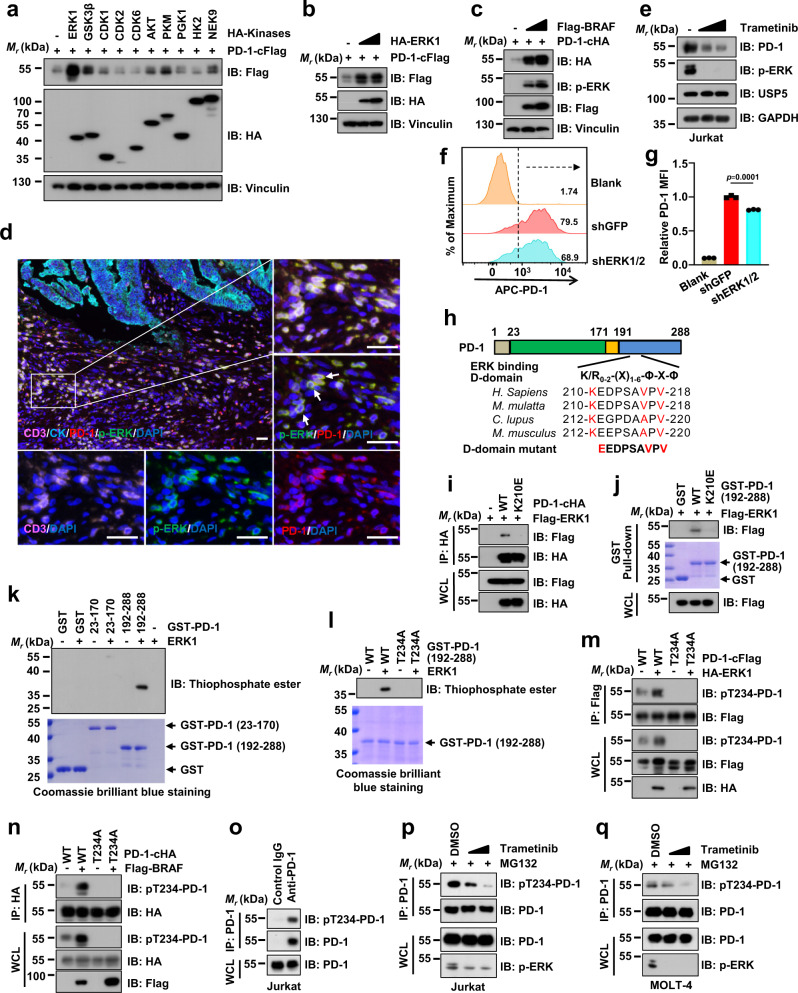
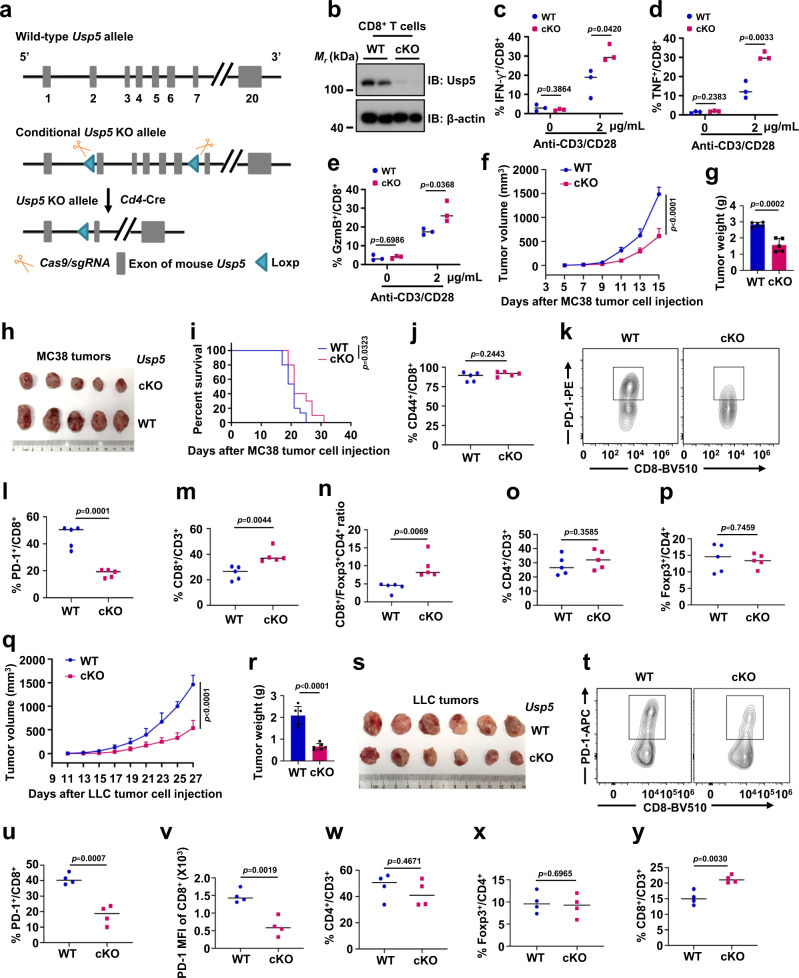
The programmed cell death protein 1 (PD-1) is an inhibitory receptor on T cells and plays an important role in promoting cancer immune evasion. While ubiquitin E3 ligases regulating PD-1 stability have been reported, deubiquitinases governing PD-1 homeostasis to modulate tumor immunotherapy remain unknown. Here, we identify the ubiquitin-specific protease 5 (USP5) as a bona fide deubiquitinase for PD-1. Mechanistically, USP5 interacts with PD-1, leading to deubiquitination and stabilization of PD-1. Moreover, extracellular signal-regulated kinase (ERK) phosphorylates PD-1 at Thr234 and promotes PD-1 interaction with USP5. Conditional knockout of Usp5 in T cells increases the production of effector cytokines and retards tumor growth in mice. USP5 inhibition in combination with Trametinib or anti-CTLA-4 has an additive effect on suppressing tumor growth in mice. Together, this study describes a molecular mechanism of ERK/USP5-mediated regulation of PD-1 and identifies potential combinatorial therapeutic strategies for enhancing anti-tumor efficacy.


Conflict of interest statement

G.J.F. has patents/pending royalties on the PD-1/PD-L1 pathway from Roche, Merck MSD, Bristol-Myers-Squibb, Merck KGA, Boehringer-Ingelheim, AstraZeneca, Dako, Leica, Mayo Clinic, Eli Lilly, and Novartis. G.J.F. has served on advisory boards for Roche, Bristol-Myers-Squibb, Xios, Origimed, Triursus, iTeos, NextPoint, IgM, Jubilant, Trillium, GV20, IOME, and Geode. G.J.F. has equity in Nextpoint, Triursus, Xios, iTeos, IgM, GV20, Invaria, and Geode. W.W. is a co-founder and consultant for ReKindle Therapeutics. The remaining authors declare no other competing interests.

Figures

Fig. 1
Fig. 1. Identifying the deubiquitinase USP5 as a positive regulator for PD-1.
a Immunoprecipitation (IP) coupled with mass spectrometry (MS) analysis to identify potential PD-1-interacting protein including indicated deubiquitinases. Potential PD-1-interacting proteins purified from HEK293T cells transfected with pcDNA3.1-PD-1-cHA were analyzed by MS. All proteins were identified in Supplementary Data 1. bd Immunoblotting (IB) analysis of whole-cell lysates (WCL) from HEK293T cells co-transfected with indicated constructs (b) or MOLT-4 cells stably expressing shUSP5, shUSP10, shUSP15 or shGFP (d). The mRNA level of PD-1 was measured using quantitative reverse transcription PCR (qRT-PCR) (c). eh IB analysis of WCL from HEK293T cells transfected with indicated constructs (e) or Jurkat cells stably expressing shUSP5 as well as shGFP (g). Cells were treated with 200 μg/mL cycloheximide (CHX) for indicated time points. PD-1 band intensity was quantified by Image J, which was normalized to Vinculin/GAPDH and then compared to the t = 0 time point (f, h). i, j IB analysis of WCL from MOLT-4 cells (i) or mouse primary CD3+ T cells (j) treated with indicated deubiquitinase inhibitors (1.5 μM) for 8 h. Mouse primary CD3+ T cells were pre-stimulated with anti-CD3/CD28 (2 μg/mL) for 48 h. kn IB analysis of WCL from Jukat or MOLT-4 cells treated with EOAI3402143 (1 or 1.5 μM) for 8 h (k, m). The mRNA level of PD-1 was measured using qRT-PCR (l, n). o, p Cell surface PD-1(o) and relative mean fluorescence intensity (MFI) of PD-1 (p) on MOLT-4 cells was analyzed by flow cytometry. q Representative multiplex immunohistochemistry (mIHC) images of USP5 (red), PD-1 (green), CD3 (Orange), CK (cyan), and DAPI nuclear staining (blue) in human colon tumor sections. White arrows indicate positive cells for PD-1 and USP5 colocalization. Yellow color is considered overlapping for PD-1 and USP5 staining. n = 5. Scale bars, 50 μm. For g, k, Jurkat cells were stimulated with PHA (150 ng/mL) for 3 days. For c, f, h, l, n, and p, data were presented as mean ± S.D. n = 3 biologically independent samples. Two-tailed unpaired t-test. All IB data are representative of three independent experiments. Source data are provided as a Source data file.
Fig. 2
Fig. 2. USP5 interacts with PD-1 and deubiquitinates PD-1.
ac IB analysis of WCL and anti-PD-1 IPs derived from Jurkat cells (a), mouse primary CD3+ T cells (b), or glutathione S-transferase (GST) pull-down precipitates from HEK293T cell lysates with ectopic expression of PD-1-cHA incubated with recombinant GST or GST-USP5 protein (c). Jurkat cells were stimulated with PHA (150 ng/mL) for 3 days. Mouse primary CD3+ T cells were stimulated with anti-CD3/CD28 (2 μg/mL) for 48 h. d, g A schematic illustration of USP5 (d) or PD-1 (g) protein sequence to show its different domains and deletion truncations we generated. e, f, h IB analysis of WCL and anti-HA IPs (e) or GST pull-down precipitates (f, h) from HEK293T cell lysates co-transfected with indicated constructs. ik IB analysis of WCL and Ni-NTA pull-down products derived from lysates of HEK293T cells transfected with the indicated constructs. Cells were treated with 10 μM MG132 for 12 h before harvesting. l For in vitro deubiquitination assay, HEK293T cells transfected with His-ubiquitin and PD-1-cFlag were treated with 10 μM MG132 for 12 h. Ubiquitinated PD-1 was purified with IP using anti-Flag beads and was incubated without or with purified recombinant USP5. IB analysis with indicated antibodies. m IB analysis of WCL and anti-PD-1 denatured-IPs derived from lysates of shGFP- or shUSP5-treated Jurkat cells using indicated antibodies. Cells were treated with PHA (150 ng/mL) for 3 days and 5 μM MG132 for 6 h. n IB analysis of WCL and anti-PD-1 denatured-IPs derived from naive CD3+ T cells isolated from spleens of Usp5fl/fl (WT) or Usp5fl/fl Cd4-Cre (cKO) mice. CD3+ T cells were stimulated with anti-CD3/CD28 (2 μg/mL) for 48 h and with 5 μM MG132 for 4 h before harvesting. All data are representative of two independent experiments. Source data are provided as a Source data file.
Fig. 3
Fig. 3. ERK phosphorylates PD-1 at Thr234 to stabilize PD-1.
ac IB analysis of WCL derived from HEK293T cells co-transfected PD-1-cFlag or PD-1-cHA with different kinases as indicated. d Representative mIHC images of CD3 (pink), PD-1 (red), phosphor-ERK at Thr202/Try204 (p-ERK, green), CK (cyan), and DAPI nuclear staining (blue) in human colon tumor sections. White arrows indicate positive cells for PD-1 and p-ERK colocalization. Yellow color is considered overlapping for PD-1 and p-ERK staining. n = 5. Scale bars, 50 μm. e IB analysis of WCL derived from Jurkat cells treated with PHA (150 ng/mL) for 3 days and Trametinib (1 or 3 μM) for 24 h before harvesting. f, g Cell surface PD-1 on shGFP- or shERK1/2-treated Jurkat cells with pre-stimulation of PHA (150 ng/mL) for 3 days was analyzed by flow cytometry (f). The relative mean fluorescence intensity (MFI) of PD-1 on the surface of was quantified (g). Data were presented as mean ± S.D. n = 3 biologically independent samples per group. Two-tailed unpaired t-test. h A schematic illustration and sequence alignment of a potential ERK binding D-domain on PD-1 protein sequence, (K/R)0-2-(X)1-6-Φ-X-Φ, where Φ is a hydrophobic residue and X is any amino acid. i, j IB analysis of WCL and anti-HA IPs (i) or GST pull-down precipitates (i) from HEK293T cell lysates transfected with indicated constructs. k, l In vitro phosphorylation assays of bacterially purified recombinant GST, GST-PD-1 truncations or T234A mutant by ERK1 kinase. m, n IB analysis of WCL and anti-Flag or anti-HA IPs derived from HEK293T cells transfected with indicated constructs. oq IB analysis of WCL and anti-PD-1 IPs from Jurkat pre-treated with PHA (150 ng/mL) for 3 days (o, p) or MOLT-4 (q) cells. Cells were treated with indicated Trametinib (0.5 or 1 μM) for 24 h (p, q). All IB data are representative of two independent experiments. Source data are provided as a Source data file.
Fig. 4
Fig. 4. ERK-mediated Thr234 phosphorylation of PD-1 promotes its interaction with USP5.
ac IB analysis of WCL and IPs from HEK293T cells transfected with indicated constructs. Cells were treated with 10 μM MG132 for 12 h. d, e IB analysis of WCL and anti-HA IPs from HEK293T cells transfected with indicated constructs (d) or anti-PD-1 IPs derived from MOTL-4 cells (e). Cells were treated with indicated Trametinib (0.5 or 1 μM) for 24 h and 10 μM MG132 for 12 h (d) or 4 h (e). f IB analysis of WCL and GST pull-down precipitates from HEK293T cell lysates with ectopic expression of PD-1-cHA incubated with recombinant GST-USP5 protein. Cells were treated with 1 μM Ulixertinib for 24 h. g IB analysis of WCL and anti-HA IPs from HEK293T cells transfected with indicted USP5, PD-1 WT, or T234A mutant. Cells were treated with 10 μM MG132 for 12 h. h IB analysis of WCL and GST pull-down precipitates from HEK293T cell lysates with ectopic expression of PD-1-cHA WT or PD-1-cHA T234A incubated with bacterially purified recombinant GST-USP5 protein. i Bacterially purified recombinant GST-PD-1 (192-288) WT or T234A mutant was phosphorylated by ERK1 in vitro. Subsequently, GST pull-down assay was performed with purified recombinant His-USP5. IB analysis with indicated antibodies. j, k 3 μg of indicated biotin-labeled synthetic PD-1 peptides were incubated with 4 μg purified recombinant GST-USP5 (j) or different domains (k), respectively. Streptavidin beads were added to perform pull-down assays and precipitations were analyzed with IB as indicated. Dot blot was used to identify biotin-labeled synthetic PD-1 peptides. l, m IB analysis of WCL and Ni-NTA pull-down products from lysates of HEK293T cells transfected with the indicated constructs and treated with/without Trametinib (1 or 3 μM) for 12 h (l). Cells were treated with 10 μM MG132 for 12 h. n IB analysis of WCL and anti-PD-1 denatured-IPs from lysates of shGFP- or shERK1/2-treated Jurkat cells using indicated antibodies. Cells were pre-treated with PHA (150 ng/mL) for 3 days and 5 μM MG132 for 6 h. All data are representative of two independent experiments. Source data are provided as a Source data file.
Fig. 5
Fig. 5. Usp5 conditional knockout (cKO) mice have effective tumor control.
a Conditional knockout strategy of Usp5fl/flCd4-Cre (cKO) mice. b Protein levels of Usp5 in WT or cKO CD8+ T cells of spleens. ce The production of IFN-γ, TNF, or GzmB in WT and cKO CD8+ T cells with anti-CD3/CD28 (0 or 2 μg/mL) stimulation for 96 h and Brefeldin A (BFA, 5 μg/mL) treatment for 5 h. n = 3 biologically independent samples. fi The growth of subcutaneous MC38 tumors and survival of WT or cKO mice. Tumor growth was measured every 2 days and plotted (f). Endpoint tumor weight (g) and images (h) of MC38 tumors. Kaplan–Meier survival curves for WT and cKO mice bearing MC38 tumors (i). Data were presented as mean ± S.D. n = 5 mice per group (f, g). Two-way ANOVA for (f). For i, WT = 15 mice, cKO = 10 mice, log-rank test. jl Quantification of CD44+/CD8+ T cells (j) or cellular surface PD-1 on CD8+ T cells (k, l) in subcutaneous MC38 tumors derived from WT or cKO mice. n = 5 mice per group. mp Quantification of CD8+/CD3+ T cells (m), CD8+/Foxp3+CD4+ T cells (n), CD4+/CD3+ T cells (o), or Foxp3+/CD4+ T cells (p) in subcutaneous MC38 tumors derived from WT or cKO mice. n = 5 mice per group. qs The growth of subcutaneous LLC tumors in WT or cKO mice. Tumor growth was measured every 2 days and plotted (q). Endpoint tumor weight (r) and images (s) of LLC tumors. n = 6 mice per group. Data were presented as mean ± S.D. Two-way ANOVA for (q). tv Flow cytometry analysis of cellular surface PD-1 on CD8+ T cells in subcutaneous LLC tumors from WT or cKO mice (tv). Quantification of CD4+/CD3+ T cells (w), Foxp3+/CD4+ T cells (x), or CD8+/CD3+ T cells (y) in subcutaneous LLC tumors derived from WT or cKO mice. n = 4 mice per group. For ce, g, j, lp, r, uy, data were presented as mean ± S.D. Two-tailed unpaired t-test. For b, data are representative of two independent experiments. Source data are provided as a Source data file.
Fig. 6
Fig. 6. USP5 inhibition combination with Trametinib or CTLA-4 blockade has an additive effect on suppressing tumor growth.
a A schematic treatment plan for immunocompetent BALB/c mice bearing subcutaneous CT26 tumors. Mice were subcutaneously implanted with 1.5 × 105 CT26 cells and treated with control vehicle, USP5 inhibitor (EOAI3402143), MEK inhibitor (Trametinib), or combined treatment, respectively. b, c The growth of CT26 tumors in BALB/c mice with indicated treatments (b). Kaplan–Meier survival curves for BALB/c mice bearing CT26 tumors (c). Data were presented as mean ± S.D. Two-way ANOVA (b), log-rank test (c). n = 6 mice per group. d Representative images from immunohistochemical (IHC) staining of PD-1, CD8, and GzmB in CT26 tumors from BALB/c mice treated with indicated reagents. Scale bar: 50 μm. e, f Quantification for PD-1 (e) and CD8 (f) positive cells were counted from mice tumor sections. Each plot represents the mean of three random fields of each mouse tumor section. n = 4 mice per group. g The growth of MC38 tumors in WT or cKO mice with indicated treatment groups. n = 5 mice per group. Data were presented as mean ± S.D. Two-way ANOVA. hk Quantification of flow cytometry result of PD-1+ (h), IFN-γ+ (i), TNF+ (j), and GzmB+ (k) cells as percentage of CD8+ T cells in MC38 tumors after indicated treatments. n = 5 each group. l, m The growth of CT26 tumors in BALB/c mice with indicated treatments. Tumor volumes of mice treated with control antibody/vehicle (n = 8), EOAI3402143 (n = 8), anti-CTLA-4 monoclonal antibody (n = 9), or combined therapy (n = 9) were measured every 2 days and plotted individually (l). Kaplan–Meier survival curves for BALB/c mice bearing CT26 tumors (m). Data were presented as mean ± S.D. Log-rank test (m). n Quantification of flow cytometry result of PD-1+ as percentage of CD3+ T cells in CT26 tumors after indicated treatments. n = 6 mice each group. o, p Quantification of flow cytometry result of IFN-γ+ (o), TNF+ (p), and GzmB+ (q) cells as the percentage of CD8+ T cells in LLC tumors after indicated treatments. n = 6 mice each group. For e, f, hk, nq, data were presented as mean ± S.D. Two-tailed unpaired t-test. Source data are provided as a Source data file.

References

    1. Iwai, Y., Hamanishi, J., Chamoto, K. & Honjo, T. Cancer immunotherapies targeting the PD-1 signaling pathway. J. Biomed. Sci.24, 26 (2017). - PMC - PubMed
    1. Ribas, A. & Wolchok, J. D. Cancer immunotherapy using checkpoint blockade. Science359, 1350–1355 (2018). - PMC - PubMed
    1. Sharma, P. & Allison, J. P. The future of immune checkpoint therapy. Science348, 56–61 (2015). - PubMed
    1. Kim, T. K., Herbst, R. S. & Chen, L. Defining and understanding adaptive resistance in cancer immunotherapy. Trends Immunol.39, 624–631 (2018). - PMC - PubMed
    1. Kalbasi, A. & Ribas, A. Tumour-intrinsic resistance to immune checkpoint blockade. Nat. Rev. Immunol.20, 25–39 (2020). - PMC - PubMed

Publication types

Substances