. 2023 May 19;14(1):2861.
doi: 10.1038/s41467-023-38581-8.

ADAR1-mediated RNA editing of SCD1 drives drug resistance and self-renewal in gastric cancer

Affiliations

ADAR1-mediated RNA editing of SCD1 drives drug resistance and self-renewal in gastric cancer

Tin-Lok Wong et al. Nat Commun. .

Abstract

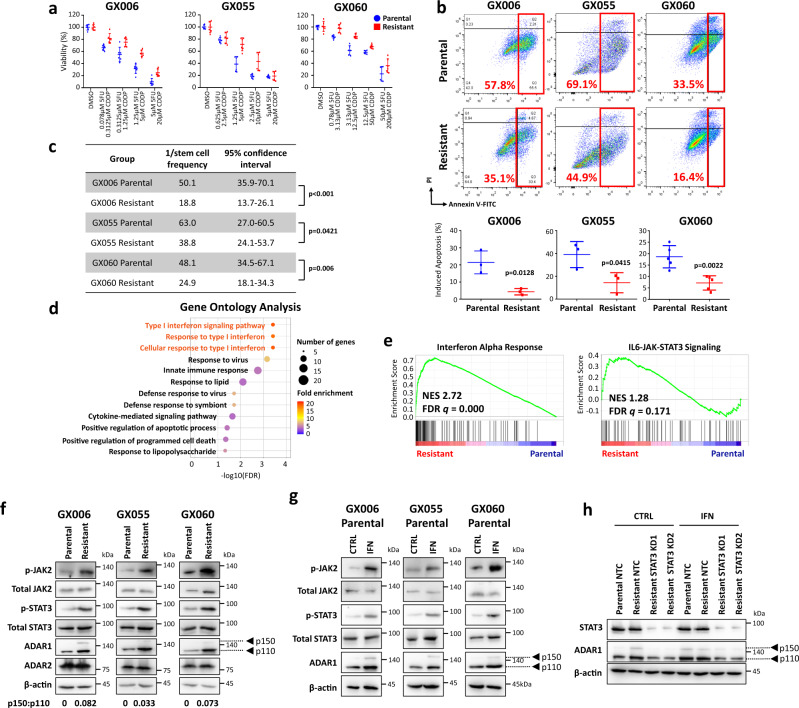
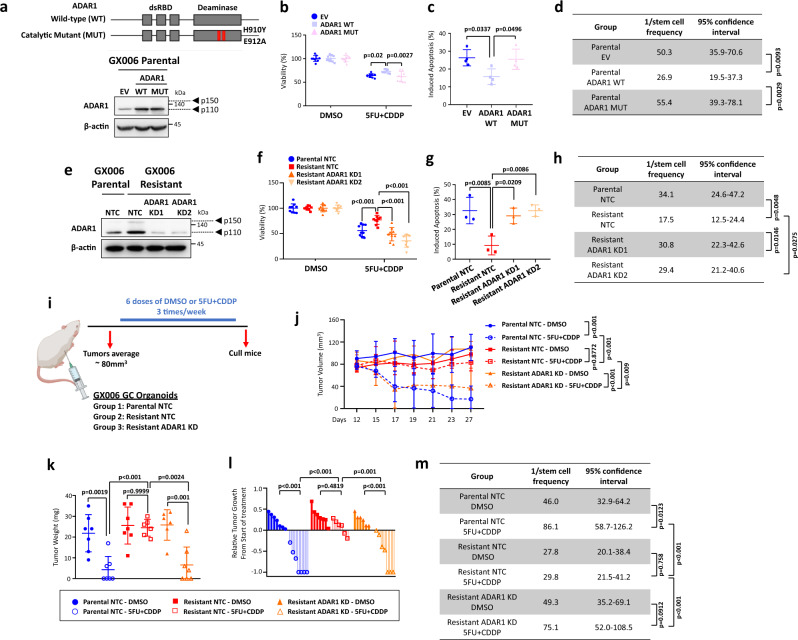
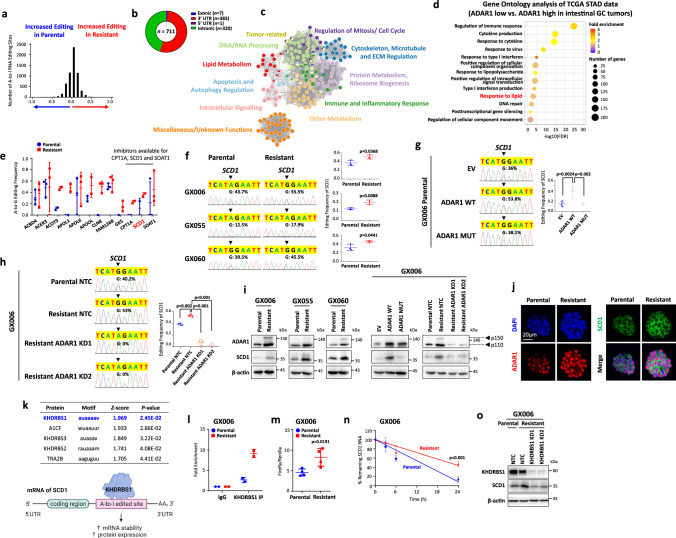
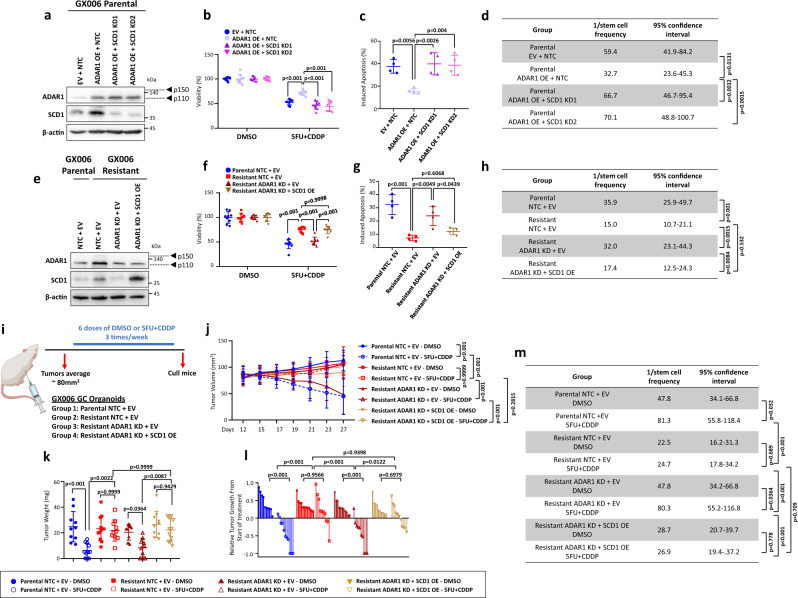
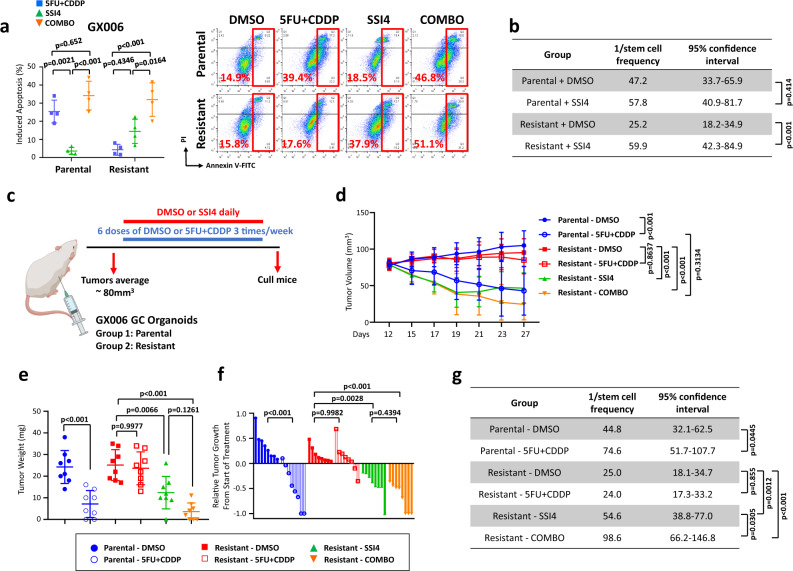
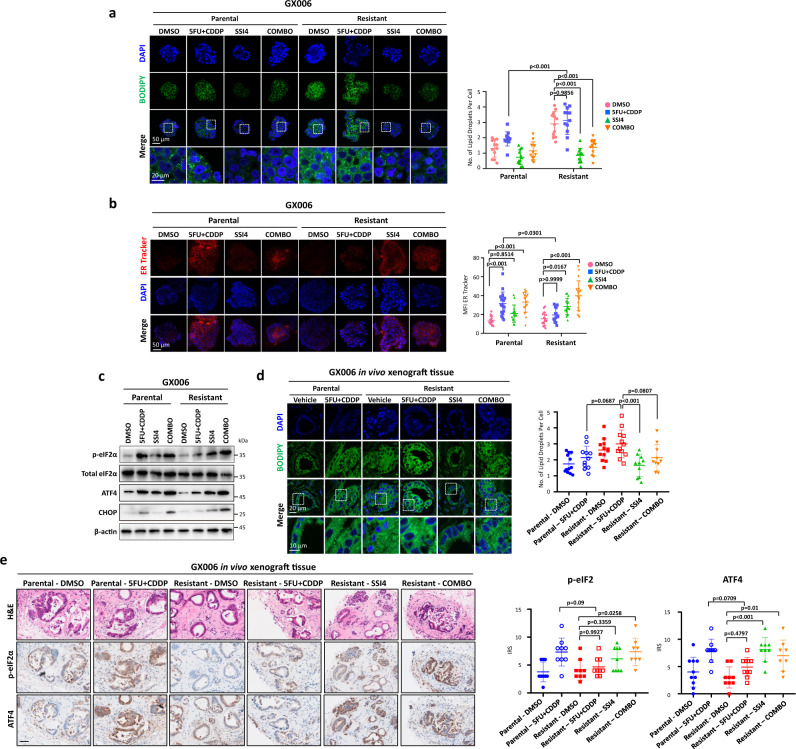
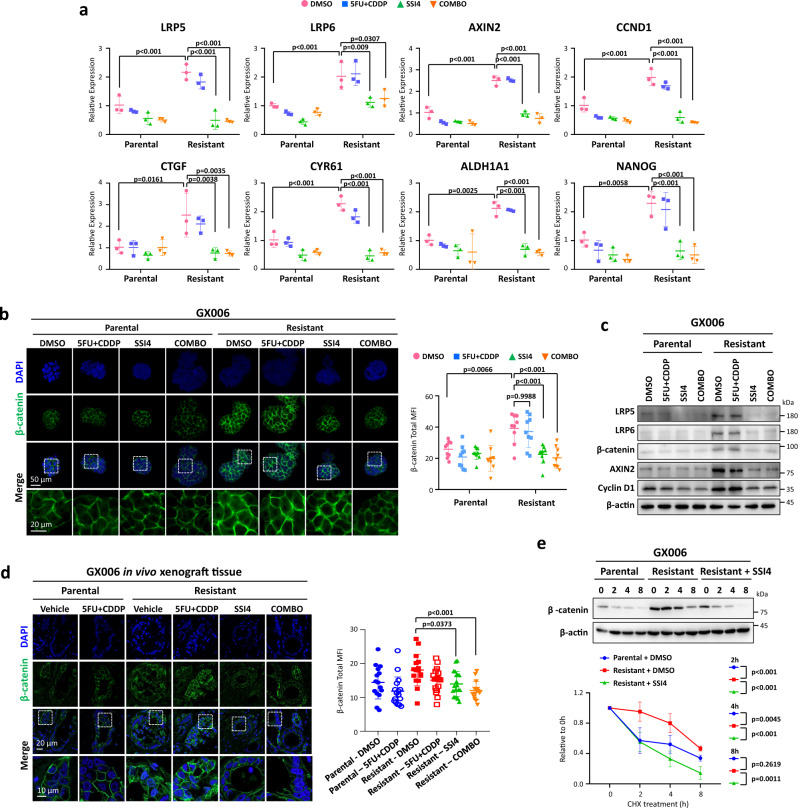
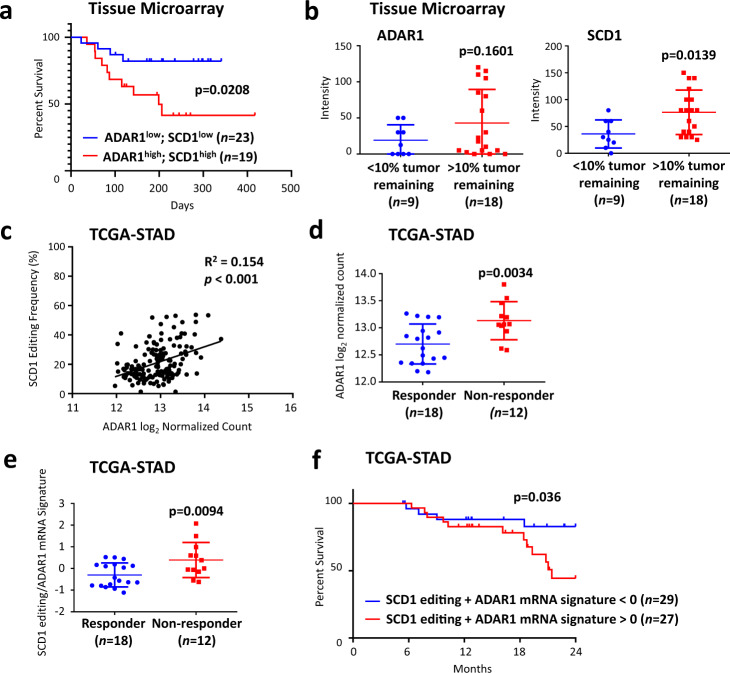
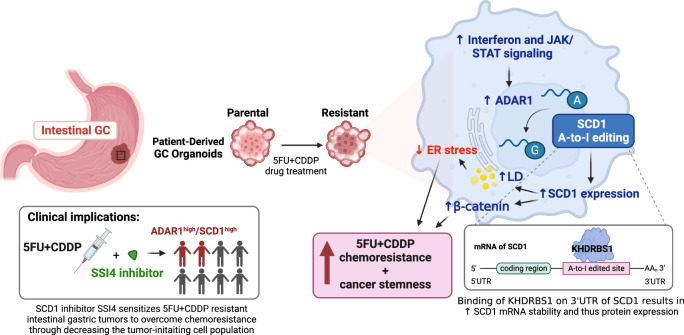
Targetable drivers governing 5-fluorouracil and cisplatin (5FU + CDDP) resistance remain elusive due to the paucity of physiologically and therapeutically relevant models. Here, we establish 5FU + CDDP resistant intestinal subtype GC patient-derived organoid lines. JAK/STAT signaling and its downstream, adenosine deaminases acting on RNA 1 (ADAR1), are shown to be concomitantly upregulated in the resistant lines. ADAR1 confers chemoresistance and self-renewal in an RNA editing-dependent manner. WES coupled with RNA-seq identify enrichment of hyper-edited lipid metabolism genes in the resistant lines. Mechanistically, ADAR1-mediated A-to-I editing on 3'UTR of stearoyl-CoA desaturase (SCD1) increases binding of KH domain-containing, RNA-binding, signal transduction-associated 1 (KHDRBS1), thereby augmenting SCD1 mRNA stability. Consequently, SCD1 facilitates lipid droplet formation to alleviate chemotherapy-induced ER stress and enhances self-renewal through increasing β-catenin expression. Pharmacological inhibition of SCD1 abrogates chemoresistance and tumor-initiating cell frequency. Clinically, high proteomic level of ADAR1 and SCD1, or high SCD1 editing/ADAR1 mRNA signature score predicts a worse prognosis. Together, we unveil a potential target to circumvent chemoresistance.


Conflict of interest statement

S.Y.L. has received research sponsorship from Pfizer, Merck, Servier, and Curegenix. The remaining authors declare no other competing interests.

Figures

Fig. 1
Fig. 1. 5FU + CDDP drug resistant gastric organoids exhibit interferon/JAK/STAT signaling activation leading to induction of ADAR1 expression.
GC patient-derived organoids of intestinal subtype GX006, GX055 and GX060 were trained with increasing concentrations of 5-fluorouracil (5FU) and cisplatin (CDDP) combination to develop 5FU + CDDP resistant lines. a CellTiter-Glo analysis showing the viability of parental versus 5FU + CDDP resistant organoids following treatment in various concentrations of 5FU + CDDP combinations. b Annexin V-PI analysis showing the percentage of apoptotic cells in parental versus 5FU + CDDP resistant organoids following treatment in 1.25 µM 5FU + 5 µM CDDP (GX006) or 5 µM 5FU + 20 µM CDDP (GX055 and GX060). c In vitro limiting dilution spheroid formation and tumor-initiating cell frequency calculation in parental versus 5FU + CDDP resistant organoids. d, e Gene Ontology (GO) (d) and Gene Set Enrichment Analysis (GSEA) (e) of differentially expressed genes identified by RNA-seq data found enrichment of interferon signaling and its downstream JAK/STAT signaling in the 5FU + CDDP resistant organoids as compared to parental controls. f Western blot for phosphorylated and total JAK2, phosphorylated and total STAT3, ADAR1 and ADAR2 in the three paired parental and 5FU + CDDP resistant organoid lines. β-actin served as a loading control. g Western blot for phosphorylated and total JAK2, phosphorylated and total STAT3 and ADAR1 in the three parental organoid lines with or without interferon (1000 U/mL) treatment for 24 hours. h Western blot for total STAT3 and ADAR1 in the GX006 parental and GX006 5FU + CDDP resistant organoid lines stably transduced with non-target control (NTC) or STAT3 shRNA knockdown (clones 1 and 2) after treatment with vehicle control (CTRL) or 1000 U/mL interferon (IFN) for 24 hours. β-actin served as a loading control. Images representative of n = 3 independent experiments. (a) n = 2 independent experiments; (b) n = 3 independent experiments for GX006, GX005 and n = 5 independent experiments for GX060; (c, f, g, h) n = 3 independent experiments. Significance were calculated by (b) unpaired two-tailed student t-test; (c) one-sided extreme limiting dilution analysis. Data was presented as mean ± standard deviation. NES for normalized enrichment score, FDR for false discover rate. Source data are provided as a Source Data file.
Fig. 2
Fig. 2. ADAR1 promotes chemoresistance and self-renewal in 5FU + CDDP-resistant organoids.
a Schematic diagram of ADAR1 wild-type (WT) and catalytically-dead mutant (MUT) with point mutations in the deaminase domain illustrated. Western blot for ADAR1 in GX006 parental organoid lines stably transduced with empty vector (EV) control, ADAR1 WT or ADAR1 MUT. β-actin served as a loading control. b–d CellTiter-Glo analysis (b) and Annexin V-PI analysis (c) in the absence or presence of 1.25 µM 5FU + 5 µM CDDP, and in vitro limiting dilution spheroid formation and tumor-initiating cell frequency calculation (d) in GX006 parental organoid lines stably transduced with EV, ADAR1 WT or ADAR1 MUT. e Western blot for ADAR1 in GX006 parental and GX006 5FU + CDDP resistant organoid lines stably transduced with non-target control (NTC) or ADAR1 shRNA knockdown (clones 1 and 2). β-actin served as a loading control. f–h CellTiter-Glo analysis (f) and Annexin V-PI analysis (g) in the absence or presence of 5FU + CDDP, and in vitro limiting dilution spheroid formation and tumor-initiating cell frequency calculation (h) in GX006 parental and GX006 5FU + CDDP resistant organoid lines stably transduced with NTC or ADAR1 shRNA (clones 1 and 2). i Schematic diagram of treatment regimen comparing GX006 parental and resistant organoid lines stably transduced with NTC or ADAR1 shRNA (clones 1) injected into NSG mice subcutaneously. j, k Volume (j) and weight (k) of tumors derived from the indicated cell lines at end point. l Waterfall plot showing the response of each tumor in each group at end point. m Ex vivo limiting dilution assay of tumors harvested from each group to evaluate tumor-initiating cell frequency. (a, b, d, e, f, g, h) n = 3 independent experiments; (c) n = 4 independent experiments); (i–m), n = 6-7 mice. Significance were calculated by (b, f, j) two-way ANOVA; (c, g, k, l) by one-way ANOVA; (d, h, m) by one-sided extreme limiting dilution analysis. Data was presented as mean ± standard deviation. EV for empty vector control, WT for wild-type, MUT for catalytically-dead mutant, NTC for non-target control, ADAR1 KD1 and KD2 for shRNA knockdown (clones 1 and 2). ns for not significant. Source data are provided as a Source Data file. Illustration for (i) was created using BioRender.com.
Fig. 3
Fig. 3. ADAR1-mediated RNA editing of SCD1 promotes its expression.
a Distribution of putative A-to-I RNA editing sites (n = 6025). b-c Distribution of A-to-I RNA editing events hyper-edited in 5FU + CDDP resistant organoid lines as categorized by regions of the RNA transcript (b) and biological processes (c). d Gene ontology analysis of differentially regulated genes by comparing gastric cancer patients of intestinal subtype (TCGA-STAD) with high ADAR1 or low ADAR1 expression (stratified by median ADAR1 expression). e Putative hyper-edited genes involved in lipid metabolism from GX006, GX055 and GX060. n = 3 biologically independent samples. f-h Sequence chromatograms of the SCD1 transcript in the indicated cell groups. Dot plots represent editing levels of SCD1. i Western blot for ADAR1 and SCD1 expression in the indicated cell groups. β-actin served as a loading control. j Immunofluorescence images showing concomitant high expression of ADAR1 with SCD1. Scale bar, 20 µm. k Top 5 RNA binding proteins predicted to bind to SCD1 3’UTR A-to-I editing sites by RBPmap. Illustration of binding of KHDRBS1 on to SCD1 3’UTR and the potential effect of A-to-I editing on the binding sites on SCD1 RNA. l immunoprecipitation binding assay of KHDRBS1 in parental or resistant organoids (GX006). m Luciferase reporter assay with SCD1 3’UTR in parental or resistant organoids (GX006). n Stability of SCD1 RNA following Actinomycin D treatment (10 µg/mL) for 3, 6, or 24 hours. Lines were linear regression of the data. o Western blot for KHDRBS1 and SCD1 expression in GX006 parental and GX006 5FU + CDDP resistant organoid lines stably transfected with NTC or KHDRBS1 shRNA (clones 1 and 2). (f, h, i, j, o) n = 3 independent experiments; (g, m, n) n = 4 independent experiments; (l) n = 2 independent experiments. Significance were calculated by (e, f, l m) unpaired two-tailed student t-test; (gh) one-way ANOVA; (n) two-way ANOVA. Data was presented as mean ± standard deviation. EV for empty vector control, WT for wild-type, MUT for catalytically-dead mutant, NTC for non-target control, ADAR1 KD1 and KD2 for shRNA knockdown (clones 1 and 2), KHDRBS1 KD1 and KD2 for shRNA knockdown (clone 1 and 2). Source data are provided as a Source Data file. Illustration for (k) was created using BioRender.com.
Fig. 4
Fig. 4. ADAR1-mediated upregulation of SCD1 drives chemoresistance in gastric cancer.
a Western blot for ADAR1 and SCD1 expression in GX006 parental organoids with or without ADAR1 overexpressed and with or without SCD1 concomitantly repressed. b–d CellTiter-Glo analysis of cell viability (b), Annexin V-PI analysis of apoptotic cells (c) and in vitro limiting dilution spheroid formation and tumor-initiating cell frequency calculation (d) in GX006 parental organoid lines with or without ADAR1 overexpressed and with or without SCD1 concomitantly repressed. e Western blot for ADAR1 and SCD1 expression in GX006 parental and GX006 5FU + CDDP resistant organoid lines with or without ADAR1 repressed and with or without SCD1 concomitantly overexpressed. Images representative of n = 3 independent experiments. f–h CellTiter-Glo analysis of cell viability (f), Annexin V-PI analysis of apoptotic cells (g) and in vitro limiting dilution spheroid formation and tumor-initiating cell frequency calculation (h) GX006 parental and GX006 5FU + CDDP resistant organoid lines with or without ADAR1 repressed and with or without SCD1 concomitantly overexpressed. i Schematic diagram of treatment regimen comparing GX006 parental and GX006 5FU + CDDP resistant organoid lines with or without ADAR1 repressed and with or without SCD1 concomitantly overexpressed injected into NSG mice subcutaneously. j, k Volume (j) and weight (k) of tumors derived from the indicated cell lines at end point. l Waterfall plot showing the response of each tumor in each group at end point. m Ex vivo limiting dilution assay of tumors harvested from each group to evaluate tumor-initiating cell frequency. (a–h) n = 3 independent experiments; (i–m) n = 10–12 mice. Significance were calculated by (b, f, j) two-way ANOVA; (c, g, k, l) by one-way ANOVA; (d, h, m) by one-sided extreme limiting dilution analysis. Data was presented as mean ± standard deviation. EV for empty vector control, NTC for non-target control, OE for overexpression, SCD1 KD1 and KD2 for SCD1 shRNA knockdown (clones 1 and 2), ADAR1 KD for ADAR1 shRNA knockdown (clone 1). ns for not significant. Source data are provided as a Source Data file. Illustration for (i) was created using BioRender.com.
Fig. 5
Fig. 5. SCD1 inhibitor sensitizes 5FU + CDDP-drug resistant gastric cancer to chemo-treatment and reduces tumor-initiating cells frequency.
a, b Functional assays investigating the effect of pharmacological inhibition of SCD1 using a SCD1 specific inhibitor SSI4 in GX006 parental and 5FU + CDDP resistant organoid lines. Comparisons include DMSO versus 5FU + CDDP versus SSI4 versus combination of 5FU + CDDP and SSI4 (COMBO) using Annexin V-PI apoptosis (a) and in vitro limiting dilution spheroid formation assays (b). c Schematic diagram of treatment regimen comparing GX006 parental and 5FU + CDDP resistant organoid lines treated with DMSO or 5FU + CDDP and in combination with vehicle or SSI4. d, e Volume (d) and weight (e) of tumors derived from the indicated treatment groups at end point. f Waterfall plot showing the response of each tumor in each treatment group at end point. g Ex vivo limiting dilution assay of HCC tumors harvested from each treatment group to evaluate tumor-initiating cell frequency. (a) n = 4 independent experiments; (b) n = 3 independent experiments; (c–e) n = 8 mice. Significance were calculated by (a, d) two-way ANOVA; (b, g) one-sided extreme limiting dilution analysis; (e, f) one-way ANOVA. Data were presented as mean ± standard deviation. COMBO for combination. ns for not significant. Source data are provided as a Source Data file. Illustration for (c) was created using BioRender.com.
Fig. 6
Fig. 6. SCD1-driven lipid droplets alleviate chemotherapy-induced ER stress.
a Representative immunofluorescence images and quantification of BODIPY staining of lipid droplet in parental and resistant GX006 GC organoids treated with DMSO, 5FU + CDDP, SSI4 and combination of 5FU + CDDP and SSI4 (COMBO). Scale bar, 50 μm (low magnification) and 20 μm (high magnification). b Representative immunofluorescence images and quantification of ER tracker staining in the indicated treatment groups in GX006 parental and GX006 5FU + CDDP resistant organoids. Scale bar, 50 μm. c Western blot analysis for expression of ER stress markers including total and phosphorylated eIF2α, ATF4, and CHOP upon indicated treatment groups in GX006 parental and GX006 5FU + CDDP resistant organoids. β-actin is used as loading control. d Representative immunofluorescence images and quantification of BODIPY staining of lipid droplet in the indicated treatment groups in GX006 parental and GX006 5FU + CDDP resistant xenografts. e Haematoxylin and eosin (H&E) and IHC staining for phosphorylated eIF2α and ATF4 in the indicated treatment groups in GX006 parental and GX006 5FU + CDDP resistant xenografts. Scale bar, 100μm. (a) n = 4 independent experiments; (b) n = 3 independent experiments. (c) n = 3 independent experiments; (d) n = 10-12 randomly captured field of view. Parental-DMSO, Resistant-DMSO, Resistant-5FU + CDDP, n = 12 images; Parental-5FU + CDDP, n = 11 images; Resistant-SSI4 and Resistant-COMBO, n = 10 images. (e) n = 8-10 randomly captured field of view. For p-eIF2α, Parental-DMSO, Parental-5FU + CDDP, Resistant-DMSO, Resistant-5FU + CDDP, Resistant-SSI4, n = 9 images; Resistant-COMBO, n = 8 images. For ATF4, Parental-DMSO and Resistant-5FU + CDDP, n = 10 images; Parental-5FU + CDDP, Resistant-DMSO and Resistant-SSI4, n = 9 images; Resistant-COMBO, n = 8 images. Significance were calculated by (a, b) two-way ANOVA; (d, e) one-way ANOVA. Data was presented as mean ± standard deviation. COMBO for combination, IRS for immunoreactive score, MFI for mean fluorescence intensity. ns for not significant. Source data are provided as a Source Data file.
Fig. 7
Fig. 7. SCD1 drives cancer stemness via augment Wnt/β-catenin signaling.
a qPCR analysis of LRP5, LRP6, AXIN2, CCND1, CTGF, CYR61, ALDH1A1 and NANOG in the indicated treatment groups in GX006 parental and GX006 5FU + CDDP resistant organoids. b Representative immunofluorescence images and quantification of β-catenin staining in the indicated treatment groups in GX006 parental and GX006 5FU + CDDP resistant organoids. Scale bar, 50μm (low magnification) and 20μm (high magnification). c Western blot analysis for expression of LRP5, LRP6, β-catenin, AXIN2, cyclin D1 in the indicated treatment groups in GX006 parental and GX006 5FU + CDDP resistant organoids. β-actin is used as the loading control. d Representative immunofluorescence images of GX006 parental and GX006 5FU + CDDP resistant xenografts stained with β-catenin. Scale bar, 20μm (low magnification) and 10μm (high magnification). e Western blot for β-catenin following cycloheximide (CHX) treatment for 0, 2, 4 and 8 hours in GX006 parental, GX006 5FU + CDDP resistant organoids and GX006 5FU + CDDP resistant organoids treated with SSI4. (a, c, e) n = 3 independent experiments; (b) n = 3 independent experiments. (d) n = 15–19 randomly captured field of view. Parental-DMSO and Resistant-COMBO, n = 15 images; Parental-5FU + CDDP and Resistant-DMSO, n = 17 images; Resistant-5FU + CDDP, n = 16 images; Resistant-SSI4 and, n = 19 images. Significance were calculated by (a, b) two-way ANOVA; (d, e) one-way ANOVA. All data were presented as mean ± standard deviation. COMBO for combination, MFI for mean fluorescence intensity. ns for not significant. Source data are provided as a Source Data file.
Fig. 8
Fig. 8. Overexpression of ADAR1 and hyper-editing/overexpression of SCD1 are strongly associated with the pathogenesis of gastric cancer.
a Kaplan-Meier overall survival plot comparing gastric cancer patients with high ADAR1 and high SCD1 proteomic expression versus low ADAR1 and low SCD1 proteomic expression. All gastric cancer patients were treated with a combination of 5FU and platinum-based chemotherapy in an adjuvant clinical setting. b Expression level of ADAR1 and SCD1 and its correlation with percent tumor remaining. All gastric cancer patients were treated with a combination of 5FU and platinum-based chemotherapy in a neoadjuvant clinical setting. c Pearson correlation analysis of ADAR1 mRNA expression with SCD1 editing in TCGA-STAD. d ADAR1 mRNA expression in responder versus non-responder to chemotherapy treatment in TCGA-STAD. e ADAR1 mRNA/SCD1 editing signature in responder versus non-responder to chemotherapy in TCGA-STAD. f Kaplan-Meier overall survival plot comparing patients with ADAR1 mRNA/SCD1 editing signature >0 with ADAR1 mRNA/SCD1 editing signature <0. For panels (d-f), only GC patients of intestinal subtype treated with 5FU or platinum-based chemotherapy were considered. Significance were calculated by (a, f) log-rank test; (b, d, e) unpaired two-tailed student t-test; (c) two-tailed Pearson correlation analysis. All data was presented as mean ± standard deviation. Source data are provided as a Source Data file.
Fig. 9
Fig. 9. Proposed model for chemoresistance driven by ADAR1-upregulated SCD1 in gastric cancer.
Illustration was created using BioRender.com.

References

    1. Sung H, et al. Global cancer statistics 2020: GLOBOCAN estimates of incidence and mortality worldwide for 36 cancers in 185 countries. CA Cancer J. Clin. 2021;71:209–249. doi: 10.3322/caac.21660. - DOI - PubMed
    1. Van Cutsem E, et al. ESMO consensus guidelines for the management of patients with metastatic colorectal cancer. Ann. Oncol. 2016;27:1386–1422. doi: 10.1093/annonc/mdw235. - DOI - PubMed
    1. Cunningham D, et al. Perioperative chemotherapy versus surgery alone for resectable gastroesophageal cancer. N. Engl. J. Med. 2006;355:11–20. doi: 10.1056/NEJMoa055531. - DOI - PubMed
    1. Ychou M, et al. Perioperative chemotherapy compared with surgery alone for resectable gastroesophageal adenocarcinoma: an FNCLCC and FFCD multicenter phase III trial. J. Clin. Oncol. 2011;29:1715–1721. doi: 10.1200/JCO.2010.33.0597. - DOI - PubMed
    1. Fiteni F, et al. Docetaxel, cisplatin, and 5-fluorouracil as perioperative chemotherapy compared with surgery alone for resectable gastroesophageal adenocarcinoma. Cancer Med. 2016;5:3085–3093. doi: 10.1002/cam4.885. - DOI - PMC - PubMed

Publication types

MeSH terms