. 2023 May 19;14(1):2880.
doi: 10.1038/s41467-023-38588-1.

Impaired expression of metallothioneins contributes to allergen-induced inflammation in patients with atopic dermatitis

Affiliations

Impaired expression of metallothioneins contributes to allergen-induced inflammation in patients with atopic dermatitis

Sofia Sirvent et al. Nat Commun. .

Abstract

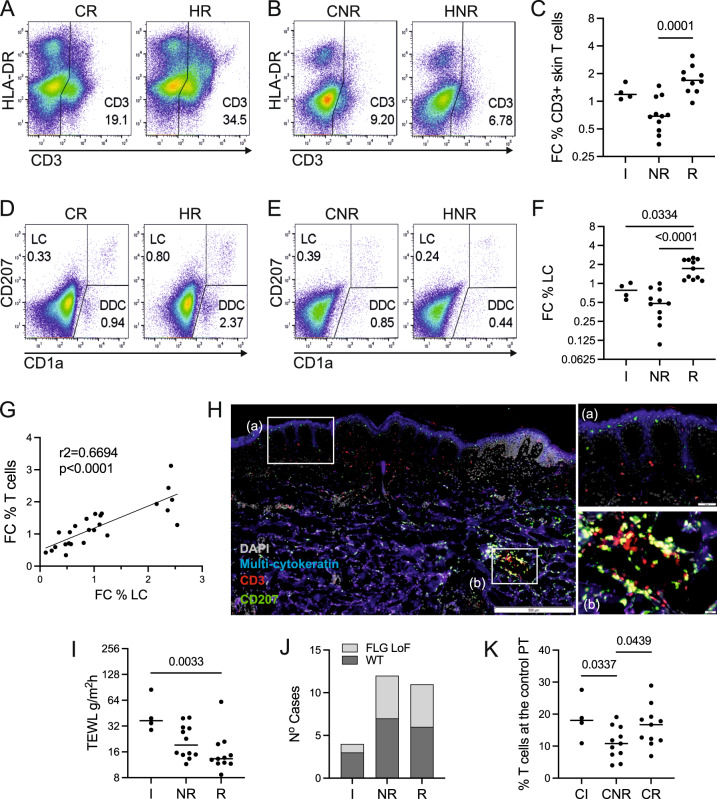
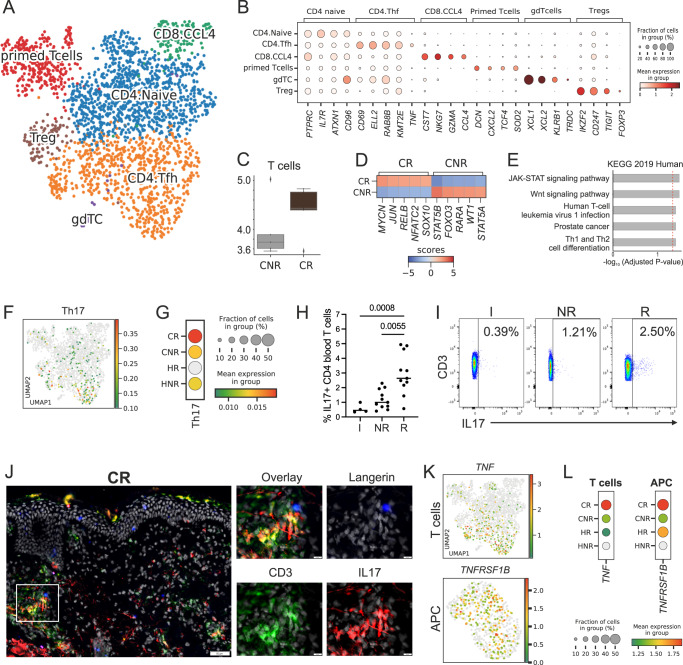
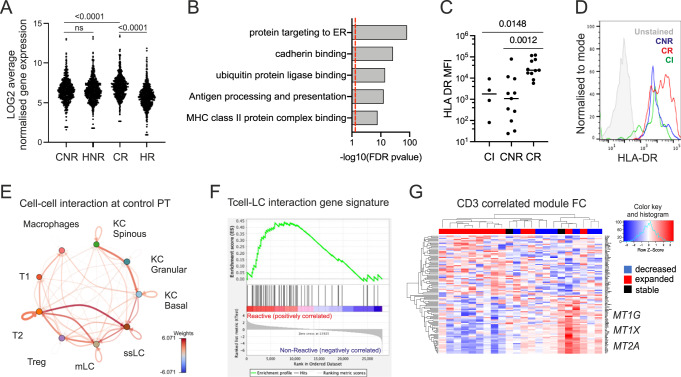
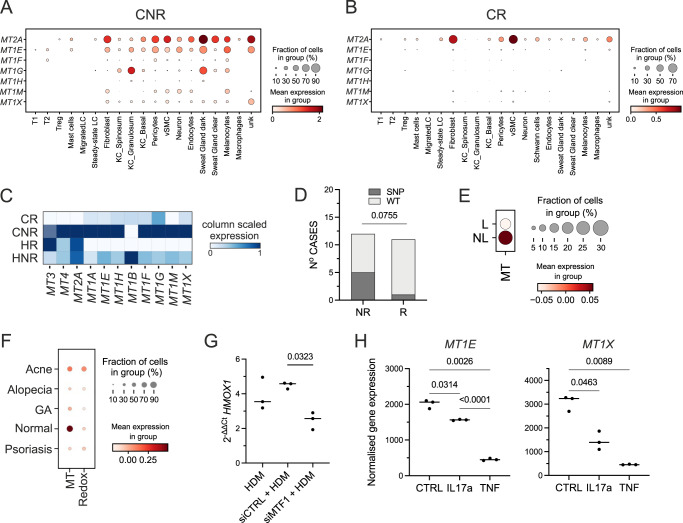
Regulation of cutaneous immunity is severely compromised in inflammatory skin disease. To investigate the molecular crosstalk underpinning tolerance versus inflammation in atopic dermatitis, we utilise a human in vivo allergen challenge study, exposing atopic dermatitis patients to house dust mite. Here we analyse transcriptional programmes at the population and single cell levels in parallel with immunophenotyping of cutaneous immunocytes revealed a distinct dichotomy in atopic dermatitis patient responsiveness to house dust mite challenge. Our study shows that reactivity to house dust mite was associated with high basal levels of TNF-expressing cutaneous Th17 T cells, and documents the presence of hub structures where Langerhans cells and T cells co-localised. Mechanistically, we identify expression of metallothioneins and transcriptional programmes encoding antioxidant defences across all skin cell types, that appear to protect against allergen-induced inflammation. Furthermore, single nucleotide polymorphisms in the MTIX gene are associated with patients who did not react to house dust mite, opening up possibilities for therapeutic interventions modulating metallothionein expression in atopic dermatitis.


Conflict of interest statement

The authors declare no competing interests. M.E.P. started employment at Janssen Pharmaceutical Companies of Johnson & Johnson during the revision cycle of the paper. Janssen, or any of the employees/stakeholders have not been involved in any part or aspect of the project or paper.

Figures

Fig. 1
Fig. 1. In vivo allergen challenge model to investigate mechanisms of local immune responses in human skin.
A Human in vivo allergen challenge set-up. 6 mm biopsies taken 48 h after application of control and HDM (challenge) patch are processed to investigate transcriptional networks and regulatory interactions underpinning T cell-mediated responses to allergen. B Representative images of non-reactive, irritant, and reactive patch test responses to control (left) and HDM (right) allergen, 48 post-patch application. Number of patients in each group given. TEWL trans epidermal water loss, SPT skin prick test, FLG Filaggrin status, CR control patch reactive patient, HR HDM patch, reactive patient, CNR control patch, non-reactive patient, HNR HDM patch, non-reactive patient.
Fig. 2
Fig. 2. Reactivity to HDM is associated with the co-expansion of T cells and LCs.
AF Frequency of immune cells in control and HDM patch tests from reactive vs. non-reactive patients, measured by flow cytometry. The number in the graph indicates the percentage of cells in the positive gate. CR control patch, reactive patient, HR HDM patch, reactive patient, CNR control patch, non-reactive patient, HNR HDM patch, non-reactive patient. Representative examples. A, B CD3+ T lymphocytes, D, E CD207/CD1a positive LCs. C, F Fold changes (FC) in the percentage of detected immune cells between HDM patch test and control patch test from patients with irritant, non-reactive and reactive reactions to HDM. G Correlations between fold changes in the percentage of CD3+ T cells and LCs. Pearson correlation coefficient is shown. H Immunofluorescence staining of HDM-reactive patch test site. Inserts show the indicated optical fields at the epidermis (top) and in the dermis (bottom). Hub structures of co-localising CD207 (green) and CD3 (red) in the dermis. Epidermal layer stained with multi-cytokeratin (blue). DAPI stain for nuclei (grey). Scale bars: 500 μm, 50 μm (insets). A representative of n = 3 individual donors. I Functional assessment of skin barrier: TEWL measurements across patient groups. J Number of irritant (IR), non-reactive (NR) and reactive (R) cases with loss of function (LoF) variants in FLG compared to wildtype (WT). K Percentage of CD3+ T cells in control patch test sites identified by flow cytometry. Statistical significance was assessed by t-test. C, G NR n = 11, R n = 10, F, K NR n = 11, R n = 11, I, J IRR n = 4, NR n = 12, R n = 11. Statistical significance was assessed by the Kruskal–Wallis test with post hoc Dunn test (C, F, I) and unpaired ANOVA with post hoc Fisher test (K) following the normality Kolmogorov–Smirnov test of data distribution. Source data are provided as a Source Data file.
Fig. 3
Fig. 3. Activated TNF-expressing Th17 cells are significantly enriched in reactive patients.
Constellation-seq analysis enriched for 1161 transcripts in 2374 single T lymphocytes cells from patch test skin biopsies, n = 10 patients, 5 per group. A UMAP plot depicting clustering of T lymphocyte populations. B Cell subset defining markers (Wilcoxon rank test). C Number of T cell transcriptomes in control reactive (CR) and non-reactive (CNR) patients. The central line denotes the median, boxes represent the interquartile range (IQR), and whiskers show the distribution except for outliers. Outliers are all points outside 1.5 times the IQR. D Top transcription factors expressed in T cells from reactive (CR) and non-reactive (CNR) patients in the control samples. E Top biological pathways enriched at the control site in DEGs from patient reactive (CR) to HDM (KEGG database), p-value computed using the Fisher exact test, with Benjamini Hocheberg FDR correction. F UMAP plots showing expression of Th17 gene signature. G Th17 gene signature across patient groups, dot plot: size depicts % of expressing cells, colour intensity encodes mean expression in the group. H %IL17 producing CD3+ CD4+ T cells from PBMCs in irritant (I) non-reactive (NR) and reactive (R) patients. Kruskal–Wallis test with post hoc Dunn test. I A representative plot of IL17 expression in CD3+ CD4+ T cells I, NR and R patients. J Immunofluorescence staining of HDM-reactive patch test site. Inserts show the indicated optical field in the dermis. Hub structures of co-localising CD207 (blue), CD3 (green) and IL17 (red). Epidermal layer stained with multi-cytokeratin (blue). DAPI stain for nuclei (grey), Scale bars: 50 μm. Representative of n = 2. K) UMAP plots showing expression of TNF and TNFRSF1B across T cells (top) and APCs (bottom). L TNF and TNFRSF1B expression level across patient groups, dot plot: size depicts % of expressing cells, colour intensity encodes mean expression in the group. CR control reactive, HR HDM reactive, CNR control non-reactive, HNR HDM non-reactive. n = 5/group, C and H paired. Source data are provided as a Source Data file and via GEO.
Fig. 4
Fig. 4. Expression of metallothioneins counterbalance LC overactivation differentiating HDM reactive and non-reactive patients.
A Average log gene expression levels of genes in the main cluster encoding LC core programmes across non-reactive and reactive patients. Transcript to transcript clustering Biolayout, 691 genes, r = 0.85, MCL = 1.7. Each dot represents an average gene expression. CR: control reactive, HR HDM reactive, CNR control non-reactive, HNR HDM non-reactive, repeated measure one-way ANOVA. B Gene Ontologies are overrepresented in the main cluster encoding LC programmes, ToppGene, Benjamini–Hochberg-adjusted p-value. C HLA-DR expression levels measured by Flow Cytometry in CD207+ LCs. Kruskal-Wallis test with post-hoc Dunn test. D) A representative histogram of HLA-DR expression in control patch tests of CI (green), CNR(blue) and CR(red) patients compared with unstained control (grey). E Crosstalk analysis of interactions overexpressed between cell populations at the control site. DropSeq, N = 6 biopsies, 1NR, 2R patients. F GSEA enrichment profile in CR (red) and CNR (Blue) patients. G Heatmap showing segregation of patients with CD3 T cell numbers decreasing (blue), expanding (red) and stable (black) in reaction to patch test using fold change expression values of 100 top differentially regulated genes in module turquoise. Genes overexpressed in non-reactive samples contain members of the metallothionein family. CI, HI n = 4, CNR, HNR n = 11, CR, HNR n = 7 paired samples. WGCNA analysis, Pearson coefficients denoting correlation, a univariate regression model with pairwise complete Student t-test. Source data are provided as a Source Data file and via GEO.
Fig. 5
Fig. 5. Enhanced expression of metallothionein genes protects non-reactive patients from inflammation and prevents HDM-induced oxidative stress.
A, B Dot plots showing expression of metallothioneins across cell types in control patch tests from patients with non-reactive (A) and reactive (B) patch test reactions to HDM. SCRAN-normalised single-cell RNA expression is shown for each transcript. n = 3, fresh skin biopsies, Drop-seq. C Heatmap comparing levels of expression for metallothioneins in whole skin using high sensitivity Constellation-seq method, n = 10 skin donors. CR control reactive, HR HDM reactive, CNR control non-reactive, HNR HDM non-reactive. D Distribution of WT vs SNP in MT1X gene across patient groups. Chi-square test = 3.159, two-sided, df = 1. E Expression of metallothioneins in patients with AD, in lesional (L) and non-lesional (NL) skin. F Expression of signatures encoding metallothioneins (MT), and RedOX, in patients with T-cell mediated skin diseases, Z-score, GSE150672. G Effect of silencing of MT1F on the expression of HMOX1 in HDM stimulated fibroblasts. n = 3 independent experiments, paired ANOVA with Tukey test. H Normalised expression levels of genes encoding MT1E and MT1X in keratinocytes exposed to IL17a and TNF. GSE36287, n = 3 biological replicates, paired ANOVA with Tukey test. A, B, E, F dot plot: size depict % of expressing cells, colour intensity encodes mean expression in the group. Acne acne vulgaris, Alopecia alopecia areata, GA granuloma annulare. Source data are provided as a Source Data file.

References

    1. Newell L, et al. Sensitization via healthy skin programs Th2 responses in individuals with atopic dermatitis. J. Invest. Dermatol. 2013;133:2372–2380. doi: 10.1038/jid.2013.148. - DOI - PubMed
    1. Kobayashi T, Naik S, Nagao K. Choreographing Immunity in the skin epithelial barrier. Immunity. 2019;50:552–565. doi: 10.1016/j.immuni.2019.02.023. - DOI - PMC - PubMed
    1. Cavani A, et al. Patients with allergic contact dermatitis to nickel and nonallergic individuals display different nickel-specific T cell responses. Evidence for the presence of effector CD8+ and regulatory CD4+ T cells. J. Invest. Dermatol. 1998;111:621–628. doi: 10.1046/j.1523-1747.1998.00334.x. - DOI - PubMed
    1. Friedmann PS, Pickard C. Quantifying human susceptibility to contact sensitization; risk assessments now and in the future. Contact Dermat. 2010;63:237–247. doi: 10.1111/j.1600-0536.2010.01801.x. - DOI - PubMed
    1. Liu PT, et al. Toll-like receptor triggering of a vitamin D-mediated human antimicrobial response. Science. 2006;311:1770–1773. doi: 10.1126/science.1123933. - DOI - PubMed

Publication types