. 2023 May 19;14(1):2879.
doi: 10.1038/s41467-023-38714-z.

Independent rediploidization masks shared whole genome duplication in the sturgeon-paddlefish ancestor

Affiliations

Independent rediploidization masks shared whole genome duplication in the sturgeon-paddlefish ancestor

Anthony K Redmond et al. Nat Commun. .

Abstract

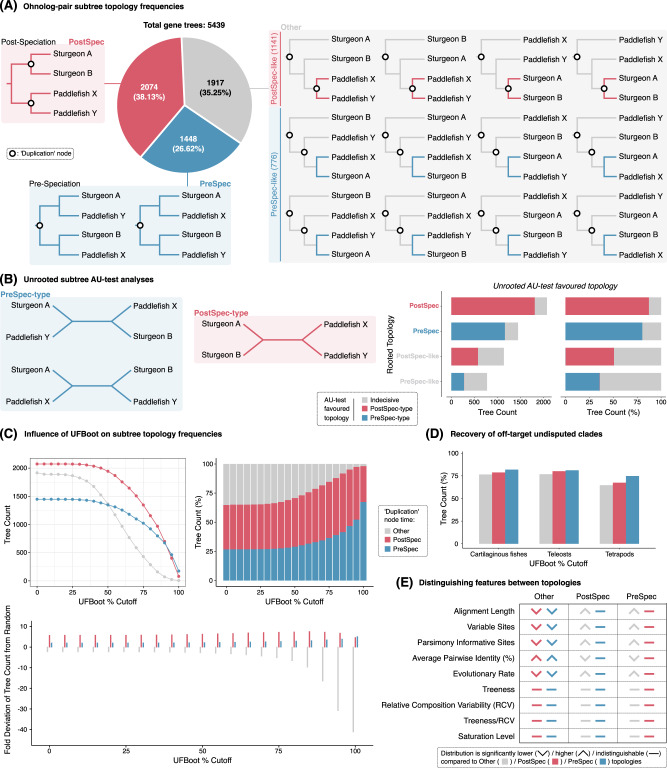
Whole genome duplication (WGD) is a dramatic evolutionary event generating many new genes and which may play a role in survival through mass extinctions. Paddlefish and sturgeon are sister lineages that both show genomic evidence for ancient WGD. Until now this has been interpreted as two independent WGD events due to a preponderance of duplicate genes with independent histories. Here we show that although there is indeed a plurality of apparently independent gene duplications, these derive from a shared genome duplication event occurring well over 200 million years ago, likely close to the Permian-Triassic mass extinction period. This was followed by a prolonged process of reversion to stable diploid inheritance (rediploidization), that may have promoted survival during the Triassic-Jurassic mass extinction. We show that the sharing of this WGD is masked by the fact that paddlefish and sturgeon lineage divergence occurred before rediploidization had proceeded even half-way. Thus, for most genes the resolution to diploidy was lineage-specific. Because genes are only truly duplicated once diploid inheritance is established, the paddlefish and sturgeon genomes are thus a mosaic of shared and non-shared gene duplications resulting from a shared genome duplication event.


Conflict of interest statement

The authors declare no competing interests.

Figures

Fig. 1
Fig. 1. Scenarios of WGD and rediploidization timing relative to the Sturgeon-Paddlefish divergence and their expected topologies for ohnolog-pair gene trees.
Scenario 1 is the widely accepted hypothesis of independent WGD events in the sturgeon and paddlefish lineages. Scenario 2 is a shared ancestral WGD with complete rediploidization prior to lineage divergence. Scenario 3 extends Scenario 2 by considering the possibility of speciation happening during a prolonged, asynchronous rediploidization process following a shared WGD event. In this case genes rediploidizing prior to speciation will follow the gene tree expected under scenario 2 while those rediploidizing after speciation (i.e. lineage-specific rediploidization) will follow the gene tree expected under Scenario 1. This is distinguishable from independent small-scale duplication using the expectation that ohnolog pairs largely retain ancestral collinearity between non-overlapping duplicate chromosomal regions. Rediploidization events and associated gene trees after the sturgeon-paddlefish speciation are shown in red, those preceding speciation are shown in blue.
Fig. 2
Fig. 2. Ohnolog pair gene tree topologies and investigation of possible sources of phylogenetic error.
A Categorisation of the 15 possible rooted sturgeon-paddlefish subtrees with duplication nodes coming before (‘PreSpec’) or after (‘PostSpec’) these species diverged, and ‘Other’ trees that only partially match one of these scenarios (either, ‘PreSpec-like’, or ‘PostSpec-like’). The pie chart quantifies the relative frequency at which each topology was recovered. B Three possible unrooted sturgeon-paddlefish subtrees (two ‘PreSpec-type’, left; and one ‘PostSpec-type’, centre), and Approximately Unbiased (AU)-test (right) of tree reliability to determine how frequently datasets from each category of rooted subtree described in part (A) can decisively reject a given unrooted topology category type and thereby favour the other. C Rooted subtree topology category (broken down at the ‘Other’, ‘PostSpec, ‘PreSpec’ level) count (top left), percentage (top right), and fold deviation of the tree count per category from random expectations (i.e. as estimated if each of the 15 rooted trees were recovered equally frequently; bottom) under increasingly strict UFBoot percentage cut-offs, such that both UFBoot percentages in a given subtree must be greater than or equal to the cut-off for that tree to be retained. D Percentage of trees fitting each sturgeon-paddlefish subtree category that recover other key undisputed clades. E Summary of significant differences across sequence alignment, modelling, and tree-based statistics for each subtree category (Supplementary Fig. 1 provides violin/box plots with p values). Source data are provided as a Source Data file. Raw alignments, gene trees, and gene tree parsing code are provided on figshare.
Fig. 3
Fig. 3. Synteny patterns of ‘PreSpec’ and ‘PostSpec’ ohnolog pairs in the paddlefish and sturgeon genomes.
Circos plots of the sterlet sturgeon genome (A) and the American paddlefish genome (B) showing the chromosomal locations of ohnolog pairs, with links coloured according to the PreSpec (blue) or PostSpec (red) tree topology. Microchromosomes <20 Mb are not labelled. C Circos plot of ohnolog-pairs in both the sturgeon and paddlefish genomes, with intra-specific PostSpec links (red) and inter-specific PreSpec links (blue). Only macrochromosomes >40 Mb from each species are labelled. Source data are provided as a Source Data file.
Fig. 4
Fig. 4. Ks value ridgeline density plots for distinct ohnolog and ortholog pair datasets at varying UFBoot cut-off percentages.
Species-specific ohnolog pair Ks value densities are plotted for each of the four major topology categories (i.e. PostSpec, PreSpec, PostSpec-like, and PreSpec-like) for intra-species ohnolog pair data. For comparison we also plotted two sets of paddlefish-sturgeon ortholog pairs: (i) Single-Copy Orthogroups—sturgeon and paddlefish sequences present in the single copy genes identified in all species by OrthoFinder, and (ii) PreSpec Ortholog pairs—these derive from each ohnolog in the PreSpec topology such that a single PreSpec topology contributes two ortholog pairs whose divergence matches the sturgeon-paddlefish speciation. White vertical lines split each distribution into four quantiles, and the number of ohnolog/ortholog pair Ks values (n) underlying each distribution is also displayed per dataset. Ks values ≥ 0.3 were excluded, as well as pairs where a coding sequence was flagged as potentially problematic (e.g. early stop codon) by the wgd software tool used to calculate Ks values. Source data are provided as a Source Data file.
Fig. 5
Fig. 5. Phylogenomic dating of the shared sturgeon-paddlefish WGD lower bound.
Ohnolog copies were randomly classified as (A or B) and concatenated for phylogenomic analysis. The jawed vertebrate Bayesian phylogenomic timetree from one of five random concatenations is shown (for all five see Supplementary Figs. 8 and 9). The 95% CIR (credibility interval) is shown for each node in blue. The 95% CIR results from an independent analysis under the prior are shown below each node in red, verifying that our priors on the WGD divergence time is sufficiently diffuse to have avoided restricting our results to the inferred WGD lower bound timing in the main analyses. Upper and lower bound fossil calibrations are shown as triangles for each calibrated divergence. Two calibration strategies were applied, the first (A) with more ray-finned fish calibrations (calibrations triangles with white fill are specific to this analysis) than the second (B), where a relaxed calibration strategy was applied to account for uncertainty in the phylogenetic placement of some ray-finned fish fossils. Individual random concatenation analyses are shown in Supplementary Figs. 8 and 9. Source data including calibrations and results are provided in Supplementary Data 1 and on figshare.

References

    1. Mandáková T, Lysak MA. Post-polyploid diploidization and diversification through dysploid changes. Curr. Opin. Plant Biol. 2018;42:55–65. doi: 10.1016/j.pbi.2018.03.001. - DOI - PubMed
    1. Blanc G, Wolfe KH. Widespread paleopolyploidy in model plant species inferred from age distributions of duplicate genes. Plant Cell. 2004;16:1667–1678. doi: 10.1105/tpc.021345. - DOI - PMC - PubMed
    1. Soltis PS, Soltis DE. Ancient WGD events as drivers of key innovations in angiosperms. Curr. Opin. Plant Biol. 2016;30:159–165. doi: 10.1016/j.pbi.2016.03.015. - DOI - PubMed
    1. Clark JW, Donoghue PCJ. Whole-Genome Duplication and Plant Macroevolution. Trends Plant Sci. 2018;23:933–945. doi: 10.1016/j.tplants.2018.07.006. - DOI - PubMed
    1. Wolfe KH, Shields DC. Molecular evidence for an ancient duplication of the entire yeast genome. Nature. 1997;387:708–713. doi: 10.1038/42711. - DOI - PubMed

Publication types