. 2023 May 19;13(1):8118.
doi: 10.1038/s41598-023-33968-5.

Correcting bias in cardiac geometries derived from multimodal images using spatiotemporal mapping

Affiliations

Correcting bias in cardiac geometries derived from multimodal images using spatiotemporal mapping

Debbie Zhao et al. Sci Rep. .

Erratum in

Abstract

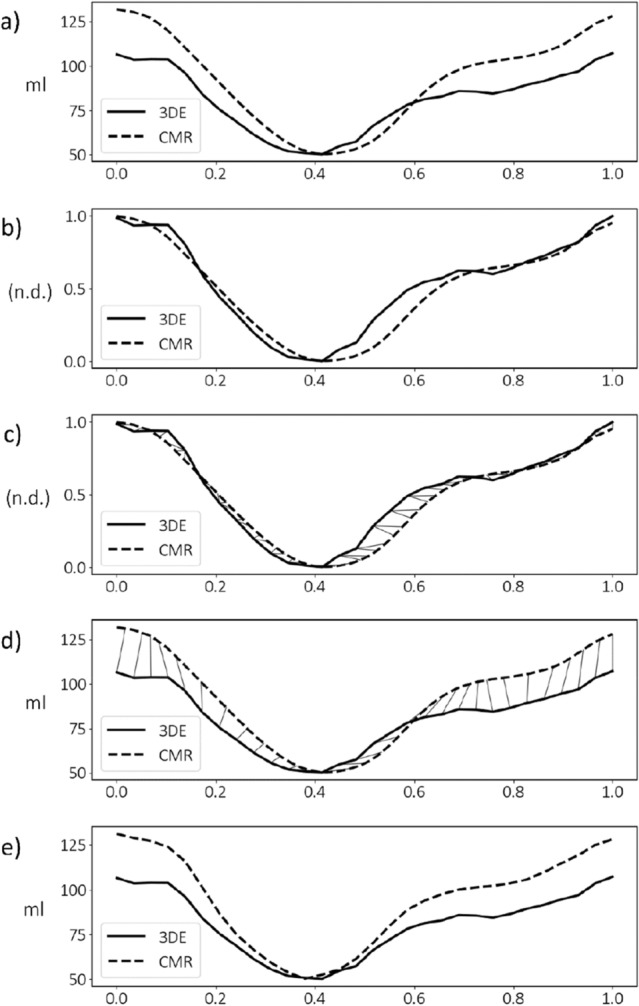
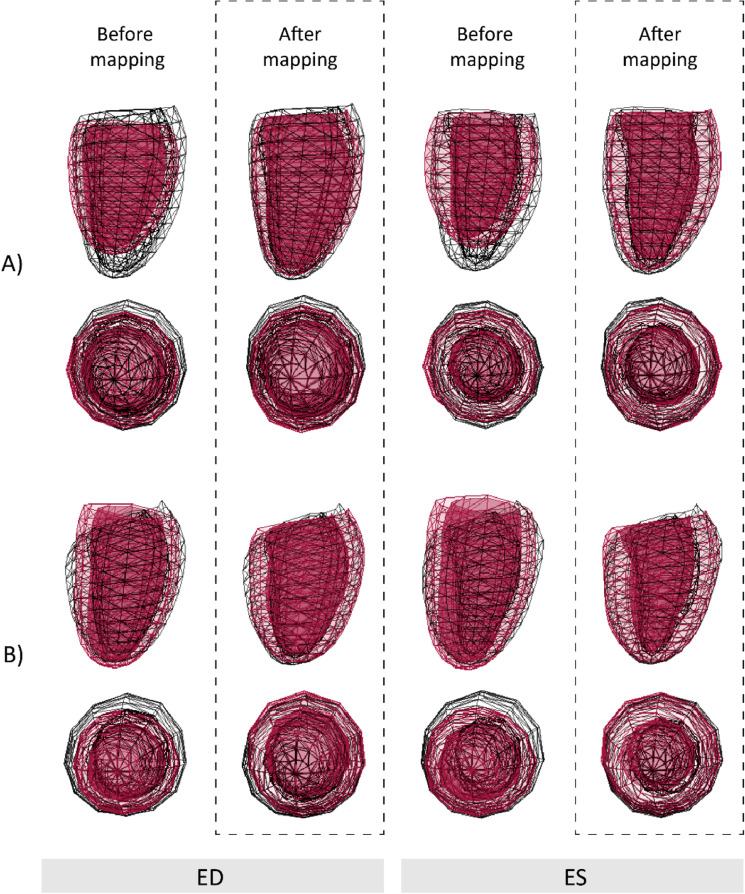
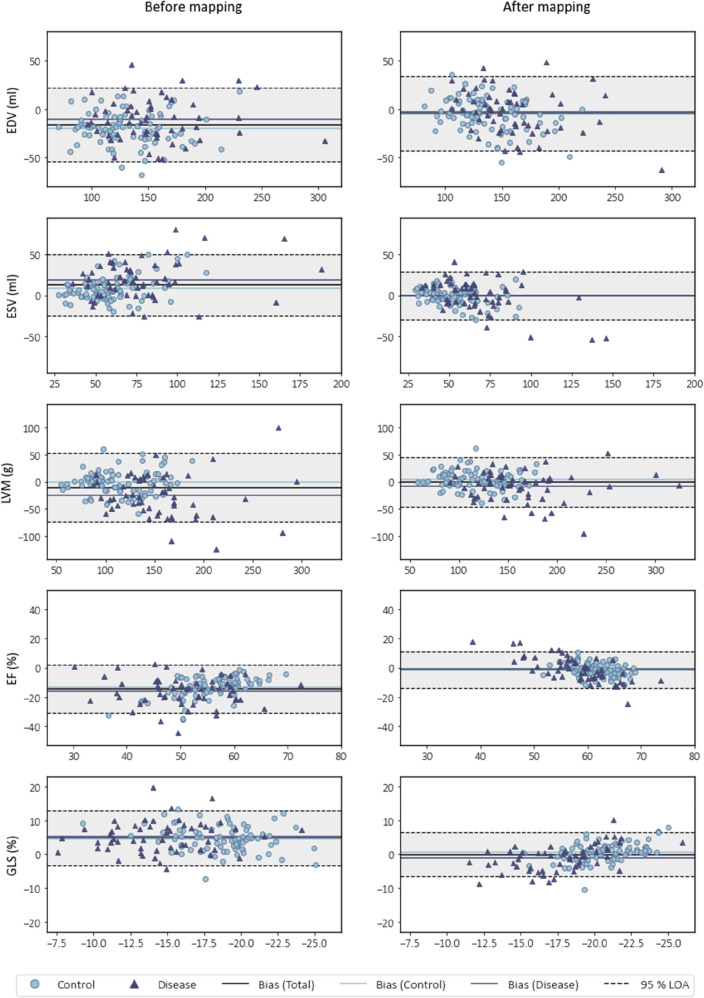
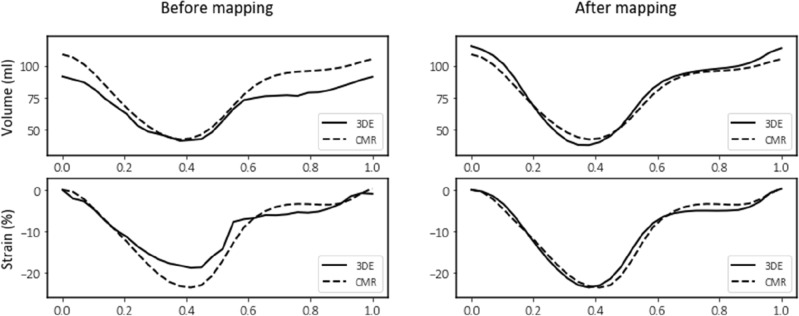
Cardiovascular imaging studies provide a multitude of structural and functional data to better understand disease mechanisms. While pooling data across studies enables more powerful and broader applications, performing quantitative comparisons across datasets with varying acquisition or analysis methods is problematic due to inherent measurement biases specific to each protocol. We show how dynamic time warping and partial least squares regression can be applied to effectively map between left ventricular geometries derived from different imaging modalities and analysis protocols to account for such differences. To demonstrate this method, paired real-time 3D echocardiography (3DE) and cardiac magnetic resonance (CMR) sequences from 138 subjects were used to construct a mapping function between the two modalities to correct for biases in left ventricular clinical cardiac indices, as well as regional shape. Leave-one-out cross-validation revealed a significant reduction in mean bias, narrower limits of agreement, and higher intraclass correlation coefficients for all functional indices between CMR and 3DE geometries after spatiotemporal mapping. Meanwhile, average root mean squared errors between surface coordinates of 3DE and CMR geometries across the cardiac cycle decreased from 7 ± 1 to 4 ± 1 mm for the total study population. Our generalised method for mapping between time-varying cardiac geometries obtained using different acquisition and analysis protocols enables the pooling of data between modalities and the potential for smaller studies to leverage large population databases for quantitative comparisons.


Conflict of interest statement

MPN is a consultant to HeartLab (NZ) Ltd. The remaining authors declare that they have no competing interests.

Figures

Figure 1
Figure 1
Dynamic time warping method for temporal alignment of left ventricular geometric models using volume traces over one cardiac cycle (horizontal axis) derived from 3D echocardiography (3DE) and cardiac magnetic resonance (CMR) imaging. (a) Volume traces from image analysis after temporal normalisation. (b) Volume normalisation producing traces with no dimensions (n.d.). (c) Warping paths between normalised volumes traces. (d) One-to-one mapping between volume traces. (e) Aligned volume traces.
Figure 2
Figure 2
Long- and short-axis mesh overlays of left ventricular geometries derived from 3D echocardiography (red) and cardiac magnetic resonance imaging (black wireframe) acquired from two subjects before and after spatiotemporal mapping. Comparisons are shown at end-diastole (ED) and end-systole (ES). (A) Healthy control (39-year-old female). (B) Patient with transthyretin amyloidosis (84-year-old male).
Figure 3
Figure 3
Population regional root mean squared error (RMSE) in mm between endocardial and epicardial surfaces derived from 3D echocardiography and cardiac magnetic resonance imaging at end-diastole (ED) and end-systole (ES), before and after spatiotemporal mapping. Numbers denote segments of the American Heart Association (AHA) 17-segment model.
Figure 4
Figure 4
Bland–Altman plots showing biases and 95% limits of agreement (LOA), with vertical axes representing differences between 3D echocardiography (3DE) and cardiac magnetic resonance (CMR) imaging, plotted against horizontal axes representing the mean of measures obtained from 3DE and CMR. Left and right columns show comparisons before and after spatiotemporal mapping of 3DE geometries for left ventricular end-diastolic volume (EDV), end-systolic volume (ESV), mass (LVM), ejection fraction (EF), and global longitudinal strain (GLS).
Figure 5
Figure 5
Comparison of volume and strain traces derived from cardiac magnetic resonance (CMR) imaging (dashed lines) and 3D echocardiography (3DE) (solid lines) before and after spatiotemporal mapping over one cardiac cycle from a healthy control subject (38-year-old female).

References

    1. Niederer SA, Lumens J, Trayanova NA. Computational models in cardiology. Nat. Rev. Cardiol. 2019;16(2):100–111. doi: 10.1038/s41569-018-0104-y. - DOI - PMC - PubMed
    1. Wang ZJ, Wang VY, Bradley CP, Nash MP, Young AA, Cao JJ. Left ventricular diastolic myocardial stiffness and end-diastolic myofibre stress in human heart failure using personalised biomechanical analysis. J. Cardiovasc. Transl. Res. 2018;11(4):346–356. doi: 10.1007/s12265-018-9816-y. - DOI - PubMed
    1. Krishnamurthy A, et al. Patient-specific models of cardiac biomechanics. J. Comput. Phys. 2013;244:4–21. doi: 10.1016/j.jcp.2012.09.015. - DOI - PMC - PubMed
    1. Wang VY, Nielsen PMF, Nash MP. Image-based predictive modeling of heart mechanics. Annu. Rev. Biomed. Eng. 2015;17(1):351–383. doi: 10.1146/annurev-bioeng-071114-040609. - DOI - PubMed
    1. Gilbert K, et al. Independent left ventricular morphometric atlases show consistent relationships with cardiovascular risk factors: A UK biobank study. Sci. Rep. 2019;9(1):1130. doi: 10.1038/s41598-018-37916-6. - DOI - PMC - PubMed

Publication types