. 2023 May 19;13(1):8110.
doi: 10.1038/s41598-023-34998-9.

Information load dynamically modulates functional brain connectivity during narrative listening

Affiliations

Information load dynamically modulates functional brain connectivity during narrative listening

Rossana Mastrandrea et al. Sci Rep. .

Abstract

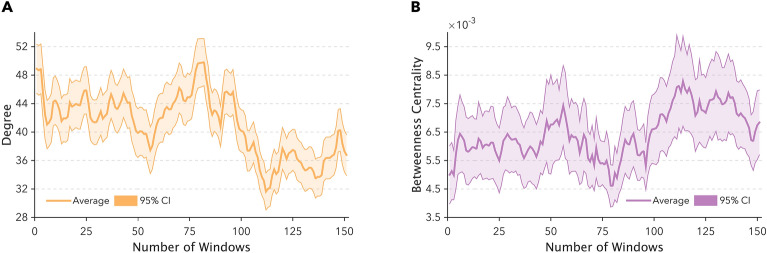
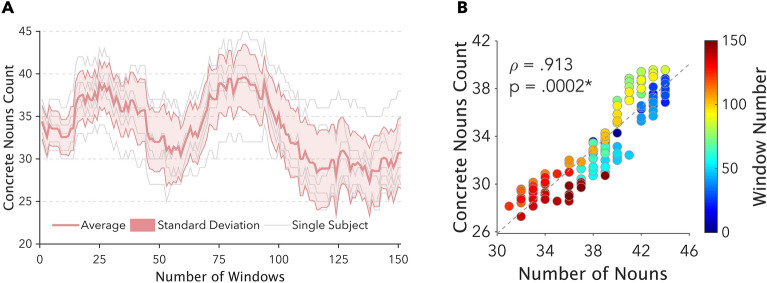
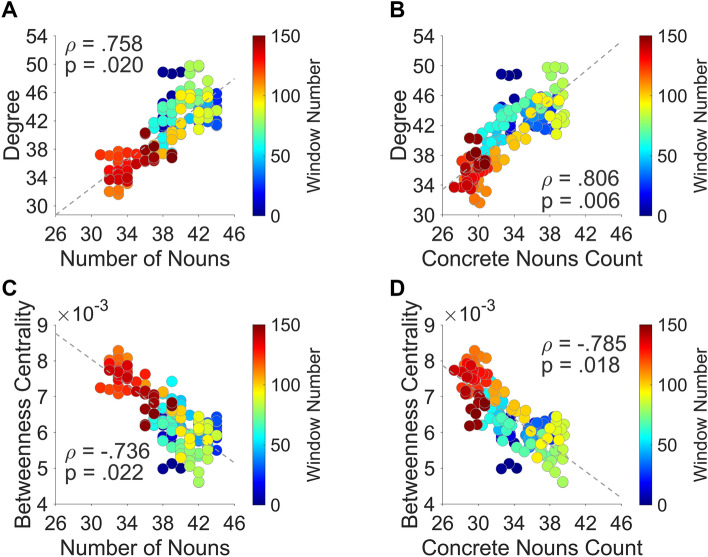
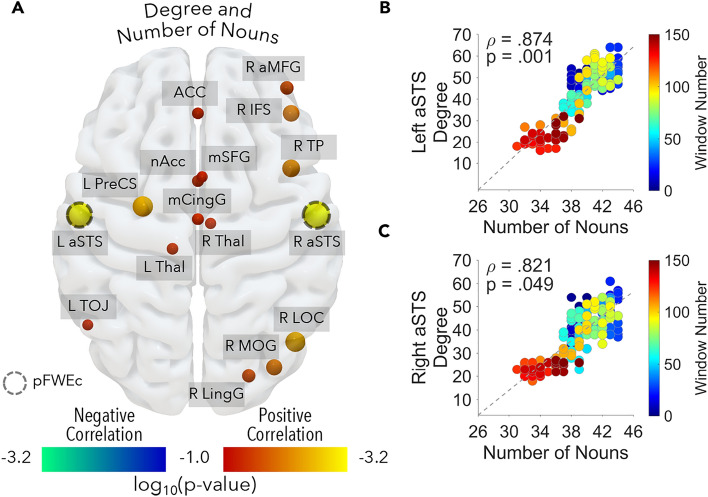
Narratives are paradigmatic examples of natural language, where nouns represent a proxy of information. Functional magnetic resonance imaging (fMRI) studies revealed the recruitment of temporal cortices during noun processing and the existence of a noun-specific network at rest. Yet, it is unclear whether, in narratives, changes in noun density influence the brain functional connectivity, so that the coupling between regions correlates with information load. We acquired fMRI activity in healthy individuals listening to a narrative with noun density changing over time and measured whole-network and node-specific degree and betweenness centrality. Network measures were correlated with information magnitude with a time-varying approach. Noun density correlated positively with the across-regions average number of connections and negatively with the average betweenness centrality, suggesting the pruning of peripheral connections as information decreased. Locally, the degree of the bilateral anterior superior temporal sulcus (aSTS) was positively associated with nouns. Importantly, aSTS connectivity cannot be explained by changes in other parts of speech (e.g., verbs) or syllable density. Our results indicate that the brain recalibrates its global connectivity as a function of the information conveyed by nouns in natural language. Also, using naturalistic stimulation and network metrics, we corroborate the role of aSTS in noun processing.


Conflict of interest statement

The authors declare no competing interests.

Figures

Figure 1
Figure 1
The figure depicts the distribution of syllables, nouns, verbs, and adjectives throughout our original narrative. A sliding-window procedure was applied to individual reports to obtain the overall number of concrete nouns included in 151 partially overlapping windows (60 s duration, 58 s overlap). To allow for a direct comparison of grammatical categories time-series, the number of items in each window is expressed in normalized units (i.e., the number of items for each window minus the minimum number of items across the whole time-series, all divided by the overall range).
Figure 2
Figure 2
This figure represents the timecourse for the two network measures designated to track changes in whole-brain connectivity during narrative listening. Panel (A) shows the timeseries for degree, an attribute reflecting the number of neighbors node averaged between all the 81 ROIs, whereas panel (B) summarizes the temporal profile of betweenness centrality, a marker of whether a node participates in short paths, once again averaged across all the regions. Orange and purple solid lines represent the average timecourse and shaded area reports the 95% confidence interval.
Figure 3
Figure 3
Panel (A) depicts the results for the behavioral experiment: here, the originally written narrative was split into 2 s-lasting segments and subjects were asked to count the number of concrete nouns in each part. The thick red line shows the timecourse of nouns density averaged across all subjects, while the red shaded area represents the standard deviation for this estimate and grey thin lines indicate single-subject data. The similarity between this behavioral estimate of nouns distribution over time and the number of nouns is shown in Panel (B), reporting the significant positive correlation between these measures (p = 0.0002). For each dot, color codes window number.
Figure 4
Figure 4
The figure reports the association between whole-brain connectivity measures and the profile of nouns density over time. Panel (A) represents the positive correlation between degree and the number of nouns included in our original narrative. Panel (B) depicts the relationship between the degree and the number of concrete nouns obtained through behavioral estimates. Panel (C) refers to the negative correlation between betweenness centrality and the number of nouns included in our original narrative whereas panel (D) depicts the association between this network measure and the number of concrete nouns obtained through behavioral estimates. All the reported p values reach statistical significance and survive correction for multiple comparisons according to the FWEc. For each dot, color codes window number.
Figure 5
Figure 5
The figure reports the association between node-specific connectivity measures and the profile of nouns density over time. Panel (A) shows individual regions positively (i.e., log10 p value; red-yellow color map) or negatively (i.e., log10 p value; blue-green color map) associated to the timecourse of nouns (p < 0.05 uncorrected), according to the degree. The larger the sphere is, the higher the correlation; dashed outline indicates regions surviving the correction for multiple comparisons (p < 0.05 FWEc corrected): anterior portion of the left and right superior temporal sulcus. Panel (B) and (C) show the positive correlation between the degree of these two regions and nouns density over time. For each dot, color codes window number. R aMFG = right anterior portion of the middle frontal gyrus; ACC = anterior cingulate cortex; R IFS = right inferior frontal sulcus; R TP = right temporal pole; mSFG = medial portion of the superior frontal gyrus; nAcc = nucleus accumbens; L PreCS = left precentral sulcus; mCingG = middle part of the cingulate gyrus; R Thal = right thalamus; L aSTS = left anterior portion of the superior temporal sulcus; R aSTS = right anterior portion of the superior temporal sulcus; L Thal = left thalamus; L TOJ = left temporo-occipital junction; R LOC = right lateral occipital cortex; R MOG = right middle occipital gyrus; R LingG = right lingual gyrus; R SFS = right superior frontal sulcus; R aINS = right anterior insular cortex; L pMFG = left posterior portion of the middle frontal gyrus; L OFC = left orbitofrontal cortex; R PreCG = right precentral gyrus; L PostCG = left postcentral gyrus.

References

    1. Nummenmaa L, et al. Emotional speech synchronizes brains across listeners and engages large-scale dynamic brain networks. Neuroimage. 2014;102(Pt 2):498–509. doi: 10.1016/j.neuroimage.2014.07.063. - DOI - PMC - PubMed
    1. Kim Y-S. Language and cognitive predictors of text comprehension: Evidence from multivariate analysis. Child Dev. 2015;86:128–144. doi: 10.1111/cdev.12293. - DOI - PubMed
    1. Price CJ. The anatomy of language: A review of 100 fMRI studies published in 2009. Ann. N. Y. Acad. Sci. 2010;1191:62–88. doi: 10.1111/j.1749-6632.2010.05444.x. - DOI - PubMed
    1. Simony E, et al. Dynamic reconfiguration of the default mode network during narrative comprehension. Nat. Commun. 2016;7:12141. doi: 10.1038/ncomms12141. - DOI - PMC - PubMed
    1. Huth AG, de Heer WA, Griffiths TL, Theunissen FE, Gallant JL. Natural speech reveals the semantic maps that tile human cerebral cortex. Nature. 2016;532:453–458. doi: 10.1038/nature17637. - DOI - PMC - PubMed

Publication types