. 2023 May 19;21(1):331.
doi: 10.1186/s12967-023-04180-w.

Inflammatory and interferon gene expression signatures in patients with mitochondrial disease

Affiliations

Inflammatory and interferon gene expression signatures in patients with mitochondrial disease

Emily B Warren et al. J Transl Med. .

Abstract

Background: People with mitochondrial disease (MtD) are susceptible to metabolic decompensation and neurological symptom progression in response to an infection. Increasing evidence suggests that mitochondrial dysfunction may cause chronic inflammation, which may promote hyper-responsiveness to pathogens and neurodegeneration. We sought to examine transcriptional changes between MtD patients and healthy controls to identify common gene signatures of immune dysregulation in MtD.

Methods: We collected whole blood from a cohort of MtD patients and healthy controls and performed RNAseq to examine transcriptomic differences. We performed GSEA analyses to compare our findings against existing studies to identify commonly dysregulated pathways.

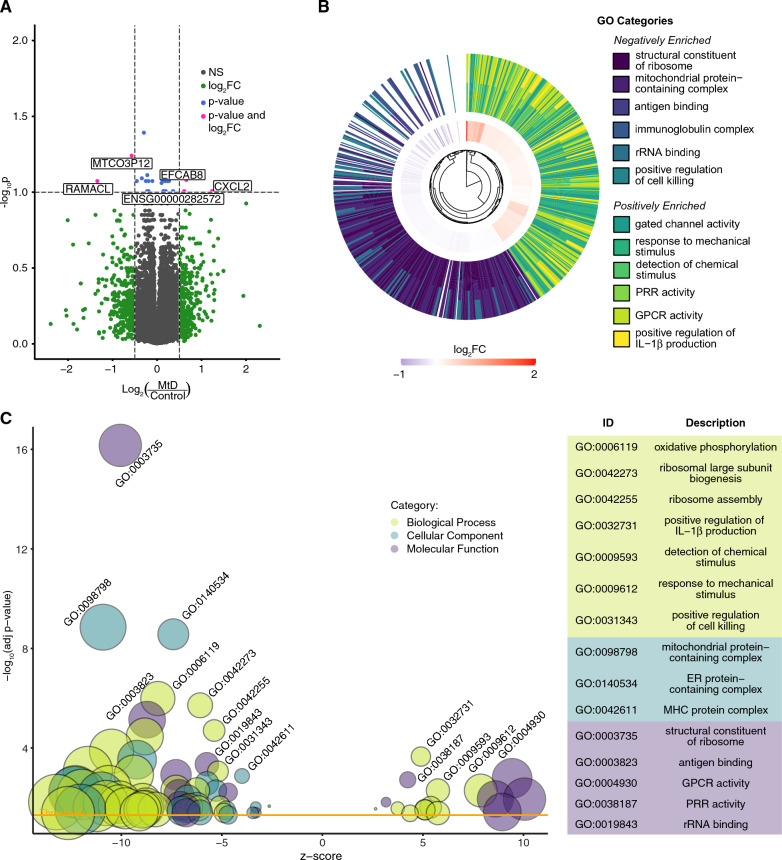
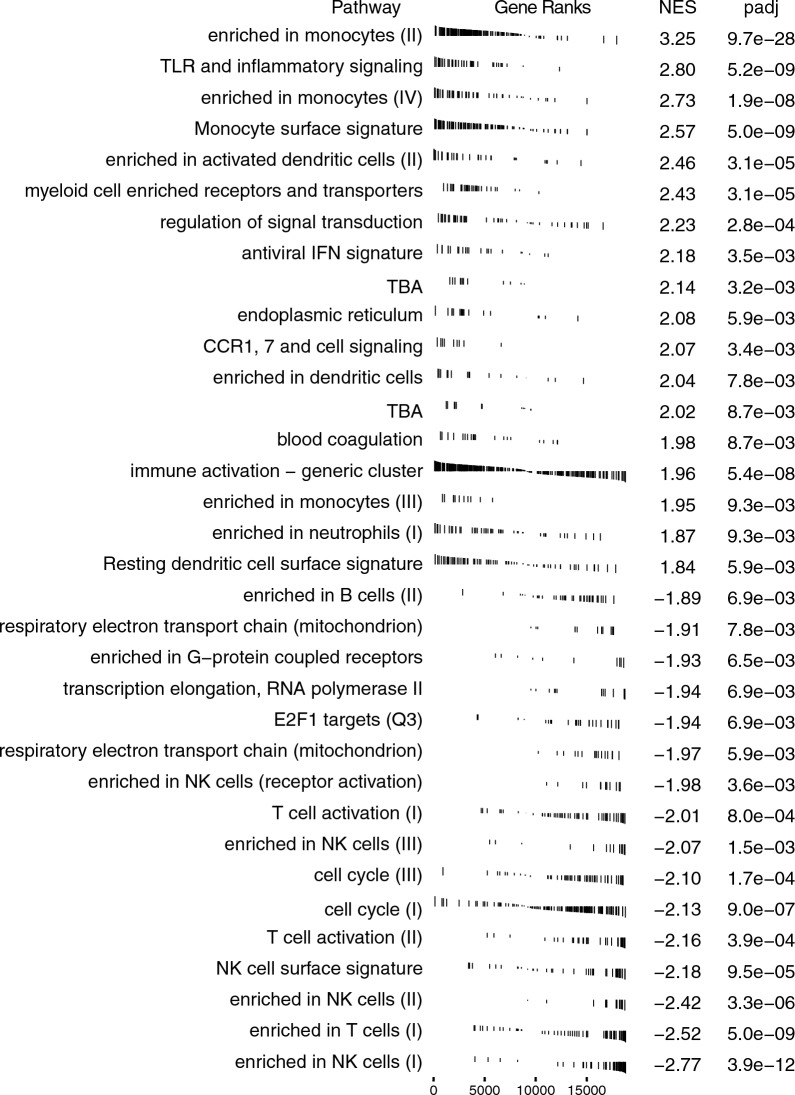
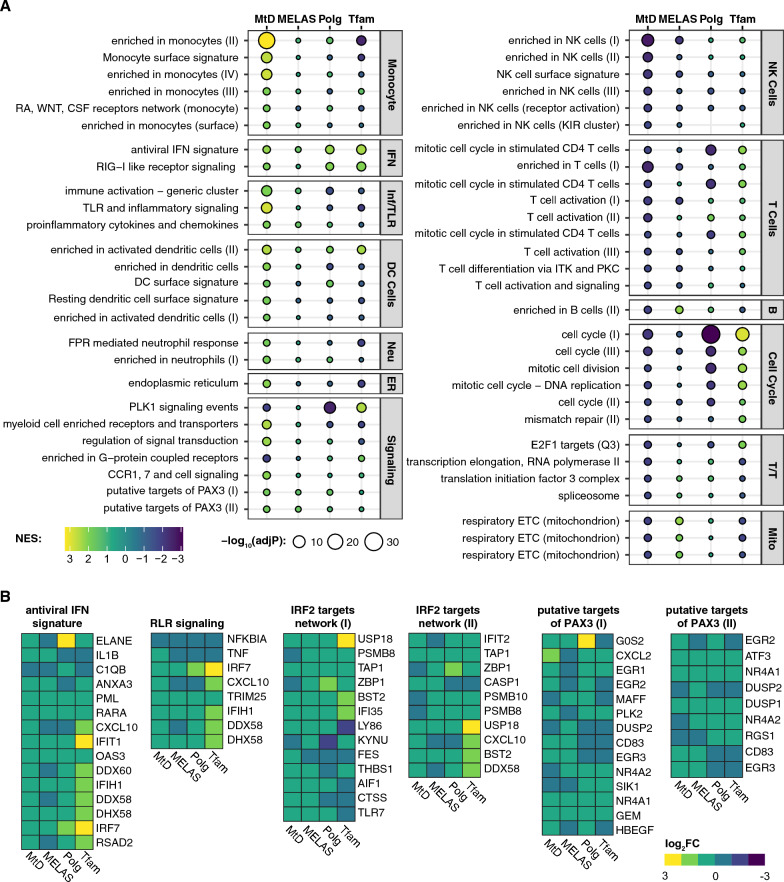
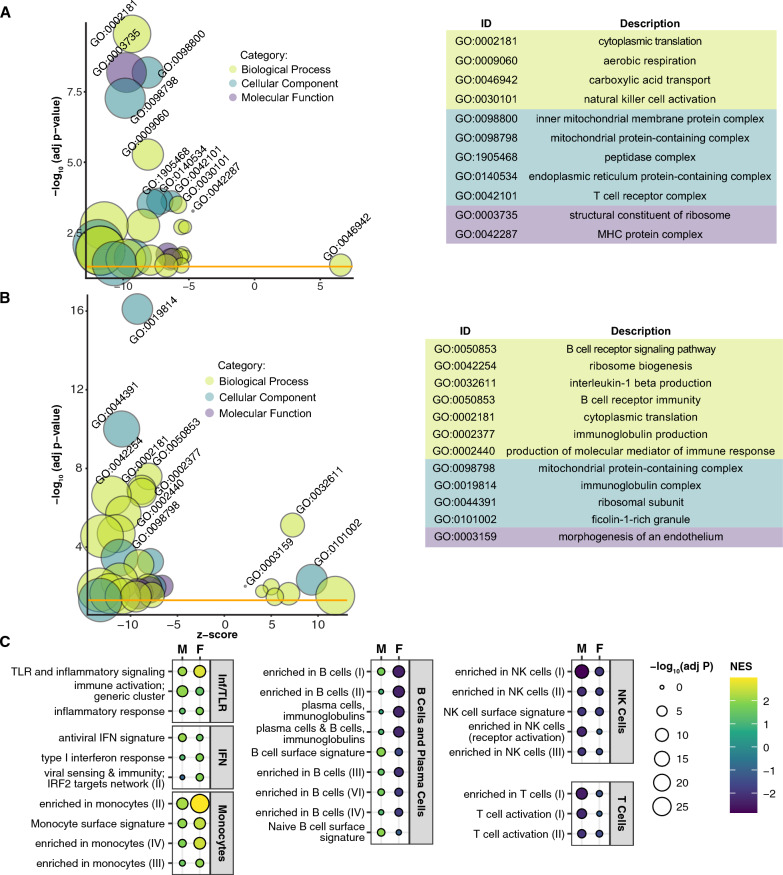
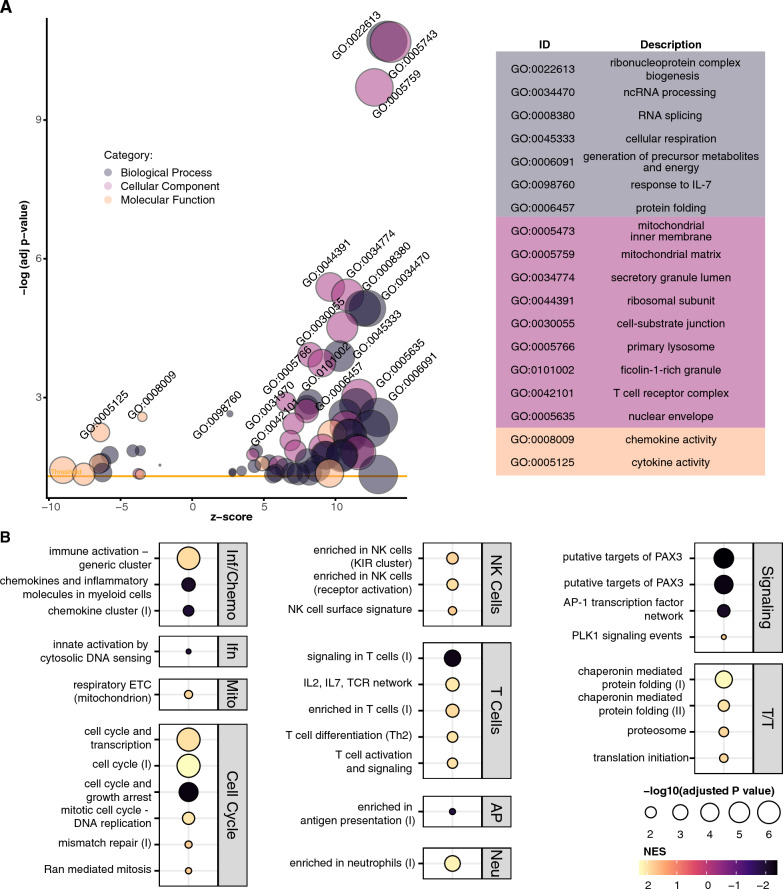
Results: Gene sets involved in inflammatory signaling, including type I interferons, interleukin-1β and antiviral responses, are enriched in MtD patients compared to controls. Monocyte and dendritic cell gene clusters are also enriched in MtD patients, while T cell and B cell gene sets are negatively enriched. The enrichment of antiviral response corresponds with an independent set of MELAS patients, and two mouse models of mtDNA dysfunction.

Conclusions: Through the convergence of our results, we demonstrate translational evidence of systemic peripheral inflammation arising from MtD, predominantly through antiviral response gene sets. This provides key evidence linking mitochondrial dysfunction to inflammation, which may contribute to the pathogenesis of primary MtD and other chronic inflammatory disorders associated with mitochondrial dysfunction.

Keywords: Anti-viral signaling; Inflammation; Interferon; Mitochondrial disease; PBMCs.


Conflict of interest statement

The authors declare that they have no competing interests.

Figures

Fig. 1
Fig. 1
GSEA demonstrates that MtD patients have a positive enrichment in immune activation-associated pathways. A Volcano plot of differential expression analysis between MtD (n = 31) and control participants (n = 48). Log2FC threshold shown >|0.5|, adjusted p value threshold shown at 0.1. B Circular hierarchical cluster plot of top six most significant positive and negative GO categories and associated genes. Inner ring represents log2FC of genes belonging to all twelve categories. Outer ring illustrates the GO functional annotation of each gene. C Bubble plot of significant GO terms following GSEA analysis and reduction to consolidate redundant terms. Bubble size reflects the size of the gene set, while bubble color reflects the GO category of each set. Z score is derived from the comparison of upregulated and downregulated genes in the set. Yellow line indicates the significance threshold of adjusted p < 0.05. For clarity, only a subset of positive and negative enrichment sets is labeled (see Additional file 3: Table S2 for a full list)
Fig. 2
Fig. 2
Blood transcriptional module gene ranks. GSEA plots of consolidated BTMs illustrating gene ranks in each transcription set. Left-shifted genes have a positive fold change and are found at the beginning of the gene rank list (positive enrichment), while right-shifted genes have a negative fold change and are found at the end of the gene list (negative enrichment). NES and adjusted p value (padj) for each consolidated BTM indicated at right
Fig. 3
Fig. 3
BTM enrichment of MtD patients, MELAS patients, and comparable mouse models of MtD. A NES plot of significant BTMs identified in MtD patients. Bubble size represents adjusted p value, bubble color represents normalized enrichment score (NES). Corresponding results from MELAS, Polg, and Tfam GSEA analysis are shown. Modules are grouped into categories shown at right. IFN: interferon; Inf/TLR: Inflammation and Toll-like receptor signaling; Neu: Neutrophils; B: B cells; T/T: Transcription/Translation; Mito: mitochondrion. See Additional file 4: Table S3 for full results. B Log2FC of genes from indicated modules
Fig. 4
Fig. 4
Male and female MtD patients show differential enrichment of immune and inflammatory gene sets. A Bubble plot of male controls (n = 22) and MtD patients (n = 16), B of female controls (n = 27) and MtD patients (n = 16) shows significant GO terms following GSEA analysis and consolidation of redundant terms. A, B Bubble size reflects the size of the gene set, while bubble color reflects the GO category of each set. Z score is derived from the comparison of upregulated and downregulated genes in the set. Yellow line indicates the significance threshold of adjusted p < 0.05. See Additional file 3: Table S2 for a full list of significant GO terms. C NES plots from selected modules from males (M) and females (F). Bubble size reflects adjusted p value, bubble color reflects NES. Modules are grouped into categories shown at right. IFN; interferon, Inf/TLR; Inflammation and Toll-like receptor signaling. See Additional file 4: Table S3 for full results from all datasets
Fig. 5
Fig. 5
Positive enrichment of mitochondrial, NK cell, and T cell gene sets in MtD patients treated with MitoCocktail. GSEA analysis of MtD patients treated with MitoCocktail (n = 22) against MtD patients not undergoing treatment (n = 9). A Bubble plot of significant GO terms in treated MtD patients following GSEA analysis and reduction to consolidate redundant terms. Bubble size reflects the size of the gene set, while bubble color reflects the GO category of each set. Z score is derived from the comparison of upregulated and downregulated genes in the set. Yellow line indicates the significance threshold of adjusted p < 0.05. For clarity, only a subset of positive and negative enrichment sets is labeled (see Additional file 3: Table S2 for a full list). B NES plot of a subset of significant BTMs identified in treated MtD patients. Bubble size represents adjusted p value, bubble color represents normalized enrichment score (NES). Modules are grouped into categories shown at right. Inf/Chemo: Inflammation and Chemokines; Ifn: Interferon/Antiviral Sensing; Neu: Neutrophils; Mito: mitochondrion; T/T: Transcription/Translation. See Additional file 4: Table S3 for full results

Update of

References

    1. Edgar D, Shabalina I, Camara Y, Wredenberg A, Calvaruso MA, Nijtmans L, et al. Random point mutations with major effects on protein-coding genes are the driving force behind premature aging in mtDNA mutator mice. Cell Metab. 2009;10(2):131–138. doi: 10.1016/j.cmet.2009.06.010. - DOI - PubMed
    1. Lei Y, Guerra Martinez C, Torres-Odio S, Bell SL, Birdwell CE, Bryant JD, et al. Elevated type I interferon responses potentiate metabolic dysfunction, inflammation, and accelerated aging in mtDNA mutator mice. Sci Adv. 2021;7(22):eabe7548. doi: 10.1126/sciadv.abe7548. - DOI - PMC - PubMed
    1. Jin Z, Wei W, Yang M, Du Y, Wan Y. Mitochondrial complex I activity suppresses inflammation and enhances bone resorption by shifting macrophage-osteoclast polarization. Cell Metab. 2014;20(3):483–498. doi: 10.1016/j.cmet.2014.07.011. - DOI - PMC - PubMed
    1. Yu AK, Song L, Murray KD, van der List D, Sun C, Shen Y, et al. Mitochondrial complex I deficiency leads to inflammation and retinal ganglion cell death in the Ndufs4 mouse. Hum Mol Genet. 2015;24(10):2848–2860. doi: 10.1093/hmg/ddv045. - DOI - PMC - PubMed
    1. Marchi S, Guilbaud E, Tait SWG, Yamazaki T, Galluzzi L. Mitochondrial control of inflammation. Nat Rev Immunol. 2022;23:1–15. - PMC - PubMed

Publication types