. 2023 Aug;14(4):1707-1720.
doi: 10.1002/jcsm.13251. Epub 2023 May 20.

Androgen receptor coordinates muscle metabolic and contractile functions

Affiliations

Androgen receptor coordinates muscle metabolic and contractile functions

Kamar Ghaibour et al. J Cachexia Sarcopenia Muscle. 2023 Aug.

Abstract

Background: Androgens are anabolic steroid hormones that exert their function by binding to the androgen receptor (AR). We have previously established that AR deficiency in limb muscles impairs sarcomere myofibrillar organization and decreases muscle strength in male mice. However, despite numerous studies performed in men and rodents, the signalling pathways controlled by androgens via their receptor in skeletal muscles remain poorly understood.

Methods: Male ARskm-/y (n = 7-12) and female ARskm-/- mice (n = 9), in which AR is selectively ablated in myofibres of musculoskeletal tissue, and male AR(i)skm-/y , in which AR is selectively ablated in post-mitotic skeletal muscle myofibres (n = 6), were generated. Longitudinal monitoring of body weight, blood glucose, insulin, lipids and lipoproteins was performed, alongside metabolomic analyses. Glucose metabolism was evaluated in C2C12 cells treated with 5α-dihydrotestosterone (DHT) and the anti-androgen flutamide (n = 6). Histological analyses on macroscopic and ultrastructural levels of longitudinal and transversal muscle sections were conducted. The transcriptome of gastrocnemius muscles from control and ARskm-/y mice was analysed at the age of 9 weeks (P < 0.05, 2138 differentially expressed genes) and validated by RT-qPCR analysis. The AR (4691 peaks with false discovery rate [FDR] < 0.1) and H3K4me2 (47 225 peaks with FDR < 0.05) cistromes in limb muscles were determined in 11-week-old wild-type mice.

Results: We show that disrupting the androgen/AR axis impairs in vivo glycolytic activity and fastens the development of type 2 diabetes in male, but not in female mice. In agreement, treatment with DHT increases glycolysis in C2C12 myotubes by 30%, whereas flutamide has an opposite effect. Fatty acids are less efficiently metabolized in skeletal muscles of ARskm-/y mice and accumulate in cytoplasm, despite increased transcript levels of genes encoding key enzymes of beta-oxidation and mitochondrial content. Impaired glucose and fatty acid metabolism in AR-deficient muscle fibres is associated with 30% increased lysine and branched-chain amino acid catabolism, decreased polyamine biosynthesis and disrupted glutamate transamination. This metabolic switch generates ammonia (2-fold increase) and oxidative stress (30% increased H2 O2 levels), which impacts mitochondrial functions and causes necrosis in <1% fibres. We unravel that AR directly activates the transcription of genes involved in glycolysis, oxidative metabolism and muscle contraction.

Conclusions: Our study provides important insights into diseases caused by impaired AR function in musculoskeletal system and delivers a deeper understanding of skeletal muscle pathophysiological dynamics that is instrumental to develop effective treatment for muscle disorders.

Keywords: androgen receptor; genomics; metabolism; skeletal muscle; type 2 diabetes.


Conflict of interest statement

None declared.

Figures

Figure 1
Figure 1
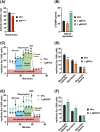
Role of myofibre androgen receptor (AR) in glucose metabolism of male mice (see also Figures S1S3 ). (A, B) Representative western blot analysis (A) and quantification (B) of AR and hexokinase 2 (HK2) protein levels in gastrocnemius muscle of 9‐ to 35‐week‐old C57BL/6J male mice. GAPDH was used as a loading control. n = 2–3 mice per time point. Western blot performed in duplicate. (B) Mean + SEM. (C–F) Basal blood glucose levels (C), intraperitoneal glucose tolerance test (IPGTT) (D), blood insulin levels (E) and intraperitoneal insulin sensitivity test (IPIST) (F) of control (Ctrl) and ARskm−/y mice at indicated ages. The areas under the curve (AUCs) of IPGTT and IPIST experiments are presented next to each panel. (C) n = 8 Ctrl and 12 ARskm−/y mice. (D, F) n = 7 Ctrl and ARskm−/y mice. (E) n = 7 Ctrl and 12 ARskm−/y mice at 15 weeks, and n = 12 Ctrl and 8 ARskm−/y mice at 25 weeks. (C, E) Mean + SEM. (D, F) Mean ± SEM. (C, E) Two‐tailed t‐test. (D, F) Two‐way ANOVA with Sidak's correction. *P < 0.05, **P < 0.01 and ***P < 0.001.
Figure 2
Figure 2
Role of androgen receptor (AR) in myofibre glycolytic activity (see also Figure S4 ). (A) Hexokinase activity in quadriceps muscles of control and ARskm−/y mice at 15 weeks of age. n = 4. Mean + SEM. Two‐tailed Mann–Whitney test. ***P < 0.001. (B–F) 2‐Deoxyglucose (2‐DG) uptake (B), representative extracellular acidification rate (ECAR) (C, E) and maximal glycolytic capacity, glycolysis and glycolytic reserve deduced from ECAR (D, F) in C2C12 myotubes treated with 1 μM of flutamide (Flu), 1 μM of 5α‐dihydrotestosterone (DHT) or with vehicle (Vhc). (B) n = 3, (C–F) n = 6. (B, D, F) Mean + SEM. (C, E) Mean ± SEM. (B) One‐way ANOVA with Dunnett's correction. (C, E) Two‐way ANOVA with Sidak's correction. (D, F) Two‐tailed t‐test. *P < 0.05, **P < 0.01 and ***P < 0.001.
Figure 3
Figure 3
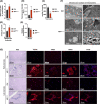
Role of myofibre androgen receptor (AR) in fatty acid metabolism (see also Figure S5 ). (A) Blood free fatty acid (FFA) content in control (Ctrl) and ARskm−/y mice at indicated ages. n = 7 Ctrl and 12 ARskm−/y mice at 15 weeks, and n = 12 Ctrl and 8 ARskm−/y mice at 25 weeks. Mean + SEM. Two‐way ANOVA with Sidak's correction. #Non‐significant, **P < 0.01 and ***P < 0.001. (B) Relative transcript levels of indicated genes in gastrocnemius muscles of 15‐week‐old Ctrl and ARskm−/y mice. n = 6 mice, mean + SEM, two‐tailed t‐test. *P < 0.05 and ***P < 0.001. (C) Quantification of mitochondrial content in quadriceps muscles of 15‐week‐old Ctrl and ARskm−/y mice by qPCR amplification of the Cox2 mitochondrial‐encoded gene and the Myog nuclear‐encoded gene. n = 6 mice. Mean + SEM. Two‐tailed t‐test. *P < 0.05. (D) Representative ultrastructure of tibialis muscles of 15‐week‐old Ctrl and ARskm−/y mice. White arrowheads show lipid accumulation and black arrowheads point to mitochondria. Scale bar: 2 μm. n = 10 mice, 10 fields per mouse. (E, F) Distribution (E) and average (F) of mitochondrial cross‐section area in tibialis muscles of 15‐week‐old Ctrl and ARskm−/y mice. n = 4 mice, 4 fields per mouse. (E, F) Mean + SEM. (E) Two‐way ANOVA with Sidak's correction. (F) Two‐tailed Mann–Whitney test. *P < 0.05 and **P < 0.01.
Figure 4
Figure 4
Role of myofibre androgen receptor (AR) in oxidative metabolism (see also Figure S5 ). (A) Relative transcript levels of indicated genes in gastrocnemius muscles of 15‐week‐old control (Ctrl) and ARskm−/y mice. n = 6 mice. Mean + SEM. Two‐tailed t‐test. *P < 0.05 and **P < 0.01. (B) Lipoprotein lipase (LPL) activity in quadriceps muscles of Ctrl and ARskm−/y mice at 15 weeks of age. n = 4 mice. Mean + SEM. Two‐tailed Mann–Whitney test. ***P < 0.001. (C) Free carnitine levels in gastrocnemius muscles of 15‐week‐old Ctrl and ARskm−/y mice. n = 3 mice. Mean + SEM. Two‐tailed Mann–Whitney test. *P < 0.05. (D, E) Representative western blot analysis of total and phosphorylated acetyl‐CoA carboxylases (ACCs) (D), corresponding protein quantification and ratio between the phosphorylated and total ACC protein contents (E) in gastrocnemius muscle of 15‐week‐old Ctrl and ARskm−/− mice. GAPDH was used as a loading control. n = 7 mice. Mean + SEM. Two‐tailed t‐test. *P < 0.05 and ***P < 0.001. (F) Representative ultrastructure of gastrocnemius muscles of 15‐week‐old Ctrl and ARskm−/y mice. White arrowheads show lipid accumulation and black arrowheads point to mitochondria. Scale bar: 2 μm. n = 10 mice, 10 fields per mouse.
Figure 5
Figure 5
Impact of myofibre androgen receptor (AR) deficiency on amino acid metabolism and mitochondrial functions (see also Figure S6 ). (A) Level of indicated amino acids in gastrocnemius muscles of 15‐week‐old control (Ctrl) and ARskm−/y mice. n = 3 mice. Mean + SEM. Two‐tailed Mann–Whitney test. *P < 0.05 and # P = 0.1. (B) Relative transcript levels of the indicated genes in gastrocnemius muscles of 15‐week‐old Ctrl and ARskm−/y mice. n = 6 mice. Mean + SEM. Two‐tailed t‐test. *P < 0.05, **P < 0.01 and ***P < 0.001. (C, D) Level of glutamic acid (C) and ammonium (D) in gastrocnemius muscles of 15‐week‐old Ctrl and ARskm−/y mice. (C) n = 3 mice, (D) n = 6 mice. Mean + SEM. (C) Two‐tailed Mann–Whitney test. (D) Two‐tailed t‐test. *P < 0.05. (E) Oxygen consumption in saponin‐skinned gastrocnemius fibres of 15‐week‐old Ctrl and ARskm−/y mice in the presence of ADP (Vadp), succinate (Vsucc, maximal respiration) and rotenone (Vrot, respiration via complex II). n = 6 mice. Mean + SEM. Two‐tailed t‐test. *P < 0.05, **P < 0.01 and ***P < 0.001. (F) Representative histochemical staining of COX activity in quadriceps muscle of 15‐week‐old Ctrl and ARskm−/y mice. Oxidative and intermediate fibres are darkly and moderately stained, respectively; glycolytic fibres are lightly stained. Scale bar: 500 μm. n = 6 mice, 3 fields per mouse.
Figure 6
Figure 6
Impact of androgen receptor (AR) deficiency in myofibres on oxidative stress and fibre viability (see also Figure S6 ). (A, B) Measurement of H2O2 production relative to oxygen consumption determined in the presence of ADP (A) and fluorescent detection of reactive oxygen species (ROS) production by quantification of dihydroethidium (DHE) staining intensity (B) on gastrocnemius fibres of 15‐week‐old control (Ctrl) and ARskm−/y mice. n = 6 mice. Mean + SEM. (B) Thirty fields per mouse. Two‐tailed t‐test. **P < 0.01. (C, D) Level of carnosine (C) and methionine sulfoxide (D) in gastrocnemius muscles of 15‐week‐old Ctrl and ARskm−/y mice. n = 3 mice. Mean + SEM. Two‐tailed Mann–Whitney test. *P < 0.05 and ***P < 0.001. (E) Relative Msrb3 transcript levels in gastrocnemius muscles of 15‐week‐old Ctrl and ARskm−/y mice. n = 6 mice. Mean + SEM. Two‐tailed t‐test. ***P < 0.001. (F) Representative ultrastructure of quadriceps muscle of 15‐week‐old Ctrl and ARskm−/y mice. Black, red, blue and white arrowheads show normal mitochondria, megamitochondria, mitochondria swelling and cristae loss, respectively; white arrow shows necrotic nucleus. Scale bar: 500 nm and 2 μm, as indicated. n = 10 mice, 10 fields per mouse. (G) Representative haematoxylin and eosin (H&E) staining, and PUMA, FADD, RIPK1 and F4/80 immunofluorescent detection with DAPI‐stained nuclei of quadriceps muscles of 15‐week‐old Ctrl and ARskm−/y mice. Scale bars: 75 and 150 μm, as indicated. n = 5 mice, 10 fields per mouse.
Figure 7
Figure 7
Analysis of androgen receptor (AR) functional targets in skeletal muscle (see also Figures S7 and S8 ). (A) Pathway analysis of genes up‐regulated in gastrocnemius muscle of 9‐week‐old ARskm−/y mice. (B–D) Heatmap depicting the mean centred normalized expression of genes involved in branched‐chained amino acid (BCAA) and lysine metabolism (B), fatty acid synthesis and beta‐oxidation (C), glutamine and polyamine metabolism (D), obtained by RNA‐seq analysis performed on gastrocnemius muscle of 9‐week‐old control (Ctrl) and ARskm−/y mice. Genes significantly up‐regulated and down‐regulated in ARskm−/y mice are marked in red and green, respectively. (E) Pathway analysis of genes down‐regulated in gastrocnemius muscle of 9‐week‐old ARskm−/y mice. (F) Heatmaps depicting the mean centred normalized expression of genes involved in glycolysis obtained by RNA‐seq analysis performed on gastrocnemius muscle of 9‐week‐old Ctrl and ARskm−/y mice. Genes significantly down‐regulated in ARskm−/y mice are marked in green.
Figure 8
Figure 8
Characterization of androgen receptor (AR) cistrome in skeletal muscle (see also Figure S9 ). (A) Pie chart depicting the AR peak distribution in the genome of skeletal muscles. TSS, transcription start site; TTS, transcription termination site; UTR, untranslated region. (B) HOMER known motif analysis of AR‐bound DNA sequences in skeletal muscles. (C) Cumulative number of genes down‐regulated in ARskm−/y mice with an AR peak at indicated distances from their TSS. (D) Localization of AR and H3K4me2 at the Acat1 locus. The AR‐response element is shown in red. (E) Representative immunofluorescent detection of the RYR1 (red) and DHPRB (green) in tibialis muscles of 15‐week‐old control (Ctrl) and ARskm−/y mice. Nuclei are stained with DAPI. Scale bar: 10 μm. n = 4 mice, 3 fields per mouse. (F) Representative ultrastructure of tibialis sarcomeres from 15‐week‐old Ctrl and ARskm−/y mice. White arrow points to a T‐tubule. Black arrows show the Z‐line. Scale bar: 500 nm. n = 10 mice, 10 fields per mouse.

References

    1. Schiaffino S. Fibre types in skeletal muscle: a personal account. Acta Physiol (Oxf) 2010;199:451–463. - PubMed
    1. Handschin C, Chin S, Li P, Liu F, Maratos‐Flier E, LeBrasseur NK, et al. Skeletal muscle fiber‐type switching, exercise intolerance, and myopathy in PGC‐1α muscle‐specific knock‐out animals. J Biol Chem 2007;282:30014–30021. - PubMed
    1. Figueiredo PA, Powers SK, Ferreira RM, Amado F, Appell HJ, Duarte JA. Impact of lifelong sedentary behavior on mitochondrial function of mice skeletal muscle. J Gerontol A Biol Sci Med Sci 2009;64:927–939. - PMC - PubMed
    1. Porter C, Hurren NM, Cotter MV, Bhattarai N, Reidy PT, Dillon EL, et al. Mitochondrial respiratory capacity and coupling control decline with age in human skeletal muscle. Am J Physiol Endocrinol Metab 2015;309:E224–E232. - PMC - PubMed
    1. Duteil D, Chambon C, Ali F, Malivindi R, Zoll J, Kato S, et al. The transcriptional coregulators TIF2 and SRC‐1 regulate energy homeostasis by modulating mitochondrial respiration in skeletal muscles. Cell Metab 2010;12:496–508. - PMC - PubMed

Publication types