. 2023 May 18;4(2):102291.
doi: 10.1016/j.xpro.2023.102291. Online ahead of print.

Quantification of virus-infected cells using RNA FISH-Flow

Affiliations

Quantification of virus-infected cells using RNA FISH-Flow

Cody J Warren et al. STAR Protoc. .

Abstract

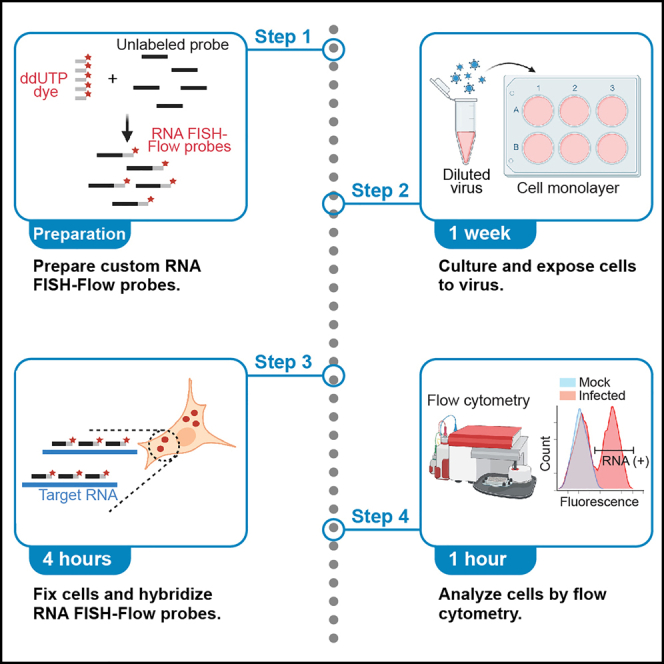
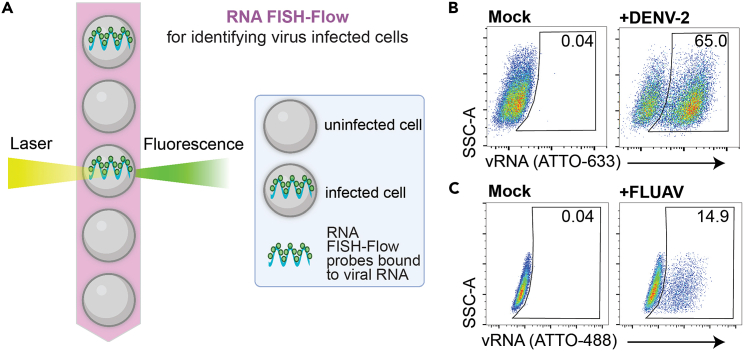
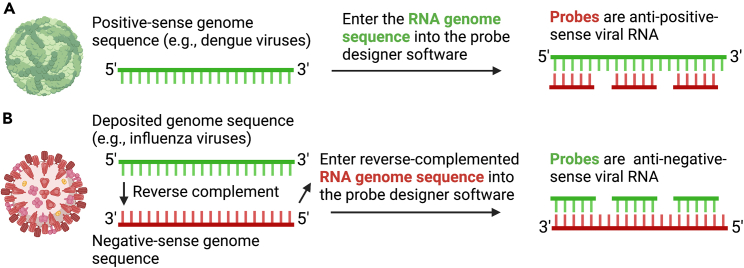
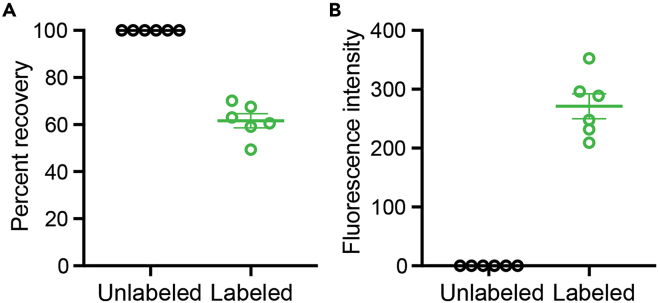
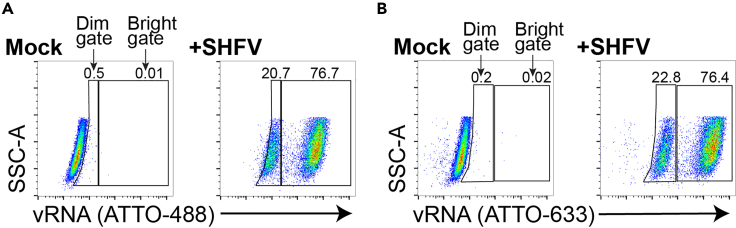
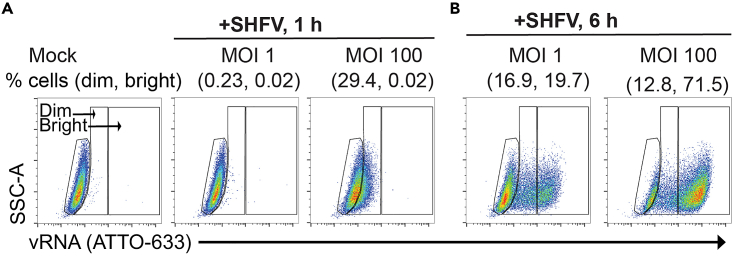
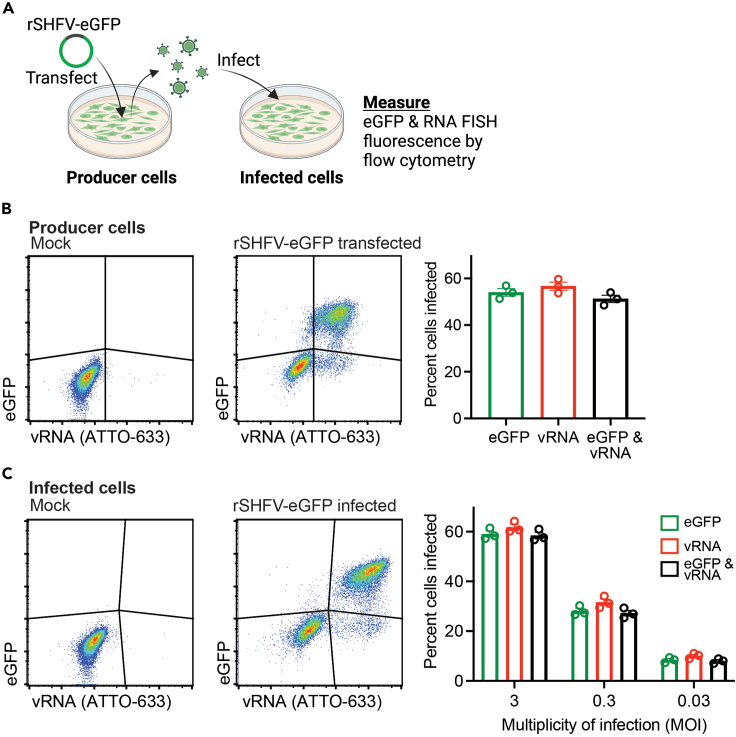
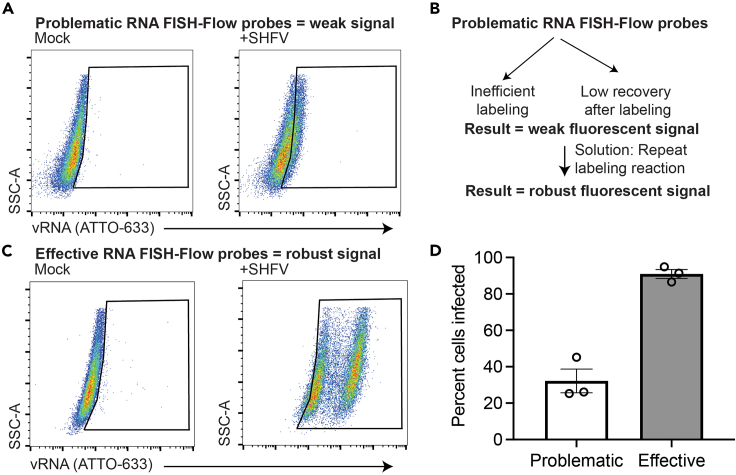
We present a protocol to detect cells that have been infected by RNA viruses. The method, RNA fluorescence in situ hybridization flow cytometry (RNA FISH-Flow), uses 48 fluorescently labeled DNA probes that hybridize in tandem to viral RNA. RNA FISH-Flow probes can be synthesized to match any RNA virus genome, in either sense or anti-sense, enabling detection of genomes or replication intermediates within cells. Flow cytometry enables high-throughput analysis of infection dynamics within a population at the single cell level. For complete details on the use and execution of this protocol, please refer to Warren et al. (2022).1.

Keywords: In Situ Hybridization; Microbiology; Molecular Biology.


Conflict of interest statement

Declaration of interests S.L.S. and Q.Y. are co-founders of Darwin Biosciences.

Figures

None
Graphical abstract
Figure 1
Figure 1
RNA FISH-Flow enables highly sensitive detection of virus infected cells by flow cytometry (A) Cartoon schematic of cells passing in single file through a flow cytometer machine. When fluorescently labeled RNA FISH-Flow probes, bound to viral RNA (vRNA), are excited by a laser, they emit a fluorescent signal that is then recorded by highly sensitive detectors. (B) A549 cells were infected with dengue virus 2 (DENV-2; strain 166812) at a multiplicity of infection (MOI) of 0.5. (C) MDCK cells were infected with influenza A virus (FLUAV; A/H3N2/Udorn/723) at an MOI of 0.1. Samples in (B) were hybridized with a DENV-2 NS5-specific ATTO-633 probe set and (C) were hybridized with a FLUAV segment 2-specific ATTO-488 probe set. All flow-cytometric events were first gated on forward vs side scatter (FSC-A × SSC-A) properties, followed by singlet discrimination. All gates were drawn based on mock-treated cells, and the percentage of cells positive for vRNA were derived.
Figure 2
Figure 2
Strategy for RNA FISH-Flow probe design By convention, for RNA viruses, the sequences deposited in databases (e.g., GenBank) are entered as the coding (positive-sense) strand, using Ts instead of Us. To design RNA FISH-Flow probes to a specific RNA virus genome, the probes must have a complementary sequence to the actual target RNA molecule. The design tool replaces any Us with Ts if they are in the input sequence. (A) Database sequences that are deposited for positive-sense RNA viruses (e.g., dengue viruses) are already in coding strand, and thus RNA FISH-Flow probes designed anti-sense to the target sequence will hybridize. (B) However, for detection of negative-sense viruses (e.g., influenza viruses), the database sequence must first be reverse-complemented. Only then will the designed RNA FISH-Flow probes hybridize to the negative-sense genome target.
Figure 3
Figure 3
Recovery and labeling efficiency of purified RNA FISH-Flow probes Six independent oligonucleotide pools were designed and ATTO-488 labeled (or not) as described in the “probe design” and “probe labeling” sections. (A) Single-stranded DNA (ssDNA) concentrations of labeled and unlabeled RNA FISH-Flow probe mixtures were determined using a Nanodrop instrument. The percent recovery was calculated for each matched pair (n = 6). (B) Raw fluorescence values were acquired with a Synergy LX analyzer and the Take3 accessory. A ssDNA concentration corrected fluorescence intensity value was calculated for each labeled and unlabeled RNA FISH-Flow probe mixture. Consistently, RNA FISH-Flow probe labeling resulted in higher fluorescence intensity values compared to unlabeled probe mixtures. Data are shown as the mean ± SEM from six independent pairs of labeled and unlabeled RNA FISH-Flow probe mixtures.
Figure 4
Figure 4
Example of results at 24 h post-exposure to virus MA-104 cells were exposed to simian hemorrhagic fever virus (SHFV) at a multiplicity of infection (MOI) of 3. At 24 h post-exposure, the cells were harvested and analyzed with RNA fluorescence in situ hybridization flow cytometry (RNA FISH-Flow). (A and B) Samples in (A) were hybridized with an SHFV ORF1a-specific ATTO-488 probe set and those in (B) were hybridized with the same probe set that was alternatively labeled with ATTO-633. All flow-cytometric events were first gated on forward vs side scatter (FSC-A × SSC-A) properties, followed by singlet discrimination. All gates were drawn based on mock-treated cells, and the percentage of cells positive for viral RNA (vRNA) in the dim and bright gates were derived.
Figure 5
Figure 5
Example of results from cells infected with different MOIs over a time course (A and B) MA-104 cells were exposed to simian hemorrhagic fever virus (SHFV) at a multiplicity of infection (MOI) of 1 or 100. At time points of (A) 1 h and (B) 6 h post-exposure, the cells were harvested and analyzed with RNA fluorescence in situ hybridization flow cytometry (RNA FISH-Flow). Samples were hybridized with an SHFV ORF1a-specific ATTO-663 probe set. All flow-cytometric events were first gated on forward vs side scatter (FSC-A × SSC-A) properties, followed by singlet discrimination. All gates were drawn based on mock-infected cells, and the percentage of cells positive for viral RNA (vRNA) in the dim and bright gates were derived. This figure has been adapted from previous work.
Figure 6
Figure 6
Comparison of RNA fluorescence in situ hybridization flow cytometry (RNA FISH-Flow) and standard flow cytometry using a recombinant infectious SHFV reporter virus clone (A) Schematic of the experimental setup to compare virus-encoded eGFP and RNA FISH-Flow measurements using cells transfected with a recombinant simian hemorrhagic fever virus expressing eGFP (rSHFV-eGFP)-encoding cDNA launch plasmid (producer cells) and cells infected with rSHFV-eGFP (infected cells). (B and C) (B) MA-104 cells were transfected with rSHFV-eGFP-encoding plasmid or (C) exposed to rSHFV-eGFP and then processed for RNA FISH-Flow 72 h after plasmid transfection or 24 h after virus exposure. (B and C) All flow-cytometric events were first gated on forward vs side scatter (FSC-A × SSC-A) properties, followed by singlet discrimination. All gates were drawn based on mock-treated cells, and the percentage of cells positive for viral RNA (vRNA) and enhanced green fluorescent protein (eGFP) were derived. The data show the mean ± SEM from three biological replicates.
Figure 7
Figure 7
Example of results demonstrating weak signal and possible solutions (A) MA-104 cells were exposed to wild-type SHFV at a multiplicity of infection (MOI) of 3. Cells were harvested 24 h after exposure and processed for RNA FISH-Flow. Flow cytometric analysis of virus-infected cells revealed a weak shift in fluorescence. (B) This weak signal may be due to inefficient labeling or poor RNA FISH-Flow probe recovery after labeling. Ultimately, we repeated the labeling reaction. (C) The infection experiment was repeated as described in “A.” This newly labeled RNA FISH-Flow probe set exhibited robust viral RNA (vRNA) detection as indicated by a robust shift in fluorescence intensity. (A and C) All flow-cytometric events were first gated on forward vs side scatter (FSC-A × SSC-A) properties, followed by singlet discrimination. (D) All gates were drawn based on mock-exposed cells, and (D) the percentage of cells positive for viral RNA (vRNA) were derived. The data show the mean ± SEM from three biological replicates.

Similar articles

Cited by

References

    1. Warren C.J., Yu S., Peters D.K., Barbachano-Guerrero A., Yang Q., Burris B.L., Worwa G., Huang I.-C., Wilkerson G.K., Goldberg T.L., et al. Primate hemorrhagic fever-causing arteriviruses are poised for spillover to humans. Cell. 2022;185:3980–3991.e18. doi: 10.1016/j.cell.2022.09.022. - DOI - PMC - PubMed
    1. Kinney R.M., Butrapet S., Chang G.J., Tsuchiya K.R., Roehrig J.T., Bhamarapravati N., Gubler D.J. Construction of infectious cDNA clones for dengue 2 virus: strain 16681 and its attenuated vaccine derivative, strain PDK-53. Virology. 1997;230:300–308. doi: 10.1006/viro.1997.8500. - DOI - PubMed
    1. Chen B.J., Leser G.P., Morita E., Lamb R.A. Influenza virus hemagglutinin and neuraminidase, but not the matrix protein, are required for assembly and budding of plasmid-derived virus-like particles. J. Virol. 2007;81:7111–7123. doi: 10.1128/JVI.00361-07. - DOI - PMC - PubMed
    1. Gaspar I., Wippich F., Ephrussi A. Terminal deoxynucleotidyl transferase mediated production of labeled probes for single-molecule FISH or RNA capture. Bio. Protoc. 2018;8:e2750. doi: 10.21769/BioProtoc.2750. - DOI - PMC - PubMed
    1. Gaspar I., Wippich F., Ephrussi A. Enzymatic production of single-molecule FISH and RNA capture probes. RNA. 2017;23:1582–1591. doi: 10.1261/rna.061184.117. - DOI - PMC - PubMed

LinkOut - more resources