. 2023 Aug;72(8):2841-2849.
doi: 10.1007/s00262-023-03461-z. Epub 2023 May 20.

Sequential CAR T cell and targeted alpha immunotherapy in disseminated multiple myeloma

Affiliations

Sequential CAR T cell and targeted alpha immunotherapy in disseminated multiple myeloma

Dennis Awuah et al. Cancer Immunol Immunother. 2023 Aug.

Abstract

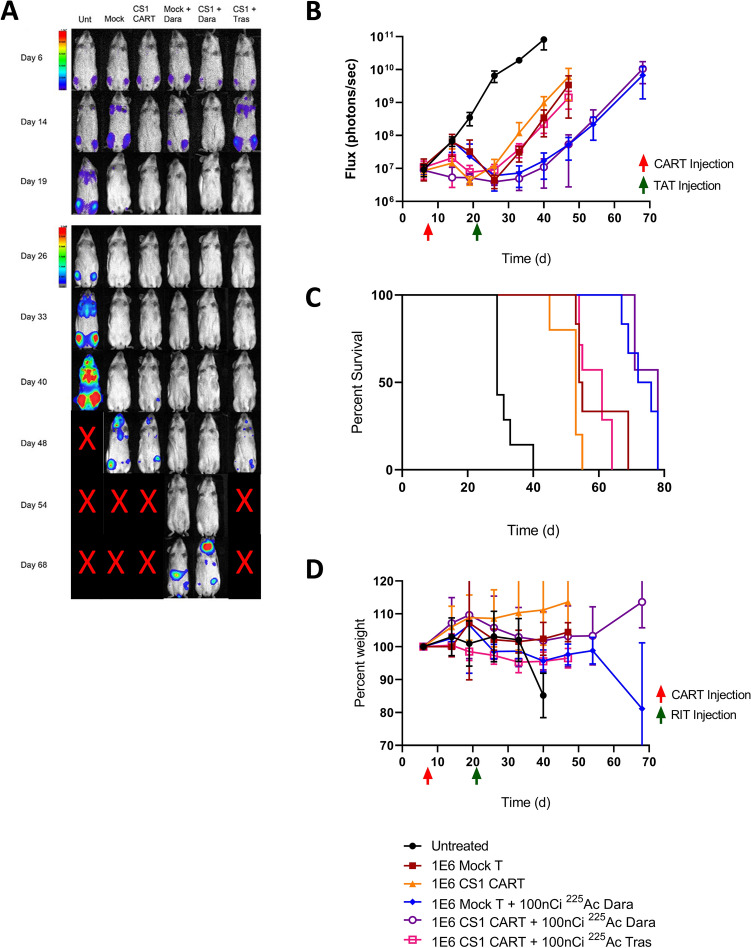
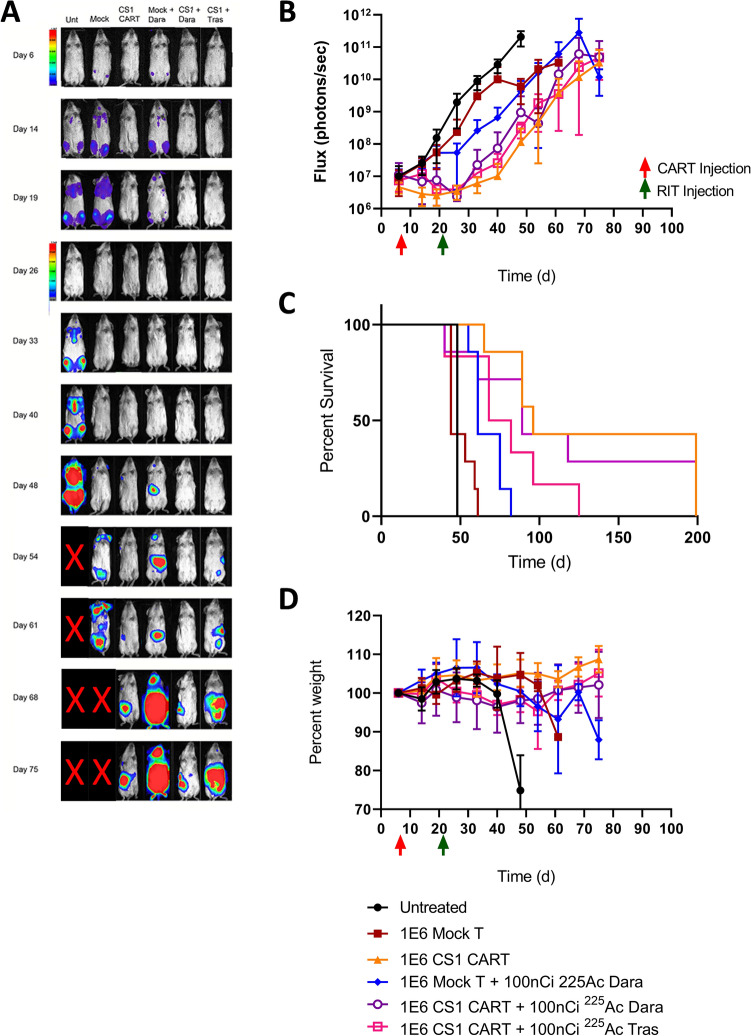
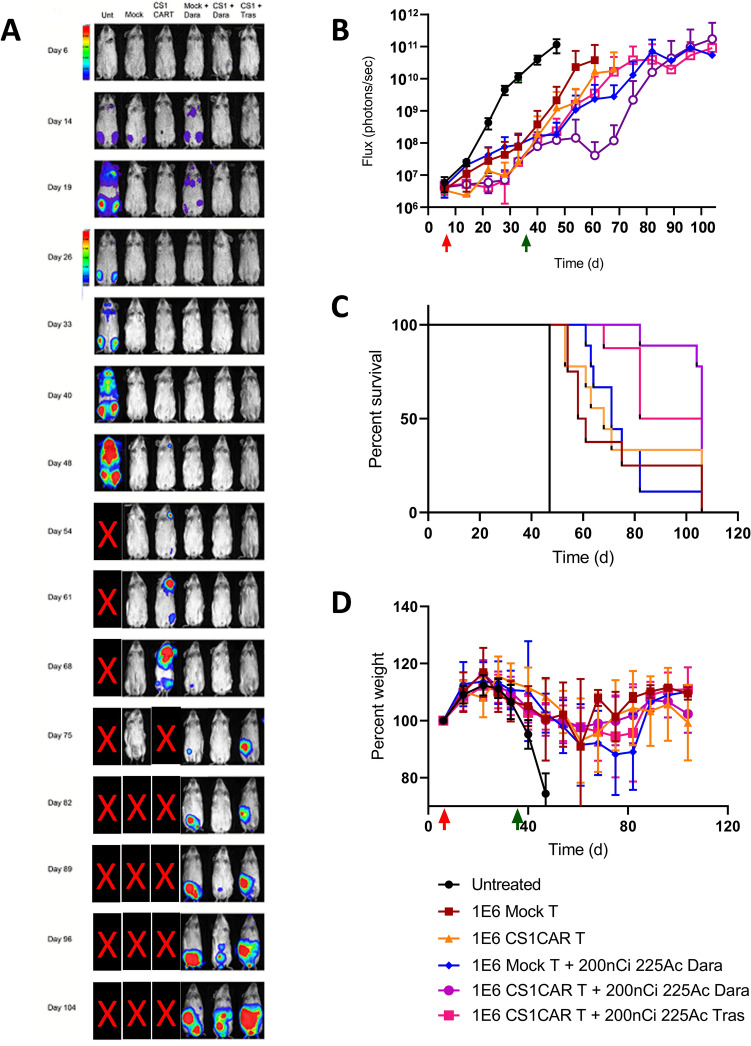
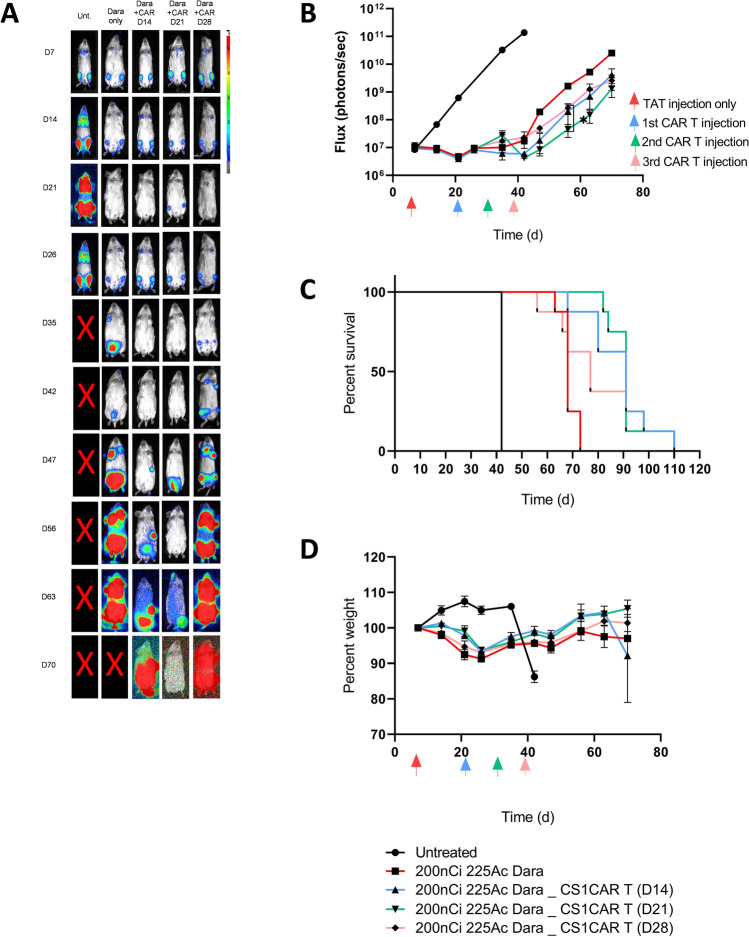
Multiple myeloma (MM) is still an incurable disorder despite improved antibody and cellular therapies against different MM antigens. Single targeted antigens have so far been ineffective against MM with most patients relapsing after initial response. Hence, sequential immunotherapies directed at different targets are expected to perform better than monotherapy alone. Here, we optimized and established in preclinical studies the therapeutic rationale of using targeted alpha therapy (TAT) directed against CD38 antigen (225Ac-DOTA-daratumumab) with CAR T cell therapy directed at CS1 antigen in a systemic MM model. The sequential therapies compared CAR T therapy followed by TAT to TAT followed by CAR T therapy. CAR T cell monotherapy increased median survival from 49 days (d) in untreated controls to 71d with a modest improvement to 89d for 3.7 kBq of TAT given 14d later. When CAR T was followed by 7.4 kBq of TAT 29d later, sequential therapy increased median survival from 47d in untreated controls to 106d, compared to 68d for CAR T monotherapy. When CAR T therapy was followed by untargeted alpha immunotherapy using 7.4 kBq of 225Ac-DOTA-trastuzumab (anti-HER2) antibody 29d later, there was only a slight improvement in response over CAR T monotherapy demonstrating the role of tumor targeting. TAT (7.4 kBq) followed by CAR T therapy was also effective when CAR T therapy was delayed for 21d vs 14d or 28d post TAT, highlighting the importance of timing sequential therapies. Sequential targeted therapies using CS1 CAR T or 225Ac-DOTA-CD38 TAT in either order shows promise over monotherapies alone.

Keywords: CAR T therapy; Multiple myeloma; Targeted alpha therapy.


Conflict of interest statement

The authors declare no conflicts of interest.

Figures

Fig. 1
Fig. 1
Efficacy of sequential therapy with donor 1 CS1 CAR T and 3.7 kBq TAT 14 days later for treatment of disseminated MM. A Representative BLI images for each group, color bar indicating intensity. B MM burden as quantified using BLI images, in radiance. (Mock, P = 0.011; CS1 CAR T, P = 0.012; Mock + Dara, P = 0.011; CS1 CAR T + Dara, P = 0.011; CS1 CAR T + Tras TAT, P = 0.011) C Kaplan–Meier survival plot (Mock, P = 0.0004;CS1 CAR T, P = 0.0011; Mock + Dara, P = 0.0004; CS1 CAR T + Dara, P = 0.0001; CS1 CAR T + Tras TAT, P = 0.0001) D Whole-body toxicity as measured by weight (Mock, ns; CS1 CAR T, P = 0.0009; Mock + Dara, ns; CS1 + Dara, P = 0.042; CS1 CAR T + Tras TAT, ns). n = 7 for all groups but Mock /Mock + Dara (n = 6) and CS1 CAR T (n = 5). Red and green colored arrows represent time of administration of CS1 CAR T and TAT therapy respectively, Time (d) indicates days post tumor engraftment
Fig. 2
Fig. 2
Sequential therapy of disseminated MM by CS1 CAR T from donor 2 plus 3.7 kBq α-therapy 14 days later for treatment of disseminated MM. A Representative BLI images for each group, color bar indicating intensity (note scale change on day 28). B MM burden as quantified using BLI images. C Kaplan–Meier survival plot (P values vs untreated: Mock, P = 0.8076; CS1 CAR T, P = 0.0016; Mock + Dara targeted α-therapy, P = 0.0016; CS1 CAR T + Dara targeted α-therapy, P = 0.0292; CS1 CAR T + Tras untargeted α-therapy, P = 0.0629). D Whole-body toxicity as measured by percent body weight (P values vs untreated: Mock, ns; CS1 CAR T, P = 0.027; Mock + Dara targeted α-therapy, P = 0.016; CS1 CAR T + Dara targeted α-therapy, ns; CS1 CAR T + Tras untargeted α-therapy, ns). N = 7 for all groups except untreated (n = 4) and CS1 CAR T + Tras untargeted α-therapy (n = 6). Red and green colored arrows represent time of administration of CAR T and TAT therapy respectively, Time (d) indicates days post tumor engraftment
Fig. 3
Fig. 3
Sequential therapy of disseminated MM by CS1 CAR T from donor 2 plus 7.4 kBq α-therapy 29 days later for treatment of disseminated MM. A Representative BLI images for each group, color bar indicating intensity (note scale change at day 28). B MM burden as quantified using BLI images, in radiance. (P values vs untreated: Mock, P = 0.0009; CS1 CAR T, P = 0.0008; Mock + Dara targeted α-therapy, P = 0.0007; CS1 CAR T + Dara targeted α-therapy, P = 0.0007; CS1 CAR T + Tras untargeted α-therapy, P = 0.0007) C Kaplan–Meier survival plot. (P values vs untreated: Mock, P = 0.0001; CS1 CAR T, P < 0.0001; Mock + Dara targeted α-therapy, P < 0.0001; CS1 CAR T + Dara targeted α-therapy, P < 0.0001; CS1 CAR T + Tras untargeted α-therapy, P = 0.0001) (D) Whole-body toxicity as measured by percent body weight (P values vs untreated: Mock, ns; CS1 CAR T, P = 0.0004; Mock + Dara targeted α-therapy, P = 0.0026; CS1 CAR T + Dara targeted α-therapy, P = 0.010; CS1 CAR T + Tras untargeted α-therapy, ns). Untreated, CS1 CAR T + untargeted α-therapy Tras (N = 8); Mock, CS1 CAR T (N = 6); Mock + targeted α-therapy Dara, CS1 CAR T + targeted α-therapy Dara (N = 9). Red and green colored arrows represent time of administration of CAR T and TAT therapy respectively, Time (d) indicates days post tumor engraftment
Fig. 4
Fig. 4
Sequential therapy of disseminated MM by 7.4 kBg of 225Ac-CD38 TAT and CAR T cell administered at different time points. A Representative BLI images for each group, color bar indicating intensity. B MM burden as quantified using BLI images, in radiance. (P values for day 21 vs day 28 CS1 CAR T cells on week 8: P = 0.0169. P values vs untreated: Dara targeted α therapy only, P < 0.0001, Dara targeted α therapy + CS1 CAR T (D21), P < 0.0001, Dara targeted α therapy + CS1 CAR T (D28), P < 0.0001, Dara targeted α therapy + CS1 CAR T (D35), P < 0.0001 C Kaplan–Meier survival plot. (P values vs untreated: Dara targeted α therapy only, P = 0.0001, Dara targeted α therapy + CS1 CAR T (D 14), P = 0.0001, Dara targeted α therapy + CS1 CAR T (D 21), P = 0.0001, Dara targeted α therapy + CS1 CAR T (D 28), P = 0.0001. D Whole-body toxicity as measured by percent body weight (N = 8). Colored arrows represent time of administration of TAT or CAR T therapy at indicated days, Time (d) indicates days post tumor engraftment

References

    1. Howlader N, Krapcho M, Miller D, Brest A, Yu M, Ruhl J, Tatalovich Z, Mariotto A, Lewis DR, Chen HS, Feuer EJ, Cronin KA (eds). SEER cancer statistics review, National Cancer Institute, Bethesda, MD. 1975–2018
    1. Dimopoulos MA, et al. Elotuzumab plus lenalidomide/dexamethasone for relapsed or refractory multiple myeloma: ELOQUENT-2 follow-up and post-hoc analyses on progression-free survival and tumour growth. Br J Haematol. 2017;178(6):896–905. doi: 10.1111/bjh.14787. - DOI - PMC - PubMed
    1. Cho SF, et al. BCMA-targeting therapy: driving a new era of immunotherapy in multiple myeloma. Cancers (Basel) 2020;12(6):1473. doi: 10.3390/cancers12061473. - DOI - PMC - PubMed
    1. Morandi F, et al. CD38: a target for immunotherapeutic approaches in multiple myeloma. Front Immunol. 2018;9:2722. doi: 10.3389/fimmu.2018.02722. - DOI - PMC - PubMed
    1. Rosenzweig M, et al. Preclinical data support leveraging CS1 chimeric antigen receptor T-cell therapy for systemic light chain amyloidosis. Cytotherapy. 2017;19(7):861–866. doi: 10.1016/j.jcyt.2017.03.077. - DOI - PubMed

Substances