. 2023 Jun 8;186(12):2593-2609.e18.
doi: 10.1016/j.cell.2023.04.035. Epub 2023 May 19.

Site-specific R-loops induce CGG repeat contraction and fragile X gene reactivation

Affiliations

Site-specific R-loops induce CGG repeat contraction and fragile X gene reactivation

Hun-Goo Lee et al. Cell. .

Abstract

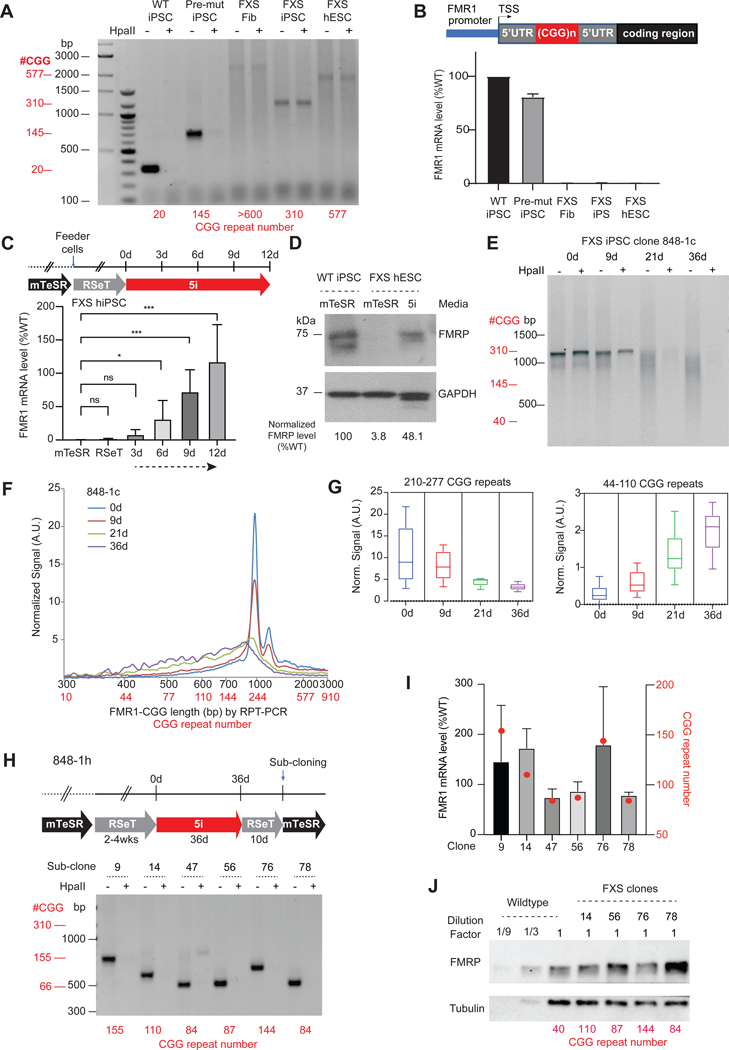
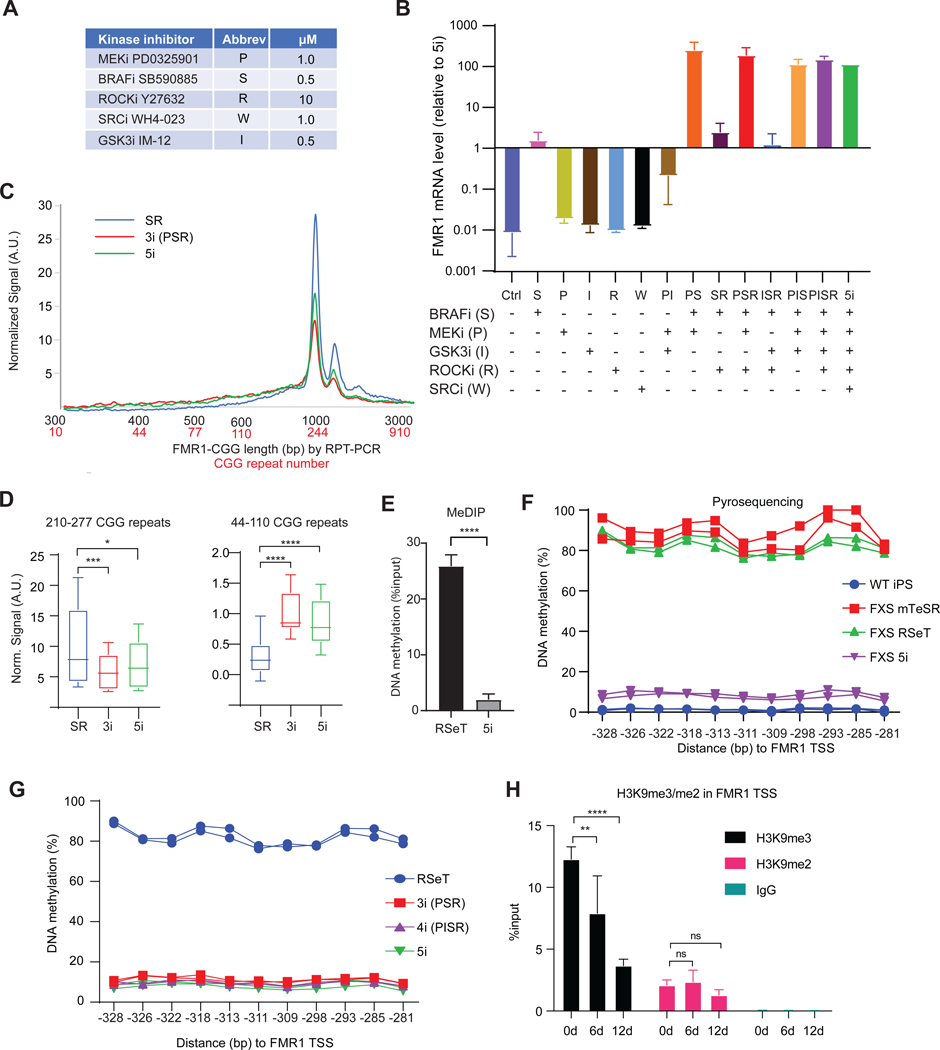
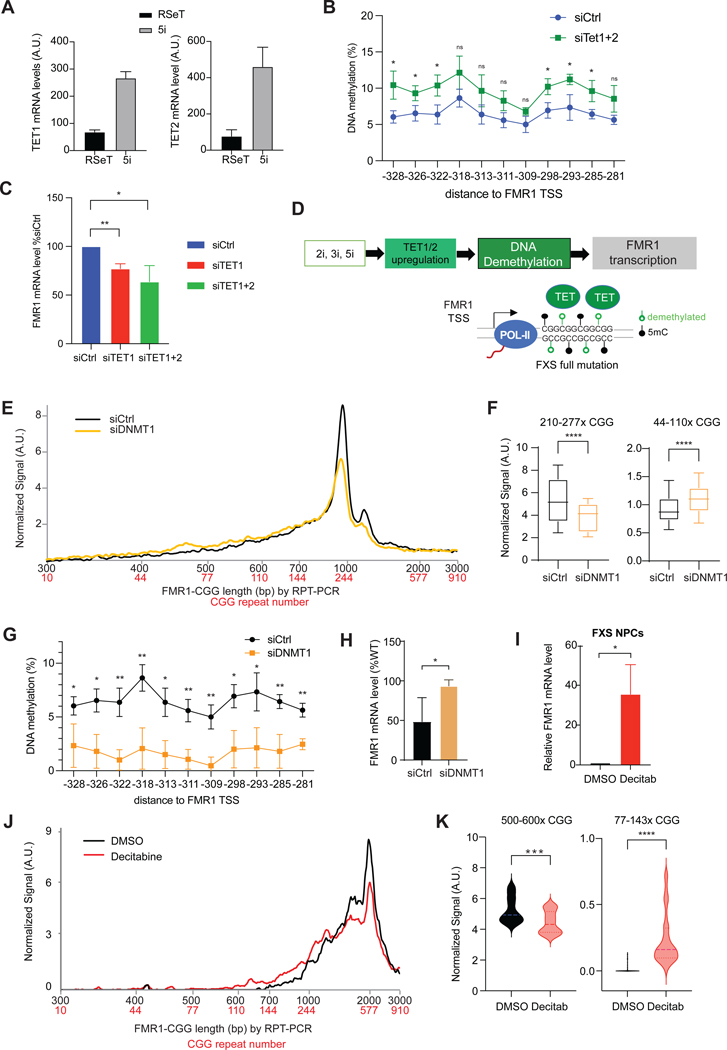
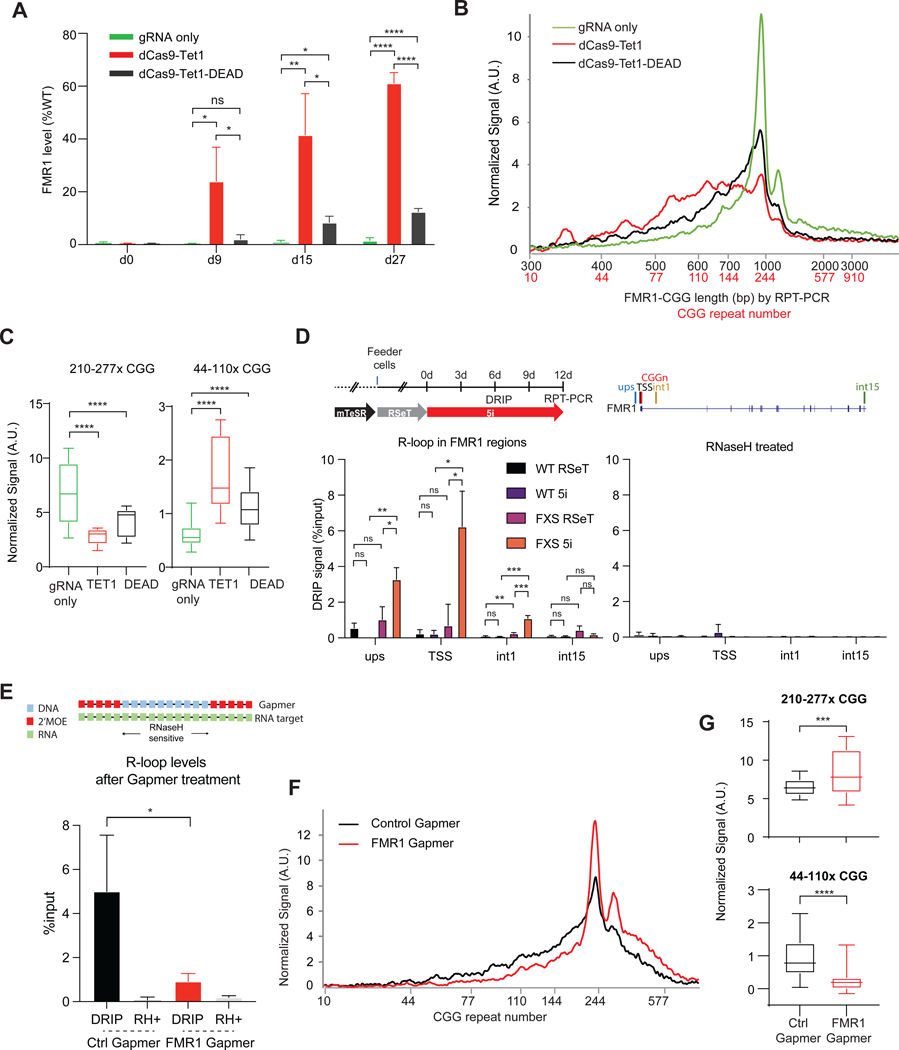
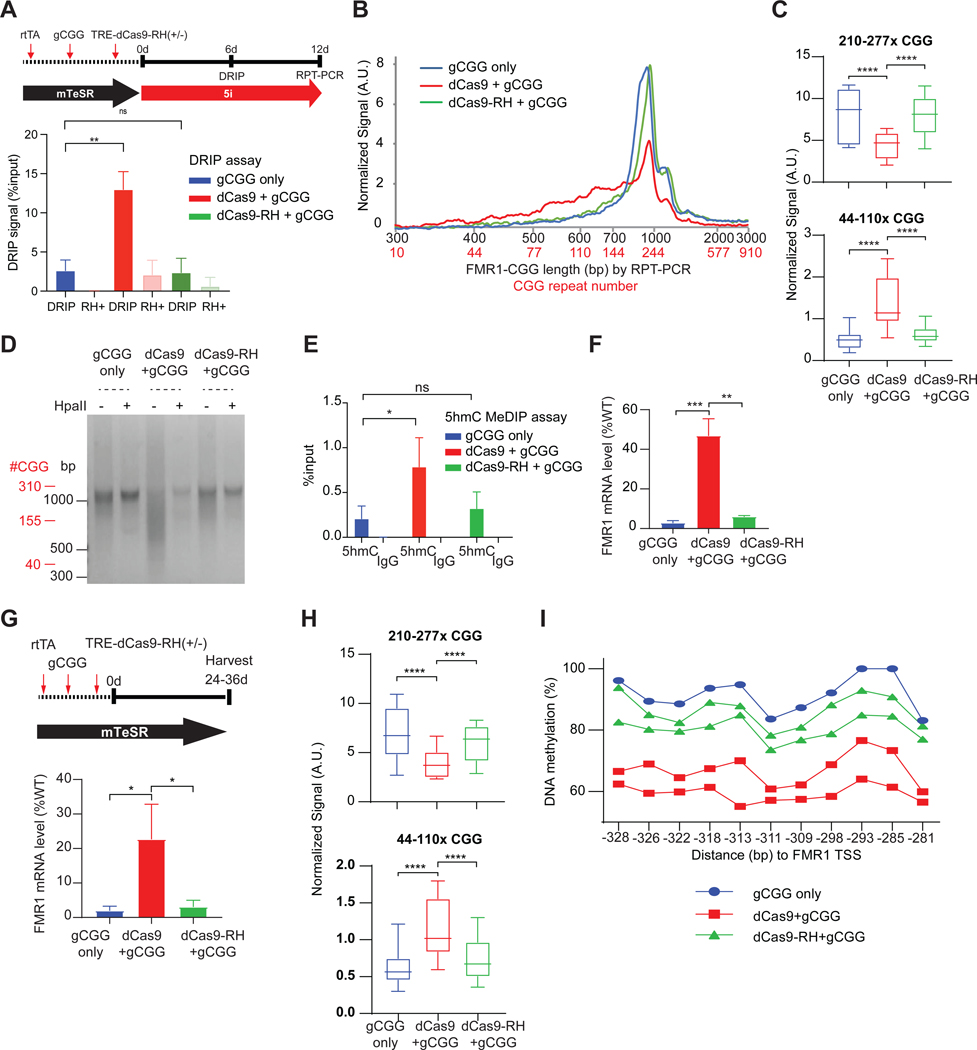
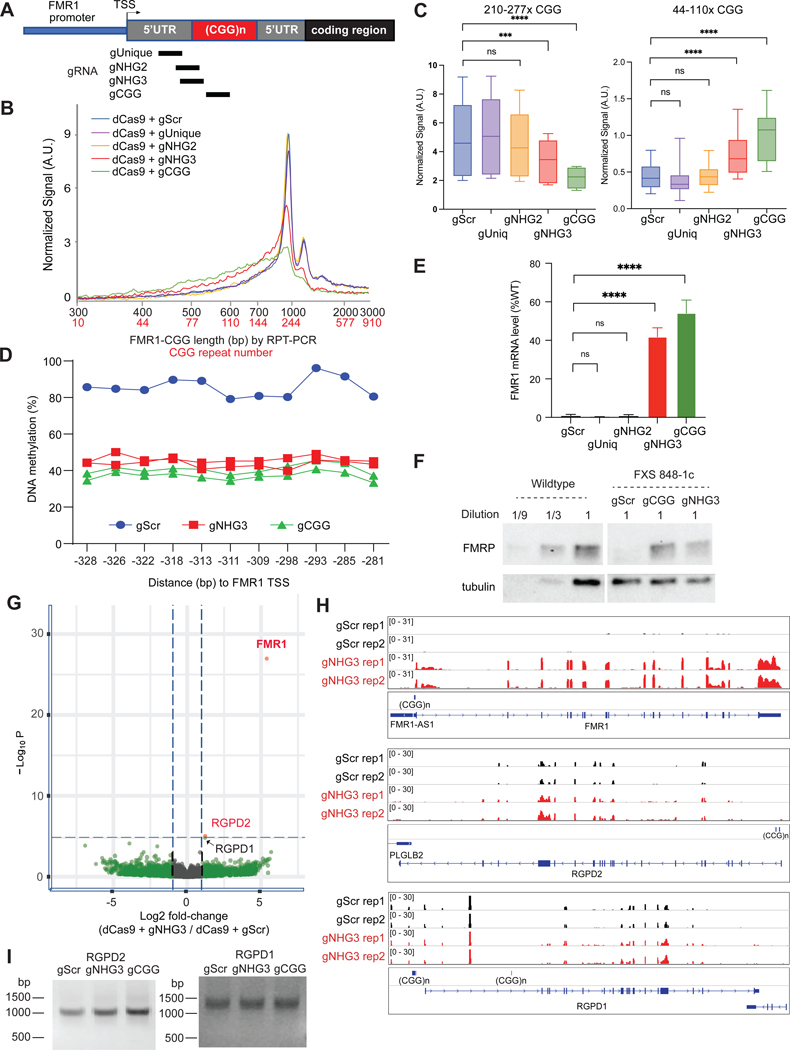
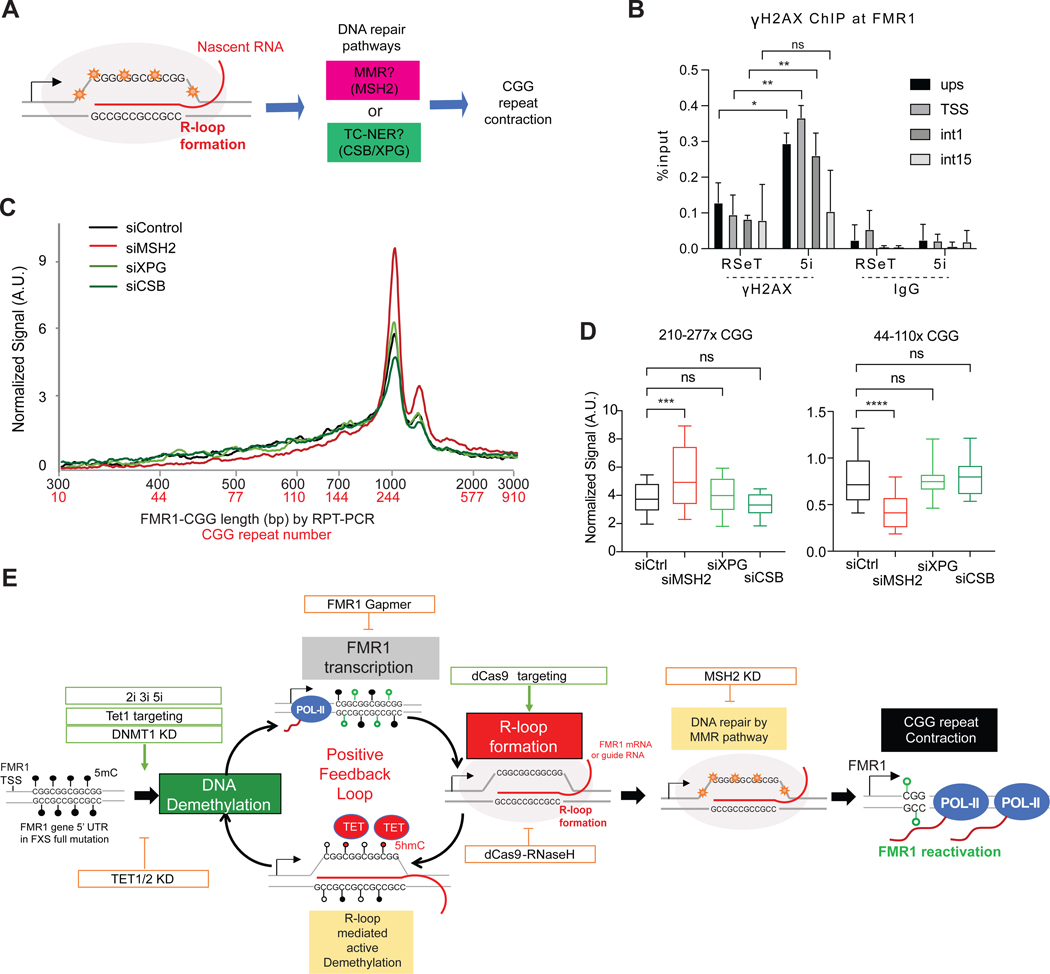
Here, we describe an approach to correct the genetic defect in fragile X syndrome (FXS) via recruitment of endogenous repair mechanisms. A leading cause of autism spectrum disorders, FXS results from epigenetic silencing of FMR1 due to a congenital trinucleotide (CGG) repeat expansion. By investigating conditions favorable to FMR1 reactivation, we find MEK and BRAF inhibitors that induce a strong repeat contraction and full FMR1 reactivation in cellular models. We trace the mechanism to DNA demethylation and site-specific R-loops, which are necessary and sufficient for repeat contraction. A positive feedback cycle comprising demethylation, de novo FMR1 transcription, and R-loop formation results in the recruitment of endogenous DNA repair mechanisms that then drive excision of the long CGG repeat. Repeat contraction is specific to FMR1 and restores the production of FMRP protein. Our study therefore identifies a potential method of treating FXS in the future.

Keywords: CGG repeat; DNA methylation; DNA repair; FMR1; FMRP; R-loop; X-linked disease; autism spectrum disorders; fragile X syndrome; gene editing; gene reactivation; neurodevelopmental disorders; repeat contraction; repeat expansion disorders; trinucleotide repeat.


Conflict of interest statement

Declaration of interests J.T.L. is a cofounder of Fulcrum Therapeutics and is an Advisor to Skyhawk Therapeutics. A patent application related to the technologies in this work has been filed with the USPTO.

Figures

Figure 1.
Figure 1.. CGG repeat contraction and FMR1 reactivation by cellular reprogramming
See also Figure S1. (A) Gel electrophoresis of PCR products from RPT-PCR to examine repeat length and DNA methylation status in indicated patient cell lines. Addition (+) of HpaII to genomic DNA prior to RPT-PCR tests methylation status by degrading non-methylated templates. RPT-PCR product lengths (black) and corresponding CGG repeat copy numbers (red, below each cell line) are shown. (B) FMR1 mRNA quantitation from the cells shown in (A). Expression levels normalized to WT hiPSC levels. Schematic map of FMR1 gene depicted above. (C) Experimental timeline showing periods of acclimation to mTeSR, RSeT, and 5i media, along with accompanying changes in FMR1 mRNA levels after 12 days of 5i treatment. P values determined by the Student t-test. ns, not significant, *, P<0.05, ***, P<0.001. (D) Western blot analysis of FMRP in WT hiPSC versus FXS hESC grown in indicated media. GAPDH, loading control. FMRP levels quantified by imageJ and normalized to GAPDH. (E) Time course analysis of CGG repeat length and DNA methylation status (HpaII +/−) in FXS full mutation clone, 848–1c, between 0–36 days of 5i treatment. Gel electrophoresis of RPT-PCR products is shown, with RPT-PCR product lengths (black) and corresponding repeat copy numbers (red). (F) Bioanalyzer quantitation of CGG repeat lengths in a 0–36 day time course. RPT-PCR product lengths (black) and corresponding repeat copy numbers (red) are shown. (G) Box plots for quantitation of high copy number (210–277x CGGs) and low copy number (44–110x CGGs) repeats after 0–36 days of 5i treatment. (H) RPT-PCR assays of 6 subclones derived from 848–1h after 5i treatment to copy number of shortened CGG repeats (indicated in red). (I) Quantitation of FMR1 mRNA levels in subclones of 848–1h in (H) by RT-qPCR. Red dots, repeat numbers as indicated in the alternate y-axis (red axis). (J) Western blot quantitation of FMRP levels in indicated 848–1h subclones. Tubulin, loading control. CGG repeat numbers shown below each subclone.
Figure 2.
Figure 2.. MEKi and BRAFi are sufficient to drive CGG contraction
See also Figure S2. (A) Table of kinase inhibitors, abbreviations, and concentrations used in 5i formulation. (B) Determination of active compounds in 5i media for FMR1 reactivation by testing single, double, and triple combinations of inhibitors in 848–1c cells. FMR1 RNA levels determined by RT-qPCR, normalized to levels in 5i. (C) Bioanalyzer quantitation of CGG repeat length/copy number after indicated treatment for 12 days. (D) Box plot quantitation of high (210–277x CGGs) versus low (44–110x CGGs) copy numbers after 12 days of indicated treatment. P determined by Student t-test. *, P<0.05, ***, P<0.001, ****, P<0.0001. (E) MeDIP-qPCR assay using anti-5mC antibodies measures DNA methylation levels at FMR1 in 848–1c grown in RSeT versus 9 days of 5i. ****, P<0.0001 (Student t-test). (F) Pyrosequencing analysis of DNA methylation at CpG islands in FMR1 promoter in WT versus FXS cells grown in indicated media. (G) Pyrosequencing analysis of DNA methylation levels at FMR1 CpG islands after treating 848–1c cells with RSeT, 3i (PSR), 4i (PISR), or 5i. (H) ChIP-qPCR assay for H3K9me3 and H3K9me2 at FMR1 TSS in 848–1c cells in RSeT versus 6 or 12 days in 5i. Student t-tests: ns, not significant, **, P<0.01, ****, P<0.0001. IgG ChIP, negative control.
Figure 3.
Figure 3.. DNA demethylation potentiates CGG contraction and FMR1 reactivation
See also Figure S3. (A) TET1 and TET2 RT-qPCR quantitation in FXS iPSCs treated with RSeT versus 5i for 6 days. (B) Pyrosequencing analysis of DNA methylation at FMR1 promoter after 12 days of TET1/TET2 versus control knockdown in 848–1c cells grown in 5i. Student t-test: * P<0.05. ns, not significant. (C) RT-qPCR of FMR1 in 848–1c cells treated with siCtrl, siTET1, and siTET1/siTET2 double knockdown in 5i for 6 days. Student t-test: *, P<0.05. **, P<0.01. (D) Proposed epistatic pathway depicting effects of 5i, 3i, or 2i treatment on TET1/2 expression, DNA methylation, and de novo FM FMR1 transcription. 5mC, methylated C. (E) Bioanalyzer analysis of CGG repeat length distribution after DNMT1 knockdown in 5i. (F) Box plot quantitation of high (210–277x CGGs) versus low (44–110x CGGs) copy numbers after 12 days of siDNMT1 knockdown in 5i. Student t-test: ****, P<0.0001. G) Pyrosequencing analysis of DNA methylation at FMR1 CpG islands after siDNMT1 (or siCtrl) treatment for 12 days in 848–1c grown in 5i. Student t-test: *, P<0.05. **, P<0.01. (H) RT-qPCR of FMR1 expression in 848–1c cells treated with siCtrl versus siDNMT1 in 5i for 6 days. Student t-test: *, P<0.05. (I) RT-qPCR of FMR1 expression in FXS NPC treated with decitabine versus DMSO vehicle for 3 days and grown for an additional 12 days. Student t-test: *, P<0.05. (J) Bioanalyzer analysis of CGG repeat length distribution after DMSO or decitabine treatment with NPC per (I). (K) Violin plots quantitation of high copy number (500–600x CGGs) versus low copy number (77–143x CGGs) repeats after DMSO or decitabine treatment per (I). t-test: ***, P<0.001. ****, P<0.0001.
Figure 4.
Figure 4.. R-loop formation in FMR1 locus
(A) FMR1 reactivation after 848–1c cells were exposed to dCas9-Tet1, dCas9-Tet1-DEAD, versus gRNA only for 0–27 days in mTeSR. t-tests: ns, not significant. *, P<0.05. **, P<0.01. ****, P<0.0001. (B) Bioanalyzer traces of repeat length (black) and copy number (red) after 27 days of treatment. (C) Bioanalyzer signals for ranges of 210–277x CGGs versus 44–110x CGGs for indicated conditions. P<0.0001, t-test. (D) Left panel: DRIP assay at the FMR1 regions including upstream (ups), transcription start site (TSS), first intron (int1) and 15th intron (int15) in WT iPSC and 848–1c FXS iPSC after 6 days of 5i. Right panel: Treatment with RNaseH (RH+) abolished DRIP signals. t-tests: ns, not significant. *, P<0.05. **, P<0.01. ***, P<0.001. (E) Top panel: Gapmer design based on 2’MOE chemistry. Bottom panel: DRIP assay at the FMR1 TSS after FMR1 downregulation by gapmer treatment in 5i for 6 days. (F) Bioanalyzer profiles for RPT-PCR product length and estimated CGG repeat copy number in 848–1c iPSC after 12 days treatment with FMR1 versus control Gapmer. (G) Box plot quantitation of high (210–277x CGGs) versus low (44–110x CGGs) copy numbers after indicated treatment for 12 days. t-test: ***, P<0.001. ****, P<0.0001.
Figure 5.
Figure 5.. Site-specific R-loops underlie repeat contraction
See also Figure S4. (A) DRIP assay at the FMR1 TSS in 848–1c iPSC treated as shown in schematic (top panel), with gCGG alone, dCas9+gCGG, or dCas9-RH+gCGG for 6 days. t-test: **, P<0.01. ns, not significant. (B) Bioanalyzer analysis of RPT-PCR product length and estimated CGG repeat copy number for the samples depicted in (A). (C) Box plot quantitation of high (210–277x CGGs) versus low (44–110x CGGs) copy numbers after indicated treatment for 12 days. t-test: ****, P<0.0001 (D) Gel electrophoresis of CGG RPT-PCR products +/− HpaII digestion in 848–1c iPSC, treated for 12 days using the scheme shown in (A). (E) 5hmC MeDIP assay at the FMR1 5’UTR in 848–1c iPSC treated, with gCGG alone, dCas9+gCGG, or dCas9-RH+gCGG for 6 days. t-test: *, P<0.05. ns, not significant. (F) RT-qPCR of FMR1 mRNA levels for corresponding samples shown in (A-E). t-test: **, P<0.01; ***, P<0.001. (G) Top: Timeline to test sufficiency of dCas9-targeted R-loops in 848–1c iPSC without 5i treatment. Bottom: RT-qPCR of FMR1 mRNA levels following 24-day exposure to gCGG alone, dCas9+gCGG, or dCas9-RH+gCGG. t-test: *, P<0.05. (H) Box plot quantitation of high (210–277x CGGs) versus low (44–110x CGGs) copy numbers after indicated treatment in (G). t-test: ****, P<0.0001. (I) Pyrosequencing to examine DNA methylation at FMR1 promoter for samples in (G,H).
Figure 6.
Figure 6.. Repeat contraction and gene reactivation are specific to FMR1
See also Figure S5. (A) Map of FMR1 and location of FMR1-specific gRNAs. (B) Bioanalyzer profiles for CGG length and repeat copy number for 848–1c iPSC targeted as shown in (A) for 36 days in mTeSR regular media. Scrambled gRNA (gScr), negative control. (C) Box plot quantitation of high (210–277x CGGs) versus low (44–110x CGGs) copy numbers after indicated treatment per (A) above. t-test: ***, P<0.001. ****, P<0.0001. (D) Pyrosequencing to examine DNA methylation at FMR1 promoter for samples targeted as indicated per (A-B). (E) RT-qPCR of FMR1 mRNA for samples shown in (A-D). t-test: ****, P<0.0001. ns, not significant. (F) Western blot analysis of FMRP levels for the experiments in (A-E). Tubulin, loading control. (G) Volcano plot of transcriptomic analysis of 848–1c iPSC targeted by dCas9+gNHG3 versus dCas9+gScr. Log2 fold-change for differentially expressed (DE) genes are plotted against statistical significance (-Log10P). Red dots, significantly changed genes. (H) Integrated Genome Viewer (IGV) screenshots for transcriptomic analysis of two biological replicates (rep1, rep2) of cells exposed to either dCas9 + gScr or dCas9 + gNHG3. Three representative genes with CGG tracts are shown. Scale is indicated in brackets. (I) RPT-PCR suggests absence of off-target CGG contraction at RGPD2 and RGPD1 following dCas9 targeting by gScr, gNHG3, and gCGG in 848–1c FXS hiPSCs.
Figure 7.
Figure 7.. A positive feedback loop of DNA demethylation, de novo nascent transcription, R-loop formation, and recruitment of DNA mismatch repair mechanisms drives FMR1 reactivation
See also Figure S6. (A) R-loop formation can trigger two major DNA repair pathways. MMR and TC-NER are candidate mechanisms for CGG repeat contraction. (B) ChIP-qPCR for γ-H2AX at four FMR1 positions (upstream, TSS, first intron, and 15th intron) in 848–1c cells grown in RSeT or 5i media. t-test: *, P<0.05. **, P<0.01. (C) Bioanalyzer profiles for RPT-PCR product length and estimated CGG repeat copy number in 848–1c iPSC after 12 days treatment with siMSH2, siXPG, or siCSB, as compared to control siRNA treatment. Cells are grown in 5i media. (D) Box plot quantitation of high (210–277x CGGs) versus low (44–110x CGGs) copy numbers after indicated treatment for 12 days. t-test: ***, P<0.001, ****, P<0.0001. (E) Positive feedback cycle of DNA demethylation, transcription, R-loop formation, and repeat contraction driving reactivation of FMR1.

References

    1. Hagerman RJ, Des-Portes V, Gasparini F, Jacquemont S, and Gomez-Mancilla B. (2014). Translating molecular advances in fragile X syndrome into therapy: a review. J Clin Psychiatry 75, e294–307. 10.4088/JCP.13r08714. - DOI - PubMed
    1. Hagerman RJ, Berry-Kravis E, Hazlett HC, Bailey DB Jr., Moine H, Kooy RF, Tassone F, Gantois I, Sonenberg N, Mandel JL, and Hagerman PJ (2017). Fragile X syndrome. Nat Rev Dis Primers 3, 17065. 10.1038/nrdp.2017.65. - DOI - PubMed
    1. Berry-Kravis EM, Harnett MD, Reines SA, Reese MA, Ethridge LE, Outterson AH, Michalak C, Furman J, and Gurney ME (2021). Inhibition of phosphodiesterase-4D in adults with fragile X syndrome: a randomized, placebo-controlled, phase 2 clinical trial. Nat Med 27, 862–870. 10.1038/s41591-021-01321-w. - DOI - PubMed
    1. Berry-Kravis EM, Lindemann L, Jonch AE, Apostol G, Bear MF, Carpenter RL, Crawley JN, Curie A, Des Portes V, Hossain F, et al. (2018). Drug development for neurodevelopmental disorders: lessons learned from fragile X syndrome. Nat Rev Drug Discov 17, 280–299. 10.1038/nrd.2017.221. - DOI - PMC - PubMed
    1. Hagerman RJ, and Hagerman PJ (2021). Fragile X Syndrome: Lessons Learned and What New Treatment Avenues Are on the Horizon. Annu Rev Pharmacol Toxicol. 10.1146/annurev-pharmtox-052120-090147. - DOI - PubMed

Publication types

MeSH terms

Substances