. 2023 May 20;22(1):86.
doi: 10.1186/s12943-023-01788-w.

The phospholipid transporter PITPNC1 links KRAS to MYC to prevent autophagy in lung and pancreatic cancer

Affiliations

The phospholipid transporter PITPNC1 links KRAS to MYC to prevent autophagy in lung and pancreatic cancer

Rodrigo Entrialgo-Cadierno et al. Mol Cancer. .

Erratum in

Abstract

Background: The discovery of functionally relevant KRAS effectors in lung and pancreatic ductal adenocarcinoma (LUAD and PDAC) may yield novel molecular targets or mechanisms amenable to inhibition strategies. Phospholipids availability has been appreciated as a mechanism to modulate KRAS oncogenic potential. Thus, phospholipid transporters may play a functional role in KRAS-driven oncogenesis. Here, we identified and systematically studied the phospholipid transporter PITPNC1 and its controlled network in LUAD and PDAC.

Methods: Genetic modulation of KRAS expression as well as pharmacological inhibition of canonical effectors was completed. PITPNC1 genetic depletion was performed in in vitro and in vivo LUAD and PDAC models. PITPNC1-deficient cells were RNA sequenced, and Gene Ontology and enrichment analyses were applied to the output data. Protein-based biochemical and subcellular localization assays were run to investigate PITPNC1-regulated pathways. A drug repurposing approach was used to predict surrogate PITPNC1 inhibitors that were tested in combination with KRASG12C inhibitors in 2D, 3D, and in vivo models.

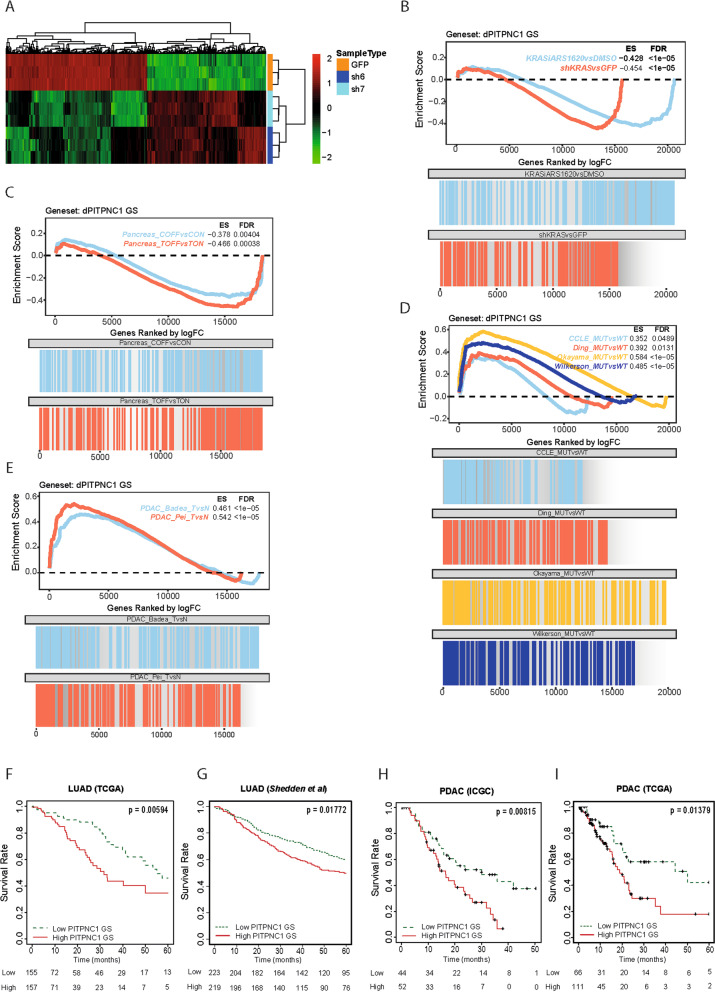
Results: PITPNC1 was increased in human LUAD and PDAC, and associated with poor patients' survival. PITPNC1 was regulated by KRAS through MEK1/2 and JNK1/2. Functional experiments showed PITPNC1 requirement for cell proliferation, cell cycle progression and tumour growth. Furthermore, PITPNC1 overexpression enhanced lung colonization and liver metastasis. PITPNC1 regulated a transcriptional signature which highly overlapped with that of KRAS, and controlled mTOR localization via enhanced MYC protein stability to prevent autophagy. JAK2 inhibitors were predicted as putative PITPNC1 inhibitors with antiproliferative effect and their combination with KRASG12C inhibitors elicited a substantial anti-tumour effect in LUAD and PDAC.

Conclusions: Our data highlight the functional and clinical relevance of PITPNC1 in LUAD and PDAC. Moreover, PITPNC1 constitutes a new mechanism linking KRAS to MYC, and controls a druggable transcriptional network for combinatorial treatments.

Keywords: KRAS; LUAD; MYC; PDAC; PITPNC1; Therapy; mTOR.


Conflict of interest statement

F.L and S.V. receive research funding from Roche. C.A. and S.V. hold research grants by Revolution Medicines. S.V. is a consultant for LiberaBio. None of the disclosed sources are related to this work.

Figures

Fig. 1
Fig. 1
PITPNC1 is upregulated in KRAS-mutated LUAD and PDAC and predicts poor survival. A Heatmap of upregulated genes in The Cancer Genome Atlas (TCGA) LUAD data set comparing expression profiles of wt and mut KRAS LUAD patients. PITPNC1 mRNA expression levels in normal lung (N), wild type (wt) and mutant (mut) KRAS LUAD. Mut vs wt KRAS (p < 0.0001) or vs N (p < 0, 0001). C PITPNC1 gene amplification percentage (GISTIC2 analysis) in mut and wt KRAS LUAD samples, or both (p = 0.815). D Kaplan–Meier survival analysis of LUAD patients, stratified based on KRAS status and PITPNC1 expression. Data from TCGA database: wt KRAS (Log-rank test p = 0.96) and mut KRAS (Log-rank test p = 0.04). E Kaplan–Meier survival analysis of PDAC patients stratified by PITPNC1 expression. Data from ICGC database (Log-rank test p = 0.027). F Western blot of PITPNC1 and KRAS expression in H2126 and H6C7 cells, expressing a control (LacZ) or overexpressing KRAS (wt KRAS4B or mut KRASG12D, G12C or G12V). Twenty μg of protein were loaded per sample. HSP90 and β-TUBULIN were used as loading markers. G Western blot of PITPNC1 and KRAS expression in A549, H2009, PATU8902 and HPAFII cells, expressing a control (GFPsh) or an inducible KRAS shRNA (KRASsh) (activated by 1 µg/ml doxycycline). Twenty μg of protein were loaded per sample. HSP90 were used as loading markers. H Western blot of PITPNC1 expression in A549, H2009 and HPAFII cells treated for 24 h with pharmacologic inhibitors: trametinib (MEKi, 0.5 μmol/L), BIX02189 (MEK5i, 10 μmol/L), SP600125 (JNKi, 10 μmol/L) or GSK2126458 (PI3Ki, 0.1 μmol/L). Twenty μg of protein were loaded per sample. β-TUBULIN was used as loading marker. I Western blot of PITPNC1 and KRAS expression in Kraslox/lox MEFs transduced with different human HA-tagged KRAS mutants (G12C, G12D, G12V, G12R, G12S, G13D and Q61H). 4OHT: 600 nM. PITPNC1 mRNA expression levels in no loss of heterozygosity (no LOH) and loss of heterozygosity (LOH) TCGA LUAD patients. no LOH vs LOH (p = 0.047)
Fig. 2
Fig. 2
PITPNC1 inhibition in LUAD and PDAC cells reduce cell proliferation and impair tumour growth in vivo. A Western blot of PITPNC1 expression in A549, H358, H2009, H1792 LUAD cell lines and PATU8902, Panc1, MiaPaca2 PDAC cell lines transfected with a control (GFPsh) or a specific shRNA against PITPNC1 (PITPNC1 sh6 and sh7). Twenty μg of protein were loaded per sample. β-TUBULIN was used as loading marker. B Relative proliferation of A549 H23, H358, H2009, H1792, H2347 LUAD cell lines and PATU8902, Panc1, MiaPaca2 and HPAFII PDAC cell lines. Cells were transfected with a control (GFPsh) or a specific shRNA against PITPNC1 (PITPNC1 sh6 and sh7) (Dunnett´s multiple comparation test). C Representative images and quantification of clonogenic ability (mean ± std. error). D Tumour volume (mm3) of A549-derived xenografts (n = 6) (Dunnett’s multiple comparison test). E Representative images of tumours of D. F Tumour weight (g) of A549-derived xenografts (n = 6) of D at end point. G Tumour volume (mm3) of PATU8902-derived xenografts (n = 8) (Dunnett’s multiple comparison test). H Representative images of tumours of G. I Tumour weight (g) of PATU8902-derived xenografts (n = 8) of G at end point. J pH3 and CC3 quantification of A549-derived xenografts of D at end point. (Mann Whitney test). K pH3 and CC3 quantification of PATU8902-derived xenografts of G at end point (Mann Whitney test). L Representative images of lung photon flux ratio of A549 GFP/luciferase PITPNC1-overexpressing cells OE compared with the control (GFP/luciferase) (n = 8) at the indicated days. M Lung photon flux ratio of L (Bonferroni´s multiple comparison test). N Lung tumour nodules quantification on the lungs extracted from L (Mann Whitney test). O Liver foci quantification in the liver extracted from L (Mann Whitney test). P Representative images of lung tumour nodules quantification from N. Q Representative images of liver foci quantification from O
Fig. 3
Fig. 3
A PITPNC1 gene signature features KRAS-regulated genes and predicts poor LUAD and PDAC patients’ outcome. A Heat map of downregulated and upregulated genes in A549 cells after PITPNC1 inhibition with two specific shRNAs (sh6 and sh7) or control (GFPsh). B Gene set enrichment analysis (GSEA) of the dPITPNC1 gene signature in the comparison of both genetically and pharmacologically KRAS inhibition (tet-shKRAS, activated by 1 µg/ml doxycycline, or KRASiARS1620 respectively) vs control (GFP or DMSO respectively). C GSEA of the dPITPNC1 gene signature in the comparison of gene expression data from cancer cell lines (iKrasC) and xenograft tumours (iKrasT) derived from an inducible genetically engineered mouse (GEM) model of Kras-driven PDAC in which doxycycline administration activates expression of a mutant Kras allele. D GSEA of the dPITPNC1 gene signature in the comparison of mut vs wt KRAS LUAD in four data sets. E GSEA of the dPITPNC1 gene signature in the comparison of PDAC vs normal tissue in two data sets. F Survival analysis of LUAD patients (TCGA data set) stratified by the dPITPNC1 gene signature (Log-rank test p = 0.0059). G Survival analysis of LUAD patients (Shedden et al. data set) stratified by the dPITPNC1 gene signature (Log-rank test p = 0.01772). H Survival analysis of PDAC patients (ICGC data set) stratified by the dPITPNC1 gene signature (Log-rank test p = 0.0081). I Survival analysis of PDAC patients (TCGA data set) stratified by the dPITPNC1 gene signature (Log-rank test p = 0.0137)
Fig. 4
Fig. 4
PITPNC1 loss induces a G1 phase arrest linked to MYC downregulation. A Gene Ontology analysis of the downregulated PITPNC1 gene set (dPITPNC1 GS). B and C Cell cycle analysis by EdU labelling in the human LUAD A549 and H2009 (B), and PDAC HPAFII and Panc1 (C) cell lines after PITPNC1 knockdown with a specific shRNA (sh6 or sh7) compared to control (GFPsh). (Bonferroni´s multiple comparison test). MYC mRNA expression in A549, H2009 and H1792 LUAD and PDAC PATU8902, Panc1 and HPAFII cell lines expressing a specific shRNA (sh6 or sh7) compared to control (GFPsh) (Dunnet´s multiple comparison test). E MYC protein expression in the A549, H2009 and H1792 LUAD cell lines after PITPNC1 knockdown with a specific shRNA (sh6 or sh7) compared to control (GFPsh). Twenty μg of protein were loaded per sample. β-TUBULIN was used as loading marker. F MYC protein expression in Panc1, HPAFII and MiaPaca2 PDAC cell lines after PITPNC1 knockdown with a specific shRNA (sh6 or sh7) compared to control (GFPsh). Twenty μg of protein were loaded per sample. β-TUBULIN was used as loading marker. G E2F1 and p27 protein expression in the A549, H2009 and H1792 LUAD cell lines after PITPNC1 knockdown with a specific shRNA (sh6 or sh7) compared to control (GFPsh). Twenty μg of protein were loaded per sample. β-TUBULIN was used as loading marker. H E2F1 and p27 protein expression in the PATU8902, HPAFII and MiaPaca2 PDAC cell lines after PITPNC1 knockdown with a specific shRNA (sh6 or sh7) compared to control (GFPsh). Twenty μg of protein were loaded per sample. HSP90 was used as loading marker. I MYC and PITPNC1 protein expression in H2009 and PATU8902 MYC-overexpressing cells after PITPNC1 knockdown with a specific shRNA (sh6 or sh7) compared to control (GFPsh) and treated with DMSO or MG132 (10 μM, 6 h). Twenty μg of protein were loaded per sample. HSP90 was used as loading marker. J AURKA and PLK1 protein expression in A549, H2009 and H1792 LUAD cell lines after PITPNC1 knockdown with a specific shRNA (sh6 or sh7) compared to control (GFPsh). Twenty μg of protein were loaded per sample. HSP90 was used as loading marker. K AURKA and PLK1 protein expression in Panc1, HPAFII and MiaPaca2 PDAC cell lines after PITPNC1 knockdown with a specific shRNA (sh6 or sh7) compared to control (GFPsh). Twenty μg of protein were loaded per sample. HSP90 was used as loading marker. L MYC protein levels in A549 and H1792 LUAD and Panc1 and HPAFII PDAC cell lines treated with DMSO, PLK1i (BI2536, 50–100 nM, 48 h), or both PLK1i plus proteasome inhibitor (MG132, 10 μM 6 h). Twenty μg of protein were loaded per sample. HSP90 was used as loading marker
Fig. 5
Fig. 5
PITPNC1 controls mTOR localization to prevent autophagy. A Gene Ontology analysis of the upregulated PITPNC1 gene set (uPITPNC1 GS). B and SESN1, SESN2 and SESN3 expression levels in A549 (B) and HPAFII (C) cell lines were measured by qPCR. Cells were virally infected to express a control (GFPsh) or a PITPCN1 shRNA (sh6 and sh7) (Dunnet’s multiple comparison test). GAPDH was used as housekeeping gene. D and E mTOR/LAMP1 colocalization analysis by immunofluorescence in A549 (D) and HPAFII (E) PITPNC1-depleted cells. F and G Quantification of mTOR/LAMP1 Mander’s overlap coefficient (MOC) in A549 (F) and (G) of D and E (Dunnett’s multiple comparison test). H Lysosomes per cell and average lysosomes size in A549 of D (Dunn’s multiple comparison test). I Lysosomes per cell and average lysosomes size in HPAFII of E (Dunn’s multiple comparison test). J Western blots of LC3-I and LC3-II protein levels in a LUAD (n = 3) and PDAC (n = 3) cell lines expressing a shRNA control (C) or two PITPNC1 shRNAs (sh6 and sh7). Twenty μg of protein were loaded per sample and HSP90 was used as loading control. K Western blots of protein levels of LC3-I and LC3-II in a LUAD (n = 3) and PDAC (n = 1) cell lines expressing a shRNA control (C) or two MYC shRNAs (sh42 snd sh89). Twenty μg of protein were loaded per sample and HSP90 was used as loading control. L Proposed model for the role of PITPNC1 in KRAS-driven LUAD and PDAC
Fig. 6
Fig. 6
JAK2 inhibitors reverse the expression of the PITPNC1-regulated transcriptome and synergize with Sotorasib. A Connectivity Map (CMap) analysis of dPITPNC1 GS obtained in A549 cells. Perturbagen classes with mean connectivity scores > 90% are displayed. Each dot represents and individual drug included in the specific class. B Fedratinib (Fedra) IC50 index in a panel of LUAD and PDAC cell lines treated with the drug for 5 days. C Western blots of MYC and LC3-I/LC3-II in H358, H2009, HPAFII and MiaPaca2 treated with DMSO (C), and 2 or 10 μM of Fedra 48 h. Twenty μg of protein were loaded per sample and HSP90 was used as loading control. D Heatmaps of H1792, H2030, H358, H23 and MiaPaca2 cell viability percentage after treatment for 5 days with different concentrations of Sotorasib (Soto) and Fedra, individually or in combination. E and F Effects of Soto and Fedra combination on cell viability of mut KRAS LUAD cells (H1792 and H358) grown in 3D culture conditions, 5 days after drug treatment. Soto: 60 nM; Fedra: 1 μM. (Dunnett’s multiple comparison test). G Western blots of KRAS, pERK1/2, ERK1/2, pSTAT3, STAT3, HSP90, caspase 3, cleaved caspase 3 and GAPDH in H358 and MiaPaca2 cell lines treated with vehicle (Ctrl), 20 nM Soto, 1 μM Fedra, or both (Combo) for 48 h. Twenty μg of protein were loaded per sample. HSP90 and GAPDH were used as loading controls. H Representative image and quantification of clonogenic capacity of H2030 (Soto: 5 nM; Fedra: 0.5 µM), H358 (Soto: 5 nM; Fedra: 0.25 µM), H23 (Soto: 5 nM; Fedra: 0.5 µM) H1792 (Soto: 20 nM; Fedra: 0.5 µM) and MiaPaca2 (Soto: 20 nM; Fedra: 0.5 µM) cells treated with the indicated drugs and concentrations for 10 days, (Dunnett’s multiple comparison test). I Heatmaps showing cell viability percentage of Soto-resistant (SR) H23 and H358 cell lines treated with different concentrations of Soto and Fedra, individually or in combination. J Synergistic score (Bliss score) heatmaps of Soto-resistant (SR) H23 and H358 cells treated for 5 days as indicated
Fig. 7
Fig. 7
Antitumour activity of combined JAK2 and KRASG12C inhibitors in vivo. A Tumour volume (mm3) of cell-derived tumours from H358 cells treated with indicated drugs (Sotorasib -Soto-: 10 mg/kg once daily; Fedratinib -Fedra-: 60 mg/kg twice daily). n = 10–12 tumours per group (Tukey’s multiple comparison test). B Representative images of tumours in A. C Waterfall plots of cell-derived tumours from H358 cells at the last day of experiment after being treated with the indicated drugs. D Tumour weight (g) of H358 cell-derived tumours of the tumours of A at end point (Dunnett’s multiple comparison test). E and F pH3 (E) and CC3 (F) quantification of H358 derived xenografts at end point (Dunnett’s multiple comparison test). G Tumour volume (mm3) of tumours derived from MiaPaca2 cells treated with indicated drugs (Soto: 10 mg/kg once daily; Fedra: 60 mg/kg twice daily). n = 12 tumours per group, (Tukey’s multiple comparison test). H Representative images of tumours in G. I Waterfall plots of cell-derived tumours from MiaPaca2 cells at the last day of experiment after being treated with the indicated drugs. J Tumour weight (g) of MiaPaca2 cell-derived tumours of the tumours from I (Dunnett’s multiple comparison test). K and L pH3 (E) and CC3 (F) quantification of MiaPaca2-derived xenografts at end point (Dunnett’s multiple comparison test)

References

    1. Cox AD, Fesik SW, Kimmelman AC, Luo J, Der CJ. Drugging the undruggable RAS: Mission possible? Nat Rev Drug Discov. 2014;13:828–851. doi: 10.1038/nrd4389. - DOI - PMC - PubMed
    1. Johnson C, Burkhart DL, Haigis KM. Classification of KRAS-activating mutations and the implications for therapeutic intervention. Cancer Discov. 2022;12:913–923. doi: 10.1158/2159-8290.CD-22-0035. - DOI - PMC - PubMed
    1. Drosten M, Barbacid M. Targeting the MAPK pathway in KRAS-driven tumors. Cancer Cell. 2020;37:543–550. doi: 10.1016/j.ccell.2020.03.013. - DOI - PubMed
    1. Stephen AG, Esposito D, Bagni RK, McCormick F. Dragging ras back in the ring. Cancer Cell. 2014;25:272–281. doi: 10.1016/j.ccr.2014.02.017. - DOI - PubMed
    1. Vallejo A, et al. An integrative approach unveils FOSL1 as an oncogene vulnerability in KRAS-driven lung and pancreatic cancer. Nat Commun. 2017;8:14294. doi: 10.1038/ncomms14294. - DOI - PMC - PubMed

Publication types

MeSH terms