. 2023 May 20;16(1):43.
doi: 10.1186/s13041-023-01035-9.

Interneuronal GluK1 kainate receptors control maturation of GABAergic transmission and network synchrony in the hippocampus

Affiliations

Interneuronal GluK1 kainate receptors control maturation of GABAergic transmission and network synchrony in the hippocampus

Simo Ojanen et al. Mol Brain. .

Abstract

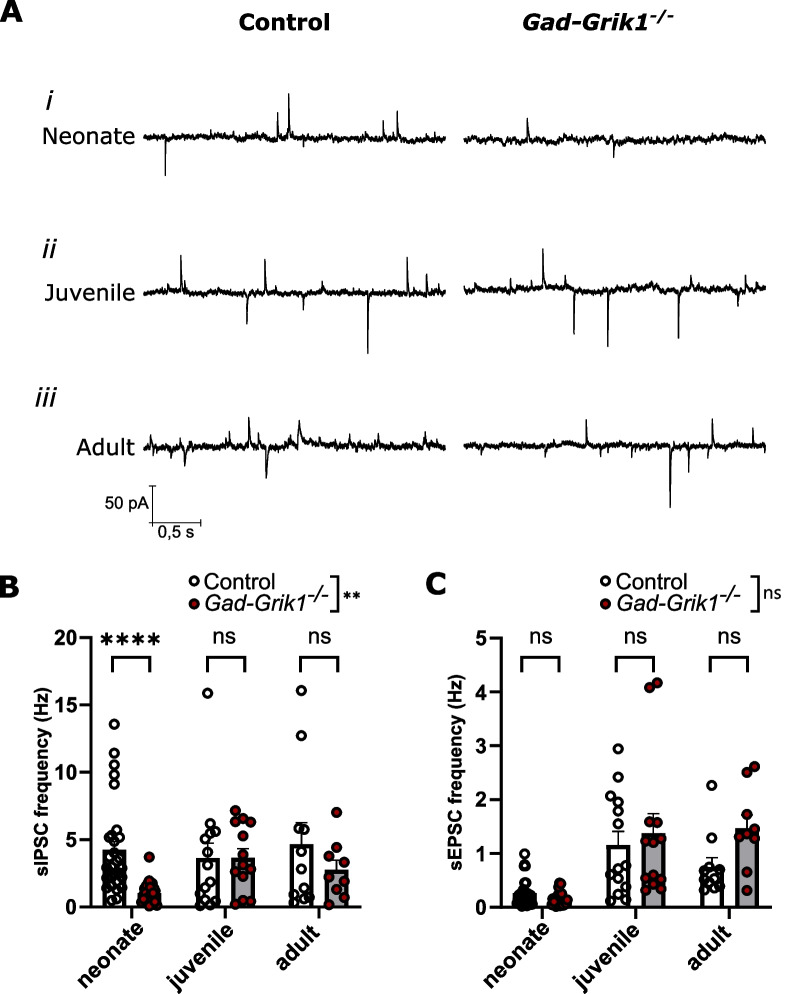
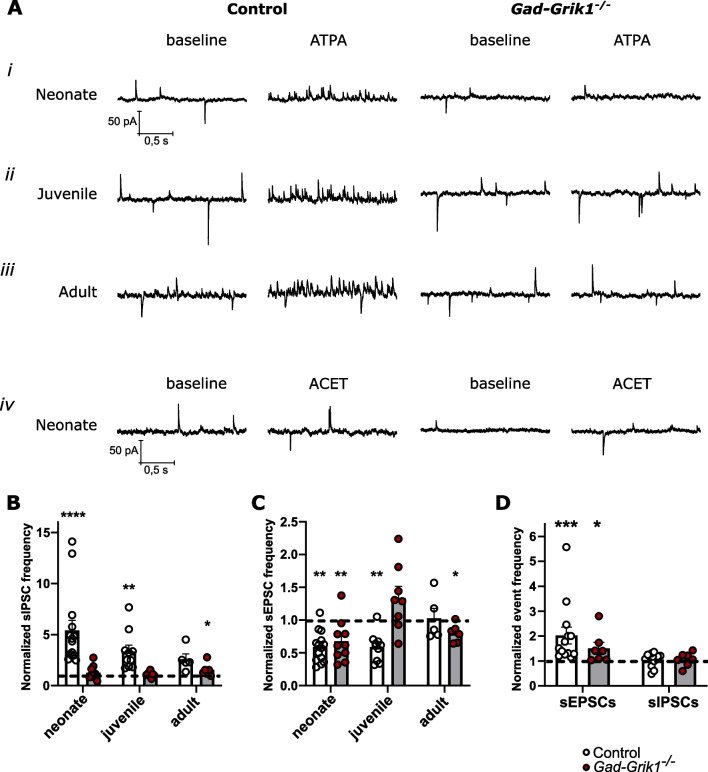
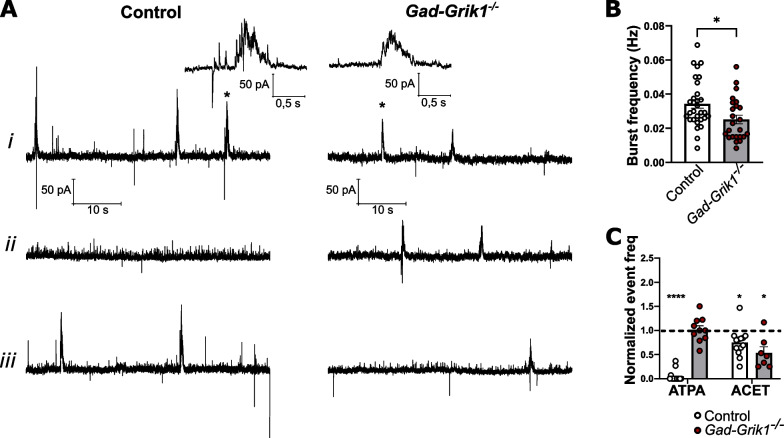
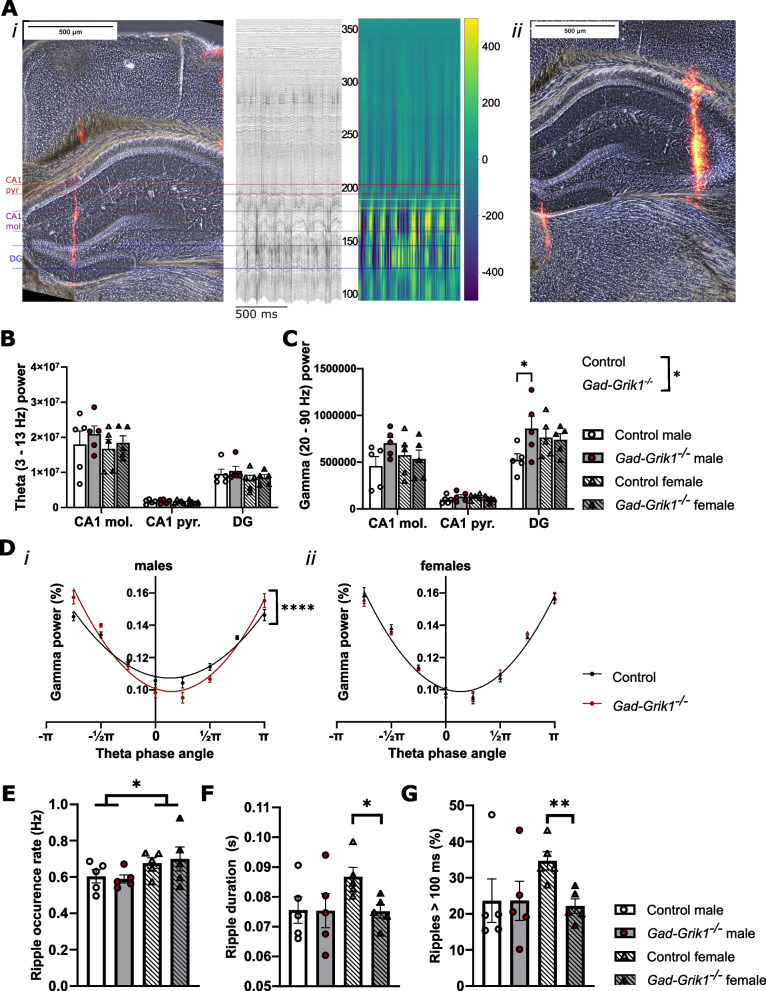
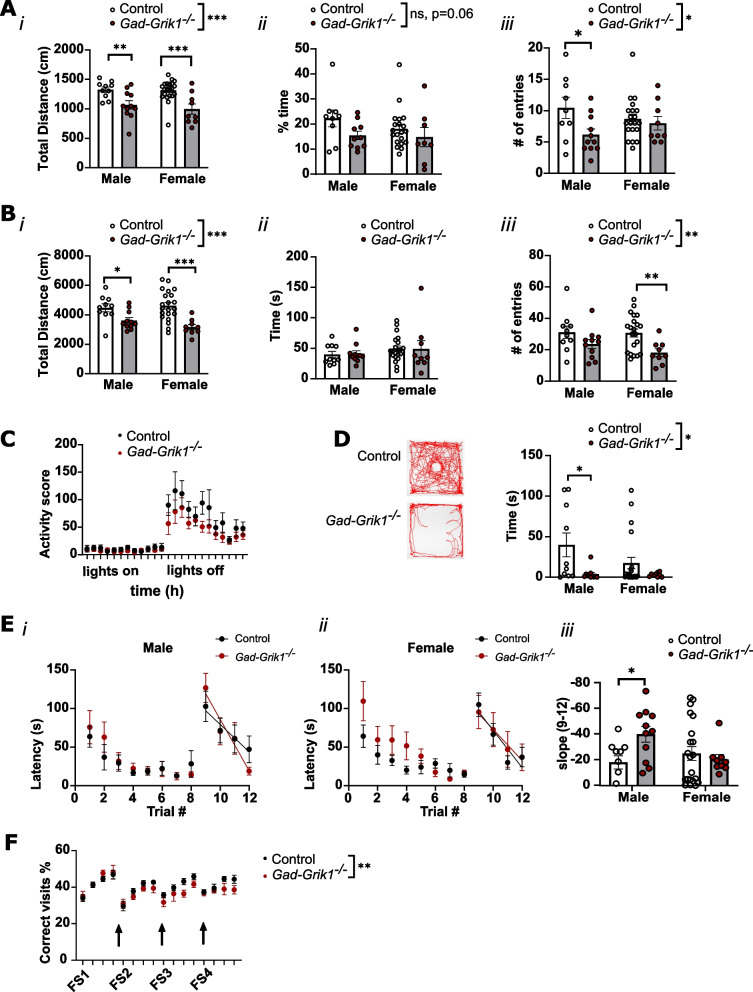
Kainate type glutamate receptors (KARs) are strongly expressed in GABAergic interneurons and have the capability of modulating their functions via ionotropic and G-protein coupled mechanisms. GABAergic interneurons are critical for generation of coordinated network activity in both neonatal and adult brain, yet the role of interneuronal KARs in network synchronization remains unclear. Here, we show that GABAergic neurotransmission and spontaneous network activity is perturbed in the hippocampus of neonatal mice lacking GluK1 KARs selectively in GABAergic neurons. Endogenous activity of interneuronal GluK1 KARs maintains the frequency and duration of spontaneous neonatal network bursts and restrains their propagation through the hippocampal network. In adult male mice, the absence of GluK1 in GABAergic neurons led to stronger hippocampal gamma oscillations and enhanced theta-gamma cross frequency coupling, coinciding with faster spatial relearning in the Barnes maze. In females, loss of interneuronal GluK1 resulted in shorter sharp wave ripple oscillations and slightly impaired abilities in flexible sequencing task. In addition, ablation of interneuronal GluK1 resulted in lower general activity and novel object avoidance, while causing only minor anxiety phenotype. These data indicate a critical role for GluK1 containing KARs in GABAergic interneurons in regulation of physiological network dynamics in the hippocampus at different stages of development.

Keywords: Cognitive flexibility; GABAergic interneuron; Gamma oscillation; Glutamate receptor; Hippocampus; Kainate receptor; Network synchronization.


Conflict of interest statement

The authors declare no competing interests.

Figures

Fig. 1
Fig. 1
Ablation of GluK1 in GABAergic interneurons attenuates GABAergic synaptic activity in the neonatal but not juvenile or adult CA3. A Example traces of whole-cell patch-clamp recordings from neonatal (i), juvenile (ii) and adult (iii) control (left) and Gad-Grik1−/− (right) mice with sIPSCs appearing as outward and sEPSCs as inward currents. B, C Basal frequency of sIPSCs (B) and sEPSCs (C) in pyramidal CA3 cells from acute control and Gad-Grik1−/− mice slices across different age groups (neonatal: n = 30 (21) and 24 (19); juvenile: n = 14 (12) and 13(11); adult: n = 11 (10) and 9 (9), for control and Gad-Grik1−/− respectively; n refers to number of cells, followed by number of animals in parenthesis. Bars represent mean ± SEM. Frequencies were compared by 2-way ANOVA with multiple Mann–Whitney test as a post-hock to detect differences in genotype for each age group. **** p < 0.000001 (Mann–Whitney test)
Fig. 2
Fig. 2
Pharmacological characterization of spontaneous synaptic activity in Gad-Grik1−/− mice. A Example traces of recordings from neonatal (i and iv), juvenile (ii) and adult (iii) control (left columns) and Gad-Grik1−/− (right columns) slices, before (baseline) and during ATPA (i, ii, iii) or ACET (iv) application. B Pooled data illustrating the effect of ATPA (1 µM) on sIPSC frequency in CA3 pyramidal cells from acute control and Gad-Grik1−/− slices at different stages of development (neonatal: n = 14 (10) and 10 (10); juvenile: n = 10 (10) and 8 (7); adult: n = 5 (5) and 6 (6), for control and Gad-Grik1−/−, respectively). C Effect of ATPA on sEPSC frequency, for the same cells as in B. D Effect of ACET (200 nM) on the frequency of sEPSCs and sIPSCs in neonatal control and Gad-Grik1−/− slices (n = 13 (N = 10) and 7 (6), for control and Gad-Grik1−/−, respectively). Bars represent mean ± SEM. Frequency of events is normalized to the baseline (dashed line). Activity during ATPA / ACET application is compared to the baseline by paired t-test or Wilcoxon paired test. ****p < 0.0001; ***p < 0.001; **p < 0.01; *p < 0.05
Fig. 3
Fig. 3
Pharmacological characterization of spontaneous network activity in neonatal Gad-Grik1−/− mice. A Example traces of spontaneous activity in baseline (i) and upon ATPA (ii) or ACET (iii) application, recorded from CA3 pyramidal cells in acute slices from control (left) and Gad-Grik1−/− (right) mice (P4-6). Inserts on top represent network bursts (marked with asterisk) in expanded time scale. B Basal frequency of spontaneous network bursts from acute control (n = 30 (21)) and Gad-Grik1−/− (n = 24 (19)) neonatal slices (P4-6). *p < 0.05, upaired t-test test. C Effect of ATPA (1 µM) and ACET (200 nM) on burst frequency in control and Gad-Grik1−/− groups. ATPA, n = 14(10) and 10(10); ACET n = 13(10) and 7(6) for control and Gad-Grik1−/−, respectively. Frequency is normalized to the baseline (dashed line). ****p < 0.0001; **p < 0.01; *p < 0.05, paired t-test
Fig. 4
Fig. 4
Longitudinal characterization of spontaneous network activity in organotypic hippocampal cultures from neonatal Gad-Grik1−/− mice. A Example traces of the extracellular recordings across hippocampal regions in control and Gad-Grik1−/− cultures at DIV5. The inserts show typical bursts with the CA1/CA3–DG phase shift. Red arrowheads mark network bursts. B Frequency of spikes detected in the CA1 (i), CA3 (ii) and DG (iii) regions of control (n = 12 (6)) and Gad-Grik1−/− cultures (n = 9 (6)). Both genotypes show equal spike rates in the CA1 and DG regions, but the frequency of spikes in area CA3 is lower in the Gad-Grik1−/− as compared to controls (p = 0.0001, 2-way ANOVA). C Frequency of spontaneous bursts in the CA1, CA3, DG regions of control (n = 11(6)) and Gad-Grik1−/− slices (n = 9 (6)) at indicated DIV (p < 0.05, 2-way ANOVA). D Duration of spontaneous bursts in CA1, CA3, DG regions of control (n = 11(6)) and Gad-Grik1−/− (n = 9(6)) slices at indicated DIV  (p < 0.01, 2-way ANOVA). E Image of the hippocampal organotypic culture on MEA probe (left) and example heat maps showing the spread of network activity following a spike in the DG, in control and Gad-Grik1−/− cultures at 5 DIV. F Time course plot illustrating the mean number of spatially adjacent MEA channels (out of total 64) displaying activity during a 100 ms time period after a DG spike in control (n = 10(6)) and Gad-Grik1−/− (n = 9(6)) cultures. The dashed blue line denotes the time point of DG spike. G Pooled data on the maximum number of spatially adjacent active channels during the first 20 ms following a DG spike (*p < 0.05, Mann–Whitney U-test). H The same data as in F, normalized to the first 4 time bins (20 ms) following the spike. (** p < 0.01, 2-way ANOVA). I Normalized number of spatially adjacent active channels 30–70 ms after the DG spike (****p < 0.0001, Mann–Whitney U-test.). Bars represent mean ± SEM. The n-values refer to number of cultures, followed by number of animals in parenthesis
Fig. 5
Fig. 5
Physiological network oscillations are altered in the adult hippocampus in absence of GluK1 expression in the GABAergic neurons. A Image illustrating the localization of the fluorescently labelled recording electrode in a coronal section from the mouse hippocampus, in CA1 –DG (i) and CA3 (ii). The traces show an example of the LFP recording of oscillatory activity at different regions of the male control mouse hippocampus, and the heat map illustrates the color-coded voltage plots at identical time-scale after 350 Hz low pass filtering. B Oscillatory power in the theta (4–12 Hz) frequency range for channels located in the CA1 stratum moleculare (CA1 mol), CA1 stratum pyramidale (CA1 pyr) and dentate gyrus (DG), for male and female control and Gad-Grik1−/− mice (n = 5 / group). C Oscillatory power in the gamma (20–90 Hz) frequency range, for the same recordings as in B. * p < 0.05, 2-way ANOVA, Tukey’s correction for multiple comparisons). D Oscillatory power in the gamma range, as function of the theta phase angle divided into 8 equal sized bins. The solid lines represent second order polynomial (quadratic) curve fit. Gamma power in the CA1 is more strongly modulated by theta phase (**** p < 0.0001, n = 5, quadratic regression, sum-of-squares F test) in male (i), but not in female (ii) (n = 5, quadratic regression, sum-of-squares F test) Gad-Grik1−/− mice. E Rate of occurrence of ripple oscillations in the CA1 pyramidal layer. * p < 0.05, 2-way ANOVA. F Duration of ripple oscillations detected in the CA1 pyramidal layer. *p < 0.05, unpaired t-test. G Percentage of ripples lasting more than 100 ms. All data from idle or resting epochs, detected from videos recorded simultaneously with the electrophysiological recording. ** p < 0.005, unpaired t-test. Bars in all panels represent mean ± SEM
Fig. 6
Fig. 6
Behavioral phenotype in Gad-Grik1−/− shows reduced activity and altered cognitive flexibility. A EPM test. (i) total distance traveled (ii) time spent in the open arms (iii) entries to the open arms. * p < 0.05; ** p < 0.01; *** p < 0.001; Holm-Šídák posthoc test after 2-way ANOVA. B OF test. (i) total distance traveled (ii) time spent in the central zone (iii) entries to the central zone. * p < 0.05; ** p < 0.01; *** p < 0.001; Holm-Šídák posthoc test after 2-way ANOVA. C Home-cage activity for single-housed male control and Gad-Grik1−/− mice. The activity score is plotted against time of the day, with 1 h bins. *** p < 0.001, 2-way ANOVA. D OF test, with a novel object placed in the center of the field. Example tracks traveled by a control and Gad-Grik1−/− mouse, and pooled data for the time spent in the central zone. * p < 0.05; Holm-Šídák posthoc test after 2-way ANOVA. E Barnes maze test. Latency to the correct hole in the Barnes maze during training (trials 1–8) and after relocation of the escape box (trials 9–12) for male (i) and female (ii) control and Gad-Grik1−/− mice. (iii) Pooled data on the slope of the learning curve between trials 9–12 (* p < 0.05, two-tailed unpaired t-test). F Flexible sequencing task in the IntelliCage. Arrows denote location reversal times. Gad-Grik1−/− female mice show less correct visits and more incorrect visits after the second reversal. ** p < 0.01, 2-way ANOVA. For all the behavioral data, controls, n = 10 and n = 21, Gad-Grik1−/− n = 11 and n = 9, for males and females, respectively. As an exception, control, n = 15, Gad-Grik1−/− n = 9 for the data in panel F

References

    1. Ben-Ari Y, Gaiarsa J-L, Tyzio R, Khazipov R. GABA: a pioneer transmitter that excites immature neurons and generates primitive oscillations. Physiol Rev. 2007;87(4):1215–1284. doi: 10.1152/physrev.00017.2006. - DOI - PubMed
    1. Duan ZRS, Che A, Chu P, Modol L, Bollmann Y, Babij R, Fetcho RN, Otsuka T, Fuccillo MV, Liston C, Pisapia DJ, Cossart R, De Marco García NV. GABAergic restriction of network dynamics regulates interneuron survival in the developing cortex. Neuron. 2020;105(1):75–92.e75. doi: 10.1016/j.neuron.2019.10.008. - DOI - PMC - PubMed
    1. Lamsa K, Palva JM, Ruusuvuori E, Kaila K, Taira T. Synaptic GABA(A) activation inhibits AMPA-kainate receptor-mediated bursting in the newborn (P0–P2) rat hippocampus. J Neurophysiol. 2000;83(1):359–366. doi: 10.1152/jn.2000.83.1.359. - DOI - PubMed
    1. Wester JC, McBain CJ. Interneurons differentially contribute to spontaneous network activity in the developing hippocampus dependent on their embryonic lineage. J Neurosci. 2016;36(9):2646–2662. doi: 10.1523/JNEUROSCI.4000-15.2016. - DOI - PMC - PubMed
    1. Huupponen J, Molchanova SM, Lauri SE, Taira T. Ongoing intrinsic synchronous activity is required for the functional maturation of CA3-CA1 glutamatergic synapses. Cereb Cortex. 2013;23(11):2754–2764. doi: 10.1093/cercor/bhs262. - DOI - PubMed

Publication types

LinkOut - more resources