. 2023 May 20;14(1):2894.
doi: 10.1038/s41467-023-38594-3.

Alanine supplementation exploits glutamine dependency induced by SMARCA4/2-loss

Affiliations

Alanine supplementation exploits glutamine dependency induced by SMARCA4/2-loss

Xianbing Zhu et al. Nat Commun. .

Abstract

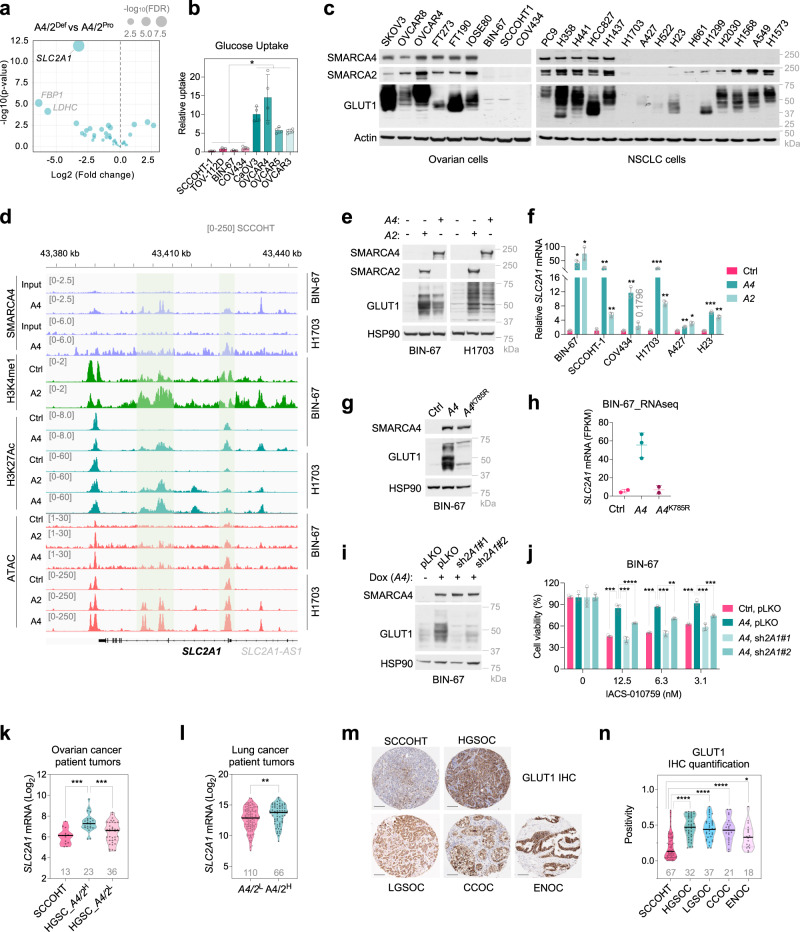
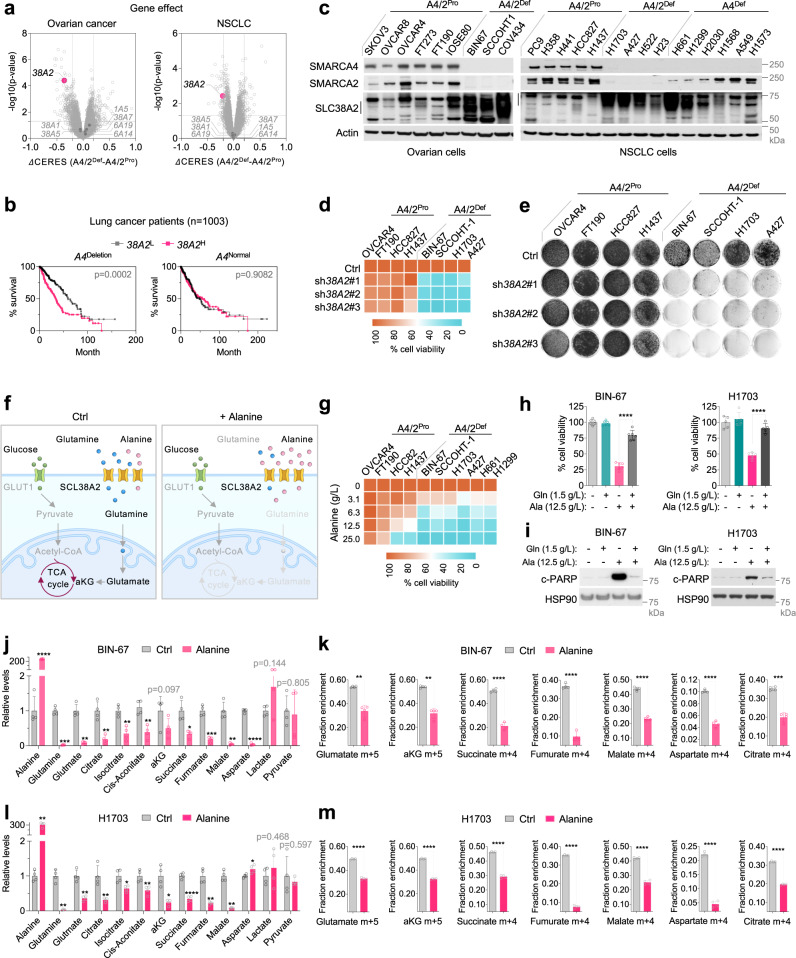
SMARCA4 (BRG1) and SMARCA2 (BRM) are the two paralogous ATPases of the SWI/SNF chromatin remodeling complexes frequently inactivated in cancers. Cells deficient in either ATPase have been shown to depend on the remaining counterpart for survival. Contrary to this paralog synthetic lethality, concomitant loss of SMARCA4/2 occurs in a subset of cancers associated with very poor outcomes. Here, we uncover that SMARCA4/2-loss represses expression of the glucose transporter GLUT1, causing reduced glucose uptake and glycolysis accompanied with increased dependency on oxidative phosphorylation (OXPHOS); adapting to this, these SMARCA4/2-deficient cells rely on elevated SLC38A2, an amino acid transporter, to increase glutamine import for fueling OXPHOS. Consequently, SMARCA4/2-deficient cells and tumors are highly sensitive to inhibitors targeting OXPHOS or glutamine metabolism. Furthermore, supplementation of alanine, also imported by SLC38A2, restricts glutamine uptake through competition and selectively induces death in SMARCA4/2-deficient cancer cells. At a clinically relevant dose, alanine supplementation synergizes with OXPHOS inhibition or conventional chemotherapy eliciting marked antitumor activity in patient-derived xenografts. Our findings reveal multiple druggable vulnerabilities of SMARCA4/2-loss exploiting a GLUT1/SLC38A2-mediated metabolic shift. Particularly, unlike dietary deprivation approaches, alanine supplementation can be readily applied to current regimens for better treatment of these aggressive cancers.


Conflict of interest statement

The authors declare no competing interests.

Figures

Fig. 1
Fig. 1. SMARCA4/2-loss in ovarian cancer cells results in impaired glycolysis and increased dependence on OXPHOS.
a Left, a volcano plot showing the differential dependency of genes between SMARCA4/2-deficient (A4/2Def; n = 5) and proficient (A4/2Pro; n = 32) ovarian cancer cell lines, using the CERES gene effect data from DepMap genome-wide CRISPR-knockout screens (two-tailed t-test). Each dot denotes a gene. Genes whose deletion selectively impairs the growth of SMARCA4/2-deficient cancer cells (in red) were subjected to Gene Set Enrichment Analysis (GSEA). Right, dot plot reflecting the GO analysis of the top 200 hits essential for SMARCA4/2-deficient cancer cells. b Density plot showing the differential dependency of indicated gene groups between SMARCA4/2-deficient and proficient ovarian cancer cell lines as described in (a). Each line denotes a gene. p, p value; Kolmogorov Smirnov tests for OXPHOS or glycolysis genes compared to the whole genome. c Quantification of basal respiration (p = 0.1905), maximum respiratory capacity (p = 0.1213) and ATP-linked respiration (p = 0.0156) in indicated cell lines measured by Seahorse Mito Stress Test assay (two-tailed t-test, n = 5 independent experiments). d Quantification of basal glycolysis (p = 0.0222), glycolysis capacity (p = 0.0036) and glycolytic reserve (p = 0.0002) in indicated cell lines measured by Seahorse glycolysis stress test (two-tailed t-test, n  =  6 independent experiments). e Ratio of basal respiration to glycolysis between A4/2Def vs A4/2Pro ovarian cancer cell lines measured by Seahorse assays (two-tailed t-test, p = 0.0035). f Cell viability analyzes of the indicated cell lines treated with IACS-010759 for 3 days. n  =  3 independent experiments. g Colony-formation assay of cell lines treated with IACS-010759 for 10–15 days. h Immunoblots of cell lines treated with IACS-010759 for 3 days. Cl., cleaved. il Immunoblots (i, k) and cell viabilities (j, l) of BIN-67 cells, -/+ doxycycline (Dox)-inducible SMARCA4 (i, j) or SMARCA2 (k, l) re-expression, treated with IACS-010759 for 5 days. Two-tailed t-test, n  =  3 independent experiments. p values: j 0.0079, 0.0004, 0.0031; l 0.0006, 0.0131, 0.0249. *p < 0.05, **p < 0.01, ***p < 0.001. ns, not significant. Error bars, mean ± SD.
Fig. 2
Fig. 2. SMARCA4/2-loss causes GLUT1 deficiency contributing to OXPHOS dependency.
a Volcano plot of differentially expressed glycolysis genes between SMARCA4/2-deficient (A4/2Def) and proficient (A4/2Pro) ovarian cancer cell lines described in Fig. 1a. Each dot represents a gene. Wald test (DEseq2). b Cell line glucose uptake capacity. Two-tailed t-test, n  =  4 independent experiments, p values = 0.0286. c Immunoblots. d Representative browser track of ChIP-Seq and ATAC-Seq on the SLC2A1 locus in indicated cells ± SMARCA4/2,,. e Immunoblots of cell lines ± SMARCA4/2 restoration. f Relative SLC2A1 mRNA in cell lines ± SMARCA4/2 restoration by RT-qPCR. One-way ANOVA corrected for multiple comparisons, n  =  3 independent experiments. p values: BIN-67, 0.0386, 0.0459; SCCOHT-1, 0.0084, 0.0017; COV434, 0.0093, 0.1796; H1703, 0.0006, 0.0028; A427, 0.0022, 0.0201; H23, 0.0008, 0.0058. g Immunoblots of BIN-67 ± ectopic expression of wild type or an ATPase dead mutant (K785R) of SMARCA4. h SCL2A1 mRNA abundance (FPKM) in BIN-67 ± ectopic expression of SMARCA4 wild type or K785R obtained from GSE117311. i Immunoblots of BIN-67 expressing doxycycline (Dox) inducible SMARCA4 ± pLKO control or shRNAs targeting SLC2A1 (sh2A1). j Cell viability of the cells described in (i) treated with IACS-010759 for 5 days. One-way ANOVA corrected for multiple comparisons, n  =  3 independent experiments. p values: pLKO vs sh2A1#2 (12.5), 0.0006, pLKO vs sh2A1#2 (3.1), 0.0007, others <0.0001. k, l Violin plot showing SLC2A1 mRNA levels in SCCOHT, HGSOC (k) and lung cancer (l) patient tumors stratified based on SMARCA4/2 expression by quartile. H: high; L: low. Left, one-way ANOVA corrected for multiple comparisons, p values: 0.0001, 0.0007; right, two-tailed t-test, p value: 0.0086. m, n Representative images (m) and quantification (n) of GLUT1 immunohistochemistry (IHC) analysis of SCCOHT patient tumors compared to other ovarian carcinoma subtypes. HGSOC, high-grade serous ovarian carcinoma, LGSOC, low-grade serous ovarian carcinoma, CCOC, clear cell ovarian carcinoma, ENOC, endometrioid ovarian carcinoma. Scale bar: 100 μm. One-way ANOVA corrected for multiple comparisons (ENOC – 0.0208, others <0.0001). Patient numbers are indicated in grey below each group. *p < 0.05, **p < 0.01, ***p < 0.001, ****p < 0.0001. Error bars, mean ± SD.
Fig. 3
Fig. 3. SMARCA4/2 loss shifts cancer cells to use glutamine as a carbon source for energy supply.
a Density plot showing 70 metabolites related to the TCA cycle in BIN-67 cells ± SMARCA4 restoration measured by GC/MS. Each line denotes a metabolite. b Heatmap showing relative cell viability of indicated cell lines after culturing in medium containing different concentrations of glucose or glutamine for 4 days. c Colony-formation assay of the indicated cell lines cultured in the presence of different concentrations of glutamine or glucose for 10–14 days. For each cell line, all dishes were fixed simultaneously. d, e Seahorse Mito Stress Test measuring mitochondrial oxygen consumption rate (OCR) in indicated cell lines cultured in the absence of glucose or glutamine. Different effects of glucose or glutamine deprivation on mitochondrial respiration. Basal respiration, maximum respiratory capacity, proton leak, and ATP production were computed in OVCAR4, H1437 (d), BIN-67, and H1703 (e) cells cultured with or without glucose or glutamine (OVCAR4, n  =  5; H1437, Ctrl, n = 6, -Glutamine, n = 5, -Glucose, n = 5; BIN-67, Ctrl, n = 6, -Glutamine, n = 6, -Glucose, n = 5; H1703, n  =  6 independent experiments). One-way ANOVA corrected for multiple comparisons. p values: OVCAR4, -Glutamine basal, 0.033, -Glutamine ATP - 0.0009; H1437, -Glutamine basal, 0.0154; others <0.0001. f Colony-formation assay of H1703 cells ± SMARCA4 restoration cultured in medium containing different concentrations of glucose or glutamine for 10-15 days. g Differential abundance of metabolites measured by GC/MS in BIN-67 cells cultured in the absence of glucose or glutamine. TCA intermediates are indicated in solid gray circles. h Steady-state abundance of metabolites measured by GC/MS in BIN-67 cells ± SMARCA4 restoration (two-tailed t-test, n = 4 independent experiments). p values (left to right): 0.0458, 0.0005, 0.0335, 0.0051, 0.0583, 0.0051, 0.0475, 0.0619, 0.0143, 0.0074, 0.0094, 0.0153, 0.501). A4: SMARCA4; A4/2: SMARCA4/2; Pro: Proficient; Def: Deficient. *p < 0.05, **p < 0.01, ***p < 0.001, ****p < 0.0001. Error bars, mean ± SD.
Fig. 4
Fig. 4. SMARCA4/2-loss drives the metabolic shift preferring glutamine than glucose to sustain the TCA cycle.
a Isotope tracing diagram for 13C6-glucose through glycolysis and into the TCA cycle via pyruvate carboxylase (PC, cyan) and pyruvate dehydrogenase (PDH, grey) pathways. Solid circle, 13C; open circle, 12C. b Relative total labeled 13C6-glucose and fractional isotopic incorporation of 13C6-glucose in BIN-67 cells ± SMARCA4 restoration (two-tailed t-test, n  =  4 independent experiments). p values (top): 0.0198, 0.1007, 0.0073, 0.0003, 0.0003, 0.0002, <0.0001; p values (bottom): 0.4937, 0.0879, 0.1047, 0.0893, 0.4046, 0.0489. c Diagram of stable isotope tracer analysis using uniformly labeled 13C5-glutamine. Solid circle, 13C; open circle, 12C. d Fractional isotopic incorporation of 13C5-glutamine into TCA cycle intermediates were measured by GC/MS (two-tailed t-test, n  =  4 independent experiments, p values: glutamine, 0.0007; others <0.0001) in BIN-67 cells ± SMARCA4 restoration, cultured in 13C5-glutamine containing medium for 1 h. m, number of labeled carbons. n  =  4 independent experiments. e Colony-formation assay of indicated cell lines ± glutaminase inhibitor (CB-839) for 10-15 days. f Cell viability of a panel of ovarian (3 days, n  =  4 independent experiments) and lung (7 days, n  =  3 independent experiments) cancer cell lines cultured in the presence of different concentrations of CB-839. g Cell viability of indicated cell lines cultured with or without CB-839 (0.5μM) or DMKG (2 mM), a cell permeable analog of α-KG, for 3 days (n  =  4 independent experiments). Two-tailed t-test, all p values < 0.0001. h, i Seahorse assay measuring mitochondrial OCR in indicated cell lines in the presence of CB-839 (100 nM) for 24 h. Basal respiration, maximum respiratory capacity, proton leak, and ATP production were computed to quantify effects of CB-839 on mitochondrial respiration (OVCAR4, Ctrl, n = 4, CB-839, n = 5; H1437, Ctrl, n = 5; H1703, n  =  6; BIN-67, n  =  6; H1703, Ctrl, n = 6, CB-839, n = 5 independent experiments). Two-tailed t-test. p values: H1437, basal, 0.0029, maximum, 0.0006, ATP, 0.0002; others <0.0001. A4: SMARCA4; A4/2: SMARCA4/2; Pro: Proficient; Def: Deficient. *p < 0.05, **p < 0.01, ***p < 0.001, ****p < 0.0001. ns, not significant. Error bars, mean ± SD.
Fig. 5
Fig. 5. SMARCA4/2-deficient cancer cells rely on elevated SLC38A2 to import glutamine which can be targeted by alanine through competition.
a Volcano plots showing the differential gene dependency between SMARCA4/2-deficient (A4/2Def) and proficient (A4/2Pro) ovarian (left) and lung (right) cancer cell lines, using CERES gene effect data from DepMap CRISPR-knockout screens. Two-tailed t-test. Each dot represents a gene. SLC38A2 (38A2). b Survival of lung cancer patients (SMARCA4Deletion, n = 456; SMARCA4Normal, n = 547) stratified by SLC38A2 expression (log-rank test). c Cell line immunoblots. The vertical lines indicate SCL38A2 range. d Heatmap showing cell viability of indicated cell lines expressing vector control or shRNAs targeting SLC38A2 (7 days). e Colony-formation assay of indicated cell lines expressing vector control or shRNAs targeting SLC38A2 (10–15 days). f A scheme depicting that alanine supplementation targets glutamine dependency of SMARCA4/2-deficient cancer cells. g Heatmap showing viability of cell lines cultured with different doses of alanine for 7 days. h, i Cell viability (h) and immunoblot (i) of BIN-67 and H1703 cells (n  =  5 independent experiments) cultured with indicated doses of alanine or glutamine for 4 (h, two-tailed t-test, p < 0.0001) or 3 (i) days. j, l Relative abundance of metabolites measured by GC/MS in BIN-67 (j) and H1703 (l) cells after treatment with alanine (6.25 g/L) for 14 h. k, m Fractional isotopic incorporation of 13C5-glutamine into TCA intermediates measured by GC/MS. BIN-67 (k) and H1703 (m) cells were pretreated with alanine (6.25 g/L) for 14 h and then cultured in medium containing 13C5-glutamine and alanine (6.25 g/L) for 1 h. m, number of labeled carbons. jm: two-tailed t-test, n  =  4 independent experiments. p values for j, l: BIN-67, from left to right, <0.0001, 0.0004, 0.0017, 0.0038, 0.0024, 0.0022, 0.0978, 0.0146, 0.0003, 0.0043, <0.0001, 0.1435, 0.8053; H1703, from left to right, 0.0033, 0.0015, 0.0022, 0.0164, 0.0224, 0.0094, 0.0102, <0.0001, 0.0035, 0.0011, 0.0367, 0.4681, 0.5966. p values for k, m: BIN-67, glutamine, 0.0032, aKG, 0.0015, citrate, 0.0003, other <0.0001; H1703, all <0.0001). *p < 0.05, **p < 0.01, ***p < 0.001, ****p < 0.0001. Error bars, mean ± SD.
Fig. 6
Fig. 6. Inhibitors targeting OXPHOS or glutaminase, and alanine supplementation-based treatments suppress the growth of SMARCA4/2-deficient tumors.
ac Tumor volumes of mice bearing tumors of SCCOHT PDX models (top, NRTO-1; bottom, 465) treated with IACS-010759 (a 7.5 mg/kg), CB839 (b 200 mg/kg), alanine (c 4 g/kg), or their matching vehicle controls (n = 5–8 for each arm, except for PDX 465, alanine n = 4). d Tumor volumes of mice bearing SCCOHT PDX NRTO-5 tumors treated with vehicle, IACS-010759 (7.5 mg/kg), alanine (4 g/kg) or their combination (n = 4 for each arm). e, f Tumor volumes of mice bearing SCCOHT PDX NRTO-5 (e) or SMARCA4/2-deficient NSCLC PDX TM01563 (f) tumors treated with vehicle, cisplatin (2 mg/kg), alanine (4 g/kg), or their combination (n = 4 for each arm). p values: all <0.0001 except for alanine group vs vehicle in (d), which is 0.0113. IACS, IACS-010759; Ala, alanine; Cis, cisplatin. Two-way ANOVA, *p < 0.05, ****p < 0.0001. Error bars, mean ± SEM.

References

    1. Kadoch C, Crabtree GR. Mammalian SWI/SNF chromatin remodeling complexes and cancer: Mechanistic insights gained from human genomics. Sci. Adv. 2015;1:e1500447. doi: 10.1126/sciadv.1500447. - DOI - PMC - PubMed
    1. Wilson BG, Roberts CW. SWI/SNF nucleosome remodellers and cancer. Nat. Rev. Cancer. 2011;11:481–492. doi: 10.1038/nrc3068. - DOI - PubMed
    1. Kadoch C, et al. Proteomic and bioinformatic analysis of mammalian SWI/SNF complexes identifies extensive roles in human malignancy. Nat. Genet. 2013;45:592–601. doi: 10.1038/ng.2628. - DOI - PMC - PubMed
    1. Marquez SB, Thompson KW, Lu L, Reisman D. Beyond mutations: additional mechanisms and implications of swi/snf complex inactivation. Front Oncol. 2014;4:372. - PMC - PubMed
    1. Hoffman GR, et al. Functional epigenetics approach identifies BRM/SMARCA2 as a critical synthetic lethal target in BRG1-deficient cancers. Proc. Natl Acad. Sci. USA. 2014;111:3128–3133. doi: 10.1073/pnas.1316793111. - DOI - PMC - PubMed

Publication types