. 2023 May 20;22(1):85.
doi: 10.1186/s12943-023-01786-y.

EZH2 mediated metabolic rewiring promotes tumor growth independently of histone methyltransferase activity in ovarian cancer

Affiliations

EZH2 mediated metabolic rewiring promotes tumor growth independently of histone methyltransferase activity in ovarian cancer

Jianfeng Chen et al. Mol Cancer. .

Abstract

Background: Enhancer of zeste homolog 2 (EZH2), the key catalytic subunit of polycomb repressive complex 2 (PRC2), is overexpressed and plays an oncogenic role in various cancers through catalysis-dependent or catalysis-independent pathways. However, the related mechanisms contributing to ovarian cancer (OC) are not well understood.

Methods: The levels of EZH2 and H3K27me3 were evaluated in 105 OC patients by immunohistochemistry (IHC) staining, and these patients were stratified based on these levels. Canonical and noncanonical binding sites of EZH2 were defined by chromatin immunoprecipitation sequencing (ChIP-Seq). The EZH2 solo targets were obtained by integrative analysis of ChIP-Seq and RNA sequencing data. In vitro and in vivo experiments were performed to determine the role of EZH2 in OC growth.

Results: We showed that a subgroup of OC patients with high EZH2 expression but low H3K27me3 exhibited the worst prognosis, with limited therapeutic options. We demonstrated that induction of EZH2 degradation but not catalytic inhibition profoundly blocked OC cell proliferation and tumorigenicity in vitro and in vivo. Integrative analysis of genome-wide chromatin and transcriptome profiles revealed extensive EZH2 occupancy not only at genomic loci marked by H3K27me3 but also at promoters independent of PRC2, indicating a noncanonical role of EZH2 in OC. Mechanistically, EZH2 transcriptionally upregulated IDH2 to potentiate metabolic rewiring by enhancing tricarboxylic acid cycle (TCA cycle) activity, which contributed to the growth of OC.

Conclusions: These data reveal a novel oncogenic role of EZH2 in OC and identify potential therapeutic strategies for OC by targeting the noncatalytic activity of EZH2.

Keywords: EZH2; IDH2; Metabolic rewiring; Ovarian cancer; TCA cycle.


Conflict of interest statement

The authors declare no potential conflicts of interest.

Figures
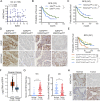
Fig. 1
Fig. 1
Overexpression of EZH2 with low H3K27me3 correlates with the worst prognosis in patients with OC (A) Correlation analysis between EZH2 and H3K27me3 levels in the OC cohort (n = 105). P value was determined by Pearson’s correlation test (B) Kaplan-Meier survival analysis for the OC cohort (n = 105), which was divided into EZH2high and EZH2low subgroups based on the cutoff (cutoff = 6) calculated by the X-Tile software. The P value was calculated by log-rank test. *P < 0.05 (C) Kaplan-Meier survival analysis for the OC cohort (n = 105), which was divided into H3K27me3high and H3K27me3low subgroups based on the cutoff (cutoff = 6) calculated by the X-Tile software. The P value was calculated by log-rank test. *P < 0.05 (D) Representative IHC images of EZH2 and H3K27me3. EZH2 and H3K27me3 levels were detected by IHC staining in a cohort of 105 patients with OC. Scale bar: 100 μm (E) Kaplan-Meier survival analysis for OC samples (n = 105) in four subgroups, which was classified based on EZH2 (cutoff = 6) and H3K27me3 (cutoff = 6) levels. The P value was calculated by log-rank test. *P < 0.05, **P < 0.01 (F) EZH2 log2(TPM) value in normal ovarian tissues (GTEx, n = 88) and ovarian cancer tissues (TCGA, n = 426). Data are presented as the mean ± SEM. *P < 0.05 (G) Staining score of EZH2 and H3K27me3 levels in fallopian tube and OC tissues. IHC score of EZH2 and H3K27me3 was determined as the scores for the proportion of positively stained tumor cells (1, 1–25%; 2, 26–50%; 3, 51–75%; 4, > 75%) and staining intensity (0, no staining; 1, weak; 2, moderate; 3, strong) by each investigator were multiplied and then averaged. *P < 0.05, ***P < 0.0001 (H) Representative images of EZH2 and H3K27me3 staining in fallopian tube (n = 33) and OC (n = 105) tissues. Scale bar: 100 μm
Fig. 2
Fig. 2
EZH2 functions as an oncogenic driver to promote OC growth independently of its catalytic activity (A) Colony formation assay in three OC cell lines. Cells were treated with DMSO or four different EZH2 inhibitors with indicated concentrations for 12 days. Growth medium was changed and inhibitors were also replenished every 3 days. Images are representative of three independent experiments (B) Cell growth curve of 3 OC cell lines treated with DZNep (1µM), YM281 (5µM), GSK126 (5µM) or EPZ-6438 (5µM) for 96 h. Data are presented as the mean ± SD. *P < 0.05, **P < 0.01, ***P < 0.001 (C) Immunoblotting analysis of EZH2 and H3K27me3 in 3 OC cell lines treated with four different EZH2 inhibitors with indicated concentrations (D) Tumorsphere formation assay of OC cells treated with DZNep (1µM), YM281 (5µM), GSK126 (5µM) for 10–12 days. Data are presented as the mean ± SD. **P < 0.01, ***P < 0.001 (E-F) Xenograft tumor growth (E) and tumor weight (F) of OVCAR8 cells in nude mice treated with saline as control, EPZ-6438 at 200 mg/kg intragastrically daily, or DZNep at 1 mg/kg intraperitoneally twice a week. n = 7 per group. Data are presented as mean ± SEM. **P < 0.01, ***P < 0.001(Two-way ANOVA with Tukey’s post hoc test) (G) IHC analysis of EZH2, H3K27me3, and Ki67 levels in the excised tumors from (F). Data are presented as mean ± SEM. ***P < 0.001 (H) Immunoblot analysis of EZH2 and H3K27me3 levels in shEZH2-inducible OVCAR8 cell lines with wildtype or mutant EZH2 restoration. Expression of EZH2-WT and the EZH2-ΔSET was detected by an EZH2 antibody against residues surrounding Arg354 of human EZH2 protein (SET domain locates in 612–727 amino acids). GAPDH and Histone H3 were used as loading controls (I) Cell growth curve of shEZH2-inducible OVCAR8 cell lines with wildtype or mutant EZH2 restoration in the presence or absence of Dox at 1 µg/mL for 96 h. Data are presented as mean ± SD. ***P < 0.001 (J) Colony formation assay in shEZH2-inducible OVCAR8 cell lines with wildtype or mutant EZH2 restoration in the presence or absence of 10ng/mL Dox for 12 days. Growth medium was changed and doxycycline was also replenished every 3 days. Images are representative of three independent experiments (K) Tumorsphere formation assay of indicated cells treated with or without Dox at 10ng/mL for 10 days. Data are presented as the mean ± SD. **P < 0.01, ***P < 0.001 vs. EV groups
Fig. 3
Fig. 3
EZH2 noncanonically occupies promoters associated with metabolic genes (A-B) Averaged signal intensities (A) and heatmaps (B) for EZH2, H3K27me3 and SUZ12 ± 2 kb from the centres of EZH2 or H3K27me3 peaks in OVCAR8 cells (C) Venn diagram showing the significant overlap between EZH2 and H3K27me3 binding sites identified in OVCAR8 cells (D) Pie-chart plot showing the genomic distribution of peaks with EZH2-solo binding in OVCAR8 cells (E-F) Averaged signal intensities (E) and heatmaps (F) for EZH2, H3K27me3, SUZ12 and H3K4me3 ± 2 kb from the centres of EZH2-solo, EZH2-ensemble or H3K27me3-solo peaks in OVCAR8 cells (G) Scatterplot showing log2 fold change of genes expression in OVCAR8 cells after DZNep treatment or doxycycline-induced EZH2 silencing. Significant differential expression genes (DEGs) upon either treatments are indicated in blue color, upregulated DEGs in both groups are indicated in orange color, downregulated DEGs in both groups are indicated in green color. Spearman correlation between all genes is shown as a black line (R = 0.846, p < 0.0001) (H) Venn diagram showing the significant overlap between 617 EZH2 potential targets and EZH2-solo peaks associated genes in OVCAR8 cells. Averaged signal intensities for EZH2, H3K27me3, SUZ12 and H3K4me3 ± 2 kb from the TSS of overlap genes are shown (I) Gene set enrichment analysis for the 251 EZH2 solo targets using the KEGG and Reactome gene sets. Metabolism-related pathways are among the most enriched (left). The -log10(P-value) of metabolism-related pathways are shown (right) (J) Metabolism-related genes are upregulated in ovarian cancer tissues, and down regulated after EZH2 reduction. A heatmap showing the relative expression of top 10 metabolic genes in (H) by calculating their Z-score in indicated RNA-Seq data
Fig. 4
Fig. 4
EZH2 transcriptionally upregulates IDH2 to promote metabolic rewiring (A) Diagram of TCA cycle. TCA cycle related genes in Fig. 3I are indicated in orange color (B) qRT-PCR analysis of TCA cycle related genes in OVCAR8 and OVCAR4 cells upon 5µM DZNep or GSK126 treatment for 72 h. Data are presented as mean ± SD. *P < 0.05, **P < 0.01, ***P < 0.001 (C-D) qRT-PCR analysis of EZH2 and IDH2 levels upon Dox-induced EZH2 silencing in indicated cells. IDH2 level was concomitantly reduced upon Dox-induced EZH2 silencing (C), and ectopic expression of EZH2 or EZH2-ΔSET restored the level of IDH2 (D). Data are presented as mean ± SD. *P < 0.05, **P < 0.001, ***P < 0.001 (E-F) Dual-luciferase reporter assay of IDH2 promoter activity in OC cell lines upon pharmacological or genetic inhibition of EZH2. The OVCAR8 and OVCAR4 cells were treated with 5µM DZNep or GSK126 for 48 h before luciferase reporter assay (E). The indicated cells were treated with 1 µg/mL Dox for 48 h before luciferase reporter assay (F). Data are presented as mean ± SD. **P < 0.01, ***P < 0.001 (G) ChIP assay in OVCAR8 cells. A specific antibody against EZH2 but not isotype IgG, SUZ12, or H3K27me3 could capture the fragment containing EZH2 binding site in the IDH2 promoter region, which was amplified by specific primers (top) by qRT-PCR (bottom) (H) ChIP-seq profiling showed the ChIP-seq signal for EZH2, H3K4me3, H3K27me3 and SUZ12 at the genomic loci of IDH2 in OVCAR8 cells. ChIP-seq profiling also showed the ChIP-seq signal for EZH2 and H3K27me3 in two MLL1-rearranged leukaemia cell lines in GSE180448. (I-J) OCR assays upon pharmacological (I) or genetic (J) inhibition of EZH2. Representative OCR pattern as a function of time (in min), normalized to total protein levels. Cells were pretreated with 5 µM DZNep, GSK126 or 1 µg/mL doxycycline for 72 h before OCR measurement. Data are shown as mean ± SD of three replicates per treatment
Fig. 5
Fig. 5
Reduction of EZH2 impairs IDH2 dependent metabolic rewiring to suppress OC growth (A) Representative images of EZH2 and IDH2 staining in OC tissues (n = 105). Scale bar: 100 μm (B) IDH2 level was strongly positively correlated with EZH2 level in the OC cohort (n = 105). P value was determined by Pearson’s correlation test (C) Kaplan-Meier survival analysis for the OC cohort (n = 105), which was divided into IDH2high and IDH2low subgroups based on the cutoff (cutoff = 5) calculated by the X-Tile software. The P value was calculated by log-rank test. **P < 0.01 (D) Colony formation assay in OVCAR8 and OVCAR4 cells transfected with IDH2 or EZH2 siRNA. Cells were cultured for 12 days. Growth medium was changed every 3 days. Images are representative of three independent experiments (E) Cell growth curve of OVCAR8 and OVCAR4 cells transfected with IDH2 or EZH2 siRNA for 96 h. Data are presented as mean ± SD. *P < 0.05, **P < 0.01 (F-G) α-KG assay in OVCAR8 cells upon DNZep, GSK126 treatment (F) or in OVCAR8-shEZH2#2 cells ectopic expressing wildtype or mutant EZH2 (G). The OVCAR8 cells were treated with 2µM DZNep, 5µM GSK126 or 1 µg/mL doxycycline for 72 h before α-KG assay. Data are presented as the mean ± SD. **P < 0.01, ***P < 0.001 (H) Colony formation assay in OVCAR8 and OVCAR5 cells upon Dox-induced EZH2 silencing with or without α-KG supplementation. Cells were treated with 5ng/mL doxycycline for 12 days. Medium with or without 1mM α-KG was changed and doxycycline was also replenished every 2 days. Images are representative of three independent experiments (I) Colony formation assay in OVCAR8-shEZH2#2 cells with ectopic IDH2 expression. Cells were treated with 5ng/mL doxycycline for 12 days. Growth medium was changed and doxycycline was also replenished every 3 days. Images are representative of three independent experiments. Immunoblot analysis of EZH2 and IDH2 levels in indicated samples. Cells were treated with or without Dox for 72 h before being harvested. GAPDH was used as loading controls (J) Cell growth curve of OVCAR8-shEZH2#2 cells with ectopic IDH2 expression upon 1 µg/mL doxycycline treatment for 96 h. Data are presented as the mean ± SD. *P < 0.05 (K) Representative OCR pattern as a function of time (in min), normalized to total protein levels. Cells were incubated in the absence or presence of 1 µg/mL doxycycline for 72 h before OCR measurement. Data are shown as mean ± SD of three replicates per treatment
Fig. 6
Fig. 6
Targeting EZH2 mediated metabolic rewiring exhibits potential therapeutic efficacy in preclinical models of OC (A) Colony formation assay in two primary OC cell lines derived from two OC patients (POVC17, POVC15). Cells were treated with DMSO, DZNep (1µM), YM281 (5µM), GSK126 (5µM) or EPZ-6438 (5µM) for 12 days. Growth medium was changed and inhibitors were also replenished every 3 days. Images are representative of three independent experiments unless stated otherwise (B) Cell growth curve of two OC patient-derived primary tumor cell lines treated with DMSO, DZNep (1µM), YM281 (5µM) or GSK126 (5µM) for 96 h. Data are presented as the mean ± SD. ***P < 0.001 (C) Immunoblotting analysis of EZH2 and H3K27me3 levels in two OC patient-derived primary tumor cell lines upon EZH2 inhibitors treatment. Cells were treated with DMSO, DZNep (1µM), YM281 (5µM), GSK126 (5µM) or EPZ-6438 (5µM) for 72 h (D) Tumor growth of PDX models in NOD-SCID mice treated with saline as control, EPZ-6438 at 200 mg/kg intragastrically daily, or DZNep at 1 mg/kg intraperitoneally twice a week (n = 6 per group). Data are presented as mean ± SD. ***P < 0.001(Two-way ANOVA with Tukey’s post hoc test) (E) Bar graph showing the tumor weight on the 26th day post-treatment week (n = 6 per group). Data are presented as mean ± SD. **P < 0.01 (F) Body weight of each mouse post-treatment. Data are presented as mean ± SD. (G) IHC analysis of EZH2, H3K27me3, IDH2 and Ki67 levels in the excised tumors from PDX models. Data are presented as mean ± SD. **P < 0.01, ***P < 0.001 (H) α-KG assay in PDX tumors upon EPZ6438 or DZNep treatment. Data are presented as mean ± SD. ***P < 0.001
Fig. 7
Fig. 7
Schematic model illustrating the mechanism of EZH2 potentiating metabolic rewiring in OC Overexpressed EZH2 transcriptionally regulates TCA related genes such as IDH2, to enhance the TCA cycle, which promotes metabolic rewiring in OC cells. Small molecules trigger EZH2 degradation, rather than catalytic inhibition, to suppress the transcription of TCA-related genes and significantly block OC growth in vitro and in vivo

References

    1. Siegel RL, Miller KD, Fuchs HE, Jemal A. Cancer Statistics, 2021. CA Cancer J Clin. 2021;71:7–33. doi: 10.3322/caac.21654. - DOI - PubMed
    1. Torre LA, Trabert B, DeSantis CE, Miller KD, Samimi G, Runowicz CD, Gaudet MM, Jemal A, Siegel RL. Ovarian cancer statistics, 2018. CA Cancer J Clin. 2018;68:284–96. doi: 10.3322/caac.21456. - DOI - PMC - PubMed
    1. Lheureux S, Gourley C, Vergote I, Oza AM. Epithelial ovarian cancer. The Lancet. 2019;393:1240–53. doi: 10.1016/S0140-6736(18)32552-2. - DOI - PubMed
    1. Cortez AJ, Tudrej P, Kujawa KA, Lisowska KM. Advances in ovarian cancer therapy. Cancer Chemother Pharmacol. 2018;81:17–38. doi: 10.1007/s00280-017-3501-8. - DOI - PMC - PubMed
    1. Ciriello G, Miller ML, Aksoy BA, Senbabaoglu Y, Schultz N, Sander C. Emerging landscape of oncogenic signatures across human cancers. Nat Genet. 2013;45:1127–33. doi: 10.1038/ng.2762. - DOI - PMC - PubMed

Publication types