. 2023 Jul 10;381(2250):20220245.
doi: 10.1098/rsta.2022.0245. Epub 2023 May 22.

Analysing ill-conditioned Markov chains

Affiliations

Analysing ill-conditioned Markov chains

Esmae J Woods et al. Philos Trans A Math Phys Eng Sci. .

Abstract

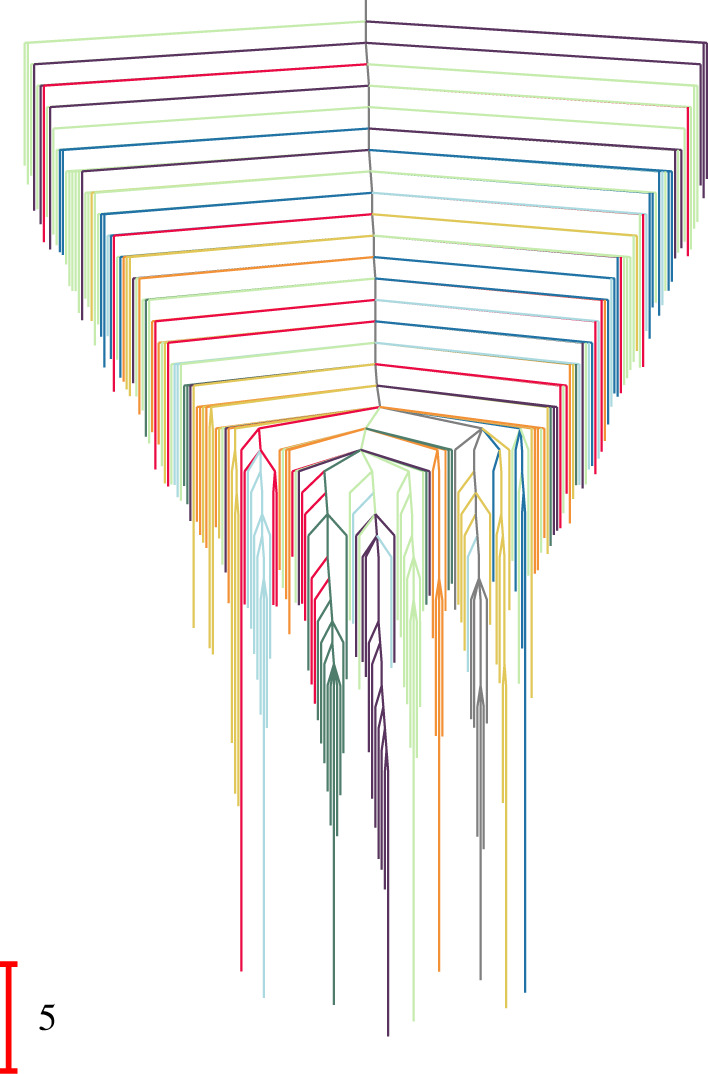
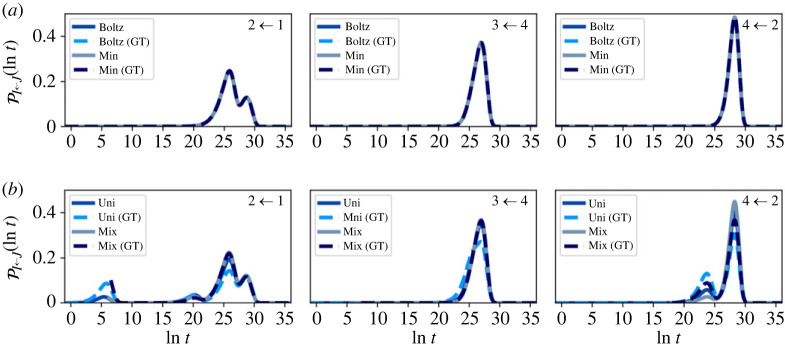
Discrete state Markov chains in discrete or continuous time are widely used to model phenomena in the social, physical and life sciences. In many cases, the model can feature a large state space, with extreme differences between the fastest and slowest transition timescales. Analysis of such ill-conditioned models is often intractable with finite precision linear algebra techniques. In this contribution, we propose a solution to this problem, namely partial graph transformation, to iteratively eliminate and renormalize states, producing a low-rank Markov chain from an ill-conditioned initial model. We show that the error induced by this procedure can be minimized by retaining both the renormalized nodes that represent metastable superbasins, and those through which reactive pathways concentrate, i.e. the dividing surface in the discrete state space. This procedure typically returns a much lower rank model, where trajectories can be efficiently generated with kinetic path sampling. We apply this approach to an ill-conditioned Markov chain for a model multi-community system, measuring the accuracy by direct comparison with trajectories and transition statistics. This article is part of a discussion meeting issue 'Supercomputing simulations of advanced materials'.

Keywords: Markov chains; dimensionality reduction; energy landscapes; graph transformation; rare events.


Conflict of interest statement

We declare we have no competing interests.

Figures

Figure 1.
Figure 1.
Dimensionality reduction pipeline for a model network (visualized using Gephi [67]) consisting of 994 nodes and 4320 bidirectional edges, parameterized by Arrhenius transition rates. (a) The network is embedded in a two-dimensional nine-well potential, which is clear in the disconnectivity graph shown in figure 2a. Larger darker blue nodes are associated with lower energies (higher equilibrium probabilities) and smaller darker red nodes are associated with higher energies (lower stationary probabilities). (b) First, the network is partitioned into nine metastable communities (communities of nodes), corresponding to the nine potential energy basins, using the Bayesian agglomerative clustering engine (BACE). (c) Partial GT is used to iteratively eliminate all but the lowest-energy node internal to each community, and the boundary nodes that connect communities, resulting in a reduced network with 215 nodes and 2217 edges. This reduction ensures all dominant basin escape paths from each community are preserved in a renormalized form. (Online version in colour.)
Figure 2.
Figure 2.
Disconnectivity graphs [72,73] for the nine-community model network shown in figure 1a. (a) The landscape for the complete network with 994 local minima. (b) The landscape including only minima that correspond to monotonic sequence basins, defined by minima that are not directly connected to any lower energy neighbour [–78]. The colour scheme highlights the different communities, as labelled in figure 1. (Online version in colour.)
Figure 3.
Figure 3.
Disconnectivity graph [72,73] for the network in figure 1c, where 215 states are retained using the partial GT approach. This graph is based on effective free energies at T=1, as described in the text. (Online version in colour.)
Figure 4.
Figure 4.
First escape time distributions for the nine-community model, before partial GT at T=1. The system is initialized in four different starting configurations, Boltz, Min, Uni and Mix, within each community, as labelled in the top right corner of each plot. An additional small peak is seen at small time for Uni, due to significant starting probability in boundary nodes causing rapid escape. At this low temperature, most of the probability in the initial Boltzmann distribution is localized in or near the global minimum of the community, which results in almost identical escape distributions for Boltz and Min. For longer times, Mix tends towards the Boltzmann distribution. (Online version in colour.)
Figure 5.
Figure 5.
First escape time distributions for the nine-community model, before partial GT at T=10. The system is initialized in four different starting configurations, Boltz, Min, Uni and Mix, within each community, as labelled in the top right corner of each plot. Both the Boltz and Uni escape distributions have larger escape probabilities at small time compared with Min, due to significant starting probabilities in boundary nodes. Mix shows a peak centred on the Min peak, but of different height, as both curves are normalized to have unit area. (Online version in colour.)
Figure 6.
Figure 6.
Representative first passage time (FPT) distributions for the full nine-community model before partial-GT at (a) T=1 and (b) T=10. The system is initialized in four different starting configurations, within each community: Boltz, Min, Uni and Mix. The FPT results are rather similar for the different initial conditions. Starting in a uniform distribution can produce additional peaks in the FPT distribution, but these peaks become less prominent for Mix. (Online version in colour.)
Figure 7.
Figure 7.
First escape time distributions for transitions between different communities in the nine-community model at T=1 for both the full and graph transformed (GT) networks, calculated using eigendecomposition. The system is initialized in different local distributions, (a) Boltz and Min, (b) Uni and Mix, within the starting communities, which are labelled in the top right corner of each panel. (Online version in colour.)
Figure 8.
Figure 8.
First escape time distributions for transitions between different communities in the nine-community model at T=10 for both the full and graph transformed (GT) networks, calculated using eigendecomposition. The system is initialized in different local distributions, (a) Boltz and Min, (b) Uni and Mix, within the starting communities, which are labelled in the top right corner of each panel. (Online version in colour.)
Figure 9.
Figure 9.
First passage time (FPT) distributions for transitions between different communities in the nine-community model at T=1 for both the full and graph transformed (GT) networks, calculated using eigendecomposition. The system is initialized in different local distributions within the starting communities: (a) Boltz and Min, (b) Uni and Mix. (Online version in colour.)
Figure 10.
Figure 10.
First passage time distributions for transitions between different communities in the nine-community model at T=10 for both the full and graph transformed (GT) networks, calculated using eigendecomposition. The system is initialized in different local distributions within the starting communities: (a) Boltz and Min, (b) Uni and Mix. (Online version in colour.)
Figure 11.
Figure 11.
Community occupation probability, defined as the fraction of simulated trajectories assigned to a given community, as a function of simulation time. A set of 1000 trajectories initialized according to the local equilibrium distribution in community 4 of the nine-community model network (as shown in figure 1b) were simulated using kPS at a temperature T=1. The time-dependent occupation probabilities derived from trajectories on the original network closely match those derived from simulated trajectories on the GT-reduced 215-node network (figure 1c), which only retains the boundary nodes and the internal node with the largest stationary probability in each community. Since community 4 is metastable, the evolution of its occupation probability closely matches a simple exponential decay. Over time, the probability flow leaks into neighbouring communities, as shown by the gradual increase in the occupation probabilities of the neighbouring communities 3 and 1. The dynamics are accurately represented even at longer time scales, i.e. at 10 times the mean escape time from community 4. (Online version in colour.)
Figure 12.
Figure 12.
First passage time (FPT) distributions for transitions between different communities in the nine-community model at T=1. Distributions were computed using linear algebra eigendecomposition methods (LA) and kinetic path sampling (kPS) on the partial-GT reduced network. Excellent agreement is obtained between the two methods, for the different initial starting distributions of (a) stationary, (b) uniform across all states. (Online version in colour.)
Figure 13.
Figure 13.
Low temperature first passage time (FPT) distributions for transitions between different communities in the nine-community model at T=0.5, computed using kinetic path sampling (kPS) on the reduced network. At this temperature, eigendecomposition is unable to produce the FPTs due to the increase of metastability causing loss of precision. However, kinetic path sampling remains functional, and due to the lower dimension of the reduced partial-GT network, is computationally feasible. The system is initialized according to the local equilibrium distribution within the starting community. At this low temperature, the efficiency of kPS varies between pairings, with some of the more difficult pairings being the passage times to community 2. (Online version in colour.)

References

    1. Kenett DY, Havlin S. 2015. Network science: a useful tool in economics and finance. Mind Soc. 14, 155-167. (10.1007/s11299-015-0167-y) - DOI
    1. Simon PL, Taylor M, Kiss IZ. 2011. Exact epidemic models on graphs using graph-automorphism driven lumping. J. Math. Biol. 62, 479-508. (10.1007/s00285-010-0344-x) - DOI - PMC - PubMed
    1. Pastor-Satorras R, Castellano C, Van Mieghem P, Vespignani A. 2015. Epidemic processes in complex networks. Rev. Mod. Phys. 87, 925. (10.1103/RevModPhys.87.925) - DOI
    1. Goltsev AV, Dorogovtsev SN, Oliveira JG, Mendes JFF. 2012. Localization and spreading of diseases in complex networks. Phys. Rev. Lett. 109, 128702. (10.1103/PhysRevLett.109.128702) - DOI - PubMed
    1. Anderson DF, Kurtz TG. 2011. Continuous time Markov chain models for chemical reaction networks. In Design and analysis of biomolecular circuits, pp. 3–42. New York, NY: Springer.

LinkOut - more resources