

Large-Scale Plasma Proteome Epitome Profiling is an Efficient Tool for the Discovery of Cancer Biomarkers
- PMID: 37211046
- PMCID: PMC10319867
- DOI: 10.1016/j.mcpro.2023.100580
Large-Scale Plasma Proteome Epitome Profiling is an Efficient Tool for the Discovery of Cancer Biomarkers
Abstract
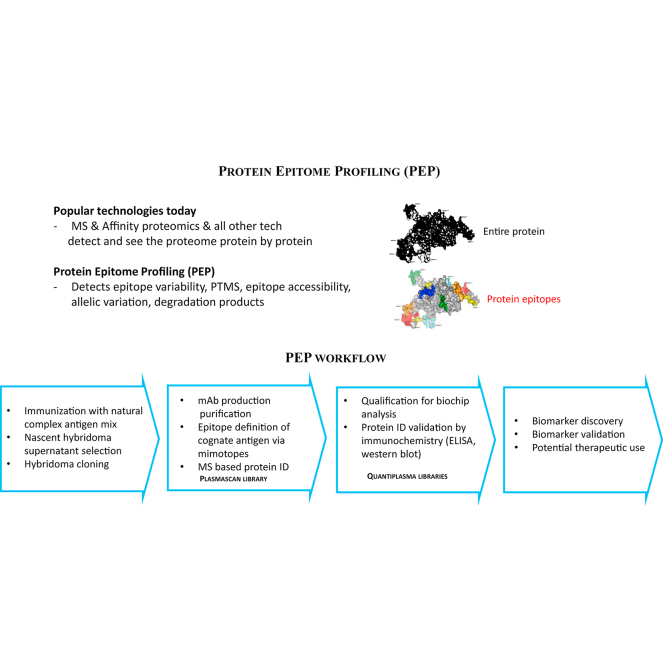
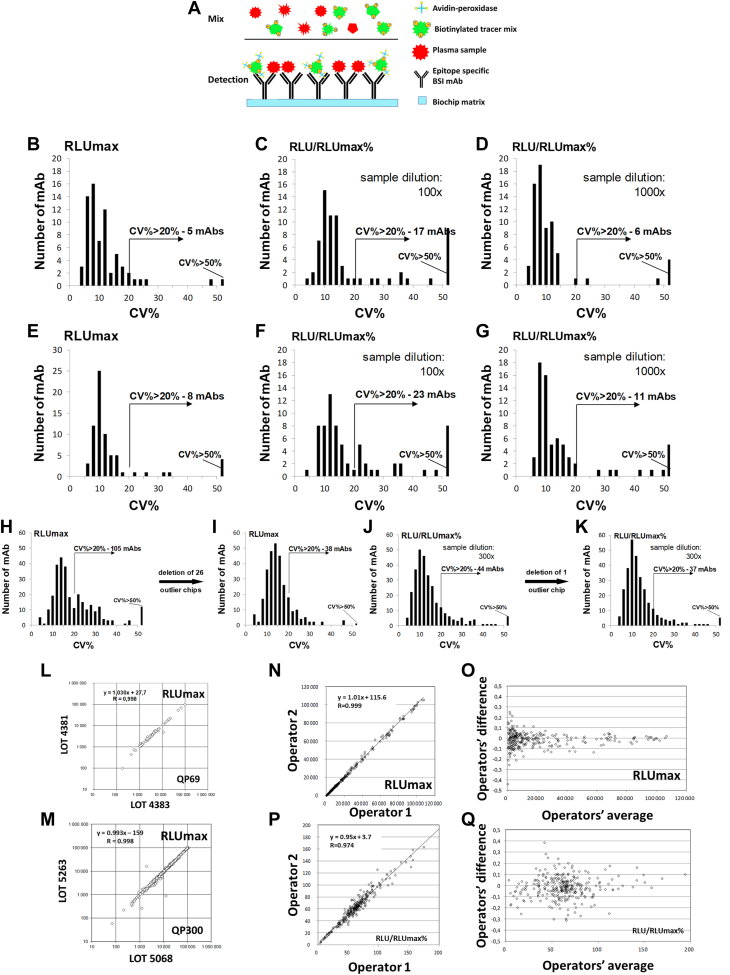
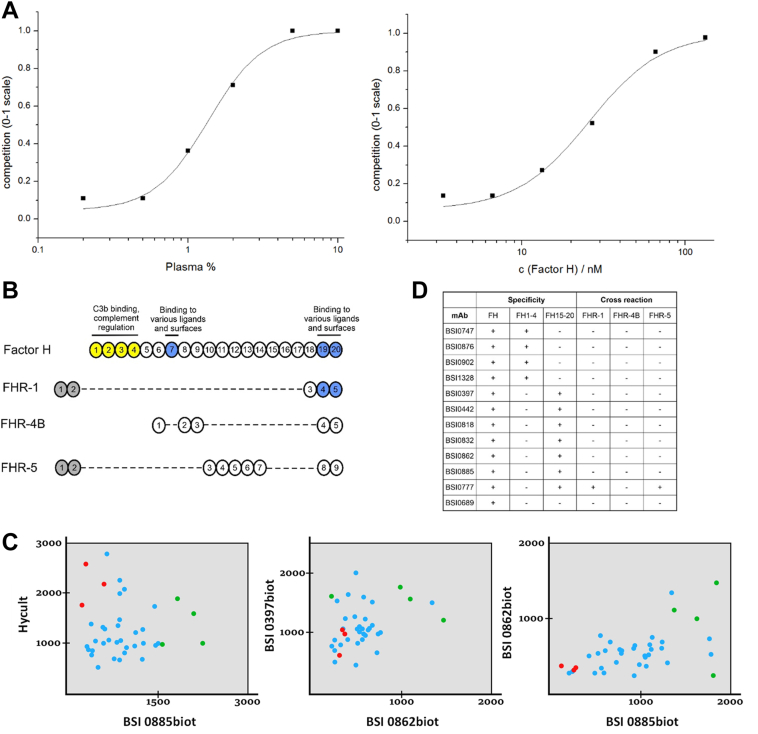
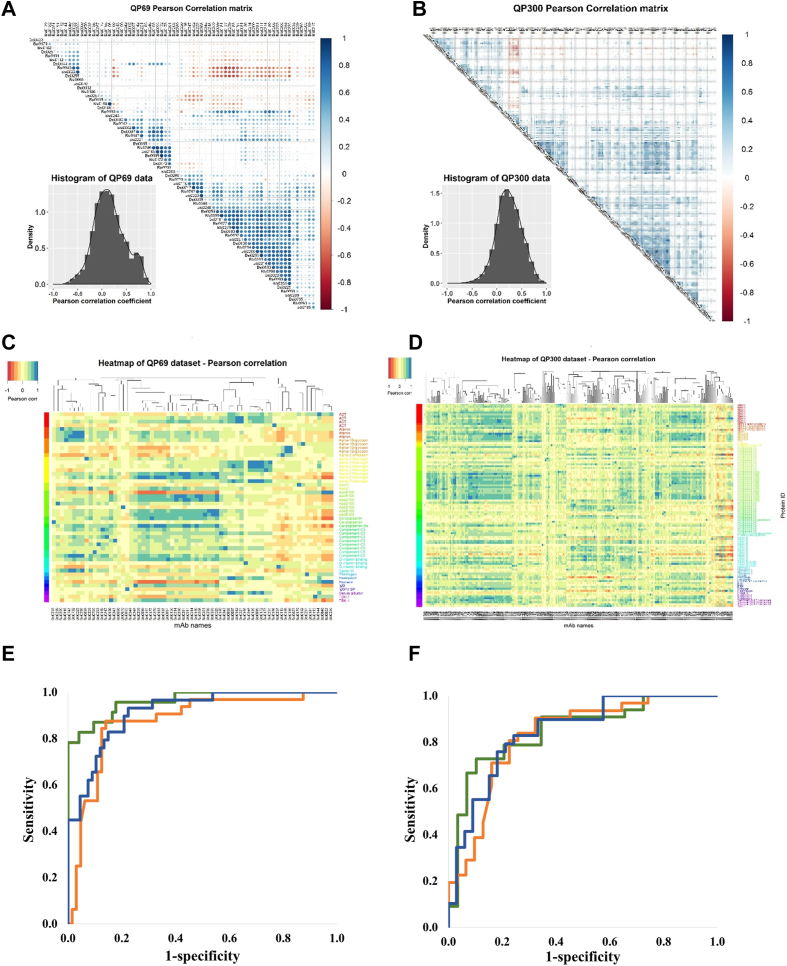
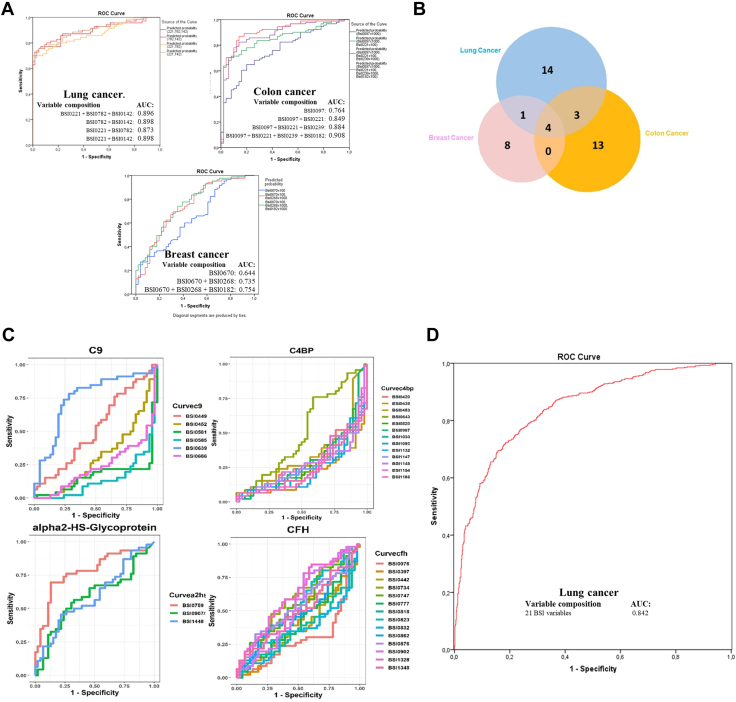
Current proteomic technologies focus on the quantification of protein levels, while little effort is dedicated to the development of system approaches to simultaneously monitor proteome variability and abundance. Protein variants may display different immunogenic epitopes detectable by monoclonal antibodies. Epitope variability results from alternative splicing, posttranslational modifications, processing, degradation, and complex formation and possesses dynamically changing availability of interacting surface structures that frequently serve as reachable epitopes and often carry different functions. Thus, it is highly likely that the presence of some of the accessible epitopes correlates with function under physiological and pathological conditions. To enable the exploration of the impact of protein variation on the immunogenic epitome first, here, we present a robust and analytically validated PEP technology for characterizing immunogenic epitopes of the plasma. To this end, we prepared mAb libraries directed against the normalized human plasma proteome as a complex natural immunogen. Antibody producing hybridomas were selected and cloned. Monoclonal antibodies react with single epitopes, thus profiling with the libraries is expected to profile many epitopes which we define by the mimotopes, as we present here. Screening blood plasma samples from control subjects (n = 558) and cancer patients (n = 598) for merely 69 native epitopes displayed by 20 abundant plasma proteins resulted in distinct cancer-specific epitope panels that showed high accuracy (AUC 0.826-0.966) and specificity for lung, breast, and colon cancer. Deeper profiling (≈290 epitopes of approximately 100 proteins) showed unexpected granularity of the epitope-level expression data and detected neutral and lung cancer-associated epitopes of individual proteins. Biomarker epitope panels selected from a pool of 21 epitopes of 12 proteins were validated in independent clinical cohorts. The results demonstrate the value of PEP as a rich and thus far unexplored source of protein biomarkers with diagnostic potential.
Keywords: biomarker; cancer; epitope; lung cancer; plasma epitom profiling; protein variants; proteoform.
Copyright © 2023 The Authors. Published by Elsevier Inc. All rights reserved.
Conflict of interest statement
Conflict of interest The authors declare no conflict of interest.
Figures
Similar articles
-
Epitomics: Analysis of Plasma C9 Epitope Heterogeneity in the Plasma of Lung Cancer Patients and Control Subjects.Int J Mol Sci. 2023 Sep 21;24(18):14359. doi: 10.3390/ijms241814359. Int J Mol Sci. 2023. PMID: 37762663 Free PMC article.
-
Fractionation of the human plasma proteome for monoclonal antibody proteomics-based biomarker discovery 2: antigen identification by dot-blot array screening.Electrophoresis. 2013 Nov;34(20-21):3064-71. doi: 10.1002/elps.201200677. Electrophoresis. 2013. PMID: 24027087
-
Discovery of lung cancer biomarkers by profiling the plasma proteome with monoclonal antibody libraries.Mol Cell Proteomics. 2011 Dec;10(12):M111.010298. doi: 10.1074/mcp.M111.010298. Epub 2011 Sep 26. Mol Cell Proteomics. 2011. PMID: 21947365 Free PMC article.
-
Emerging Affinity-Based Proteomic Technologies for Large-Scale Plasma Profiling in Cardiovascular Disease.Circulation. 2017 Apr 25;135(17):1651-1664. doi: 10.1161/CIRCULATIONAHA.116.025446. Circulation. 2017. PMID: 28438806 Free PMC article. Review.
-
Proteomic profiling of human plasma for cancer biomarker discovery.Proteomics. 2017 Mar;17(6). doi: 10.1002/pmic.201600240. Epub 2016 Oct 17. Proteomics. 2017. PMID: 27550791 Review.
Cited by
-
Comprehensive Serum Glycopeptide Spectra Analysis Combined with Machine Learning for Early Detection of Lung Cancer: A Case-Control Study.Cancers (Basel). 2025 Apr 27;17(9):1474. doi: 10.3390/cancers17091474. Cancers (Basel). 2025. PMID: 40361401 Free PMC article.
-
From Reductionistic Approach to Systems Immunology Approach for the Understanding of Tumor Microenvironment.Int J Mol Sci. 2023 Jul 28;24(15):12086. doi: 10.3390/ijms241512086. Int J Mol Sci. 2023. PMID: 37569461 Free PMC article. Review.
-
Proteomics and Its Applications in Cancers 2.0.Int J Mol Sci. 2024 Apr 18;25(8):4447. doi: 10.3390/ijms25084447. Int J Mol Sci. 2024. PMID: 38674032 Free PMC article.
-
Epitomics: Analysis of Plasma C9 Epitope Heterogeneity in the Plasma of Lung Cancer Patients and Control Subjects.Int J Mol Sci. 2023 Sep 21;24(18):14359. doi: 10.3390/ijms241814359. Int J Mol Sci. 2023. PMID: 37762663 Free PMC article.
-
Energy metabolism as the hub of advanced non-small cell lung cancer management: a comprehensive view in the framework of predictive, preventive, and personalized medicine.EPMA J. 2024 Apr 8;15(2):289-319. doi: 10.1007/s13167-024-00357-5. eCollection 2024 Jun. EPMA J. 2024. PMID: 38841622 Free PMC article. Review.
References
-
- Rey J.-M., Ducros V., Pujol P., Wang Q., Buisine M.-P., Aissaoui H., et al. Improving mutation screening in patients with colorectal cancer predisposition using next-generation sequencing. J. Mol. Diagn. 2017;19:589–601. - PubMed
-
- Yang X., Chu Y., Zhang R., Han Y., Zhang L., Fu Y., et al. Technical validation of a next-generation sequencing assay for detecting clinically relevant levels of breast cancer–related single-Nucleotide variants and copy number variants using simulated cell-free DNA. J. Mol. Diagn. 2017;19:525–536. - PubMed
-
- Ignatiadis M., Sledge G.W., Jeffrey S.S. Liquid biopsy enters the clinic - implementation issues and future challenges. Nat. Rev. Clin. Oncol. 2021;18:297–312. - PubMed
Publication types
MeSH terms
Substances
LinkOut - more resources
Full Text Sources
Medical
Molecular Biology Databases
Miscellaneous
