. 2023 Jul;10(21):e2301428.
doi: 10.1002/advs.202301428. Epub 2023 May 21.

Single-Cell RNA Sequencing and Spatial Transcriptomics Reveal Pathogenesis of Meningeal Lymphatic Dysfunction after Experimental Subarachnoid Hemorrhage

Affiliations

Single-Cell RNA Sequencing and Spatial Transcriptomics Reveal Pathogenesis of Meningeal Lymphatic Dysfunction after Experimental Subarachnoid Hemorrhage

Xiaoyu Wang et al. Adv Sci (Weinh). 2023 Jul.

Abstract

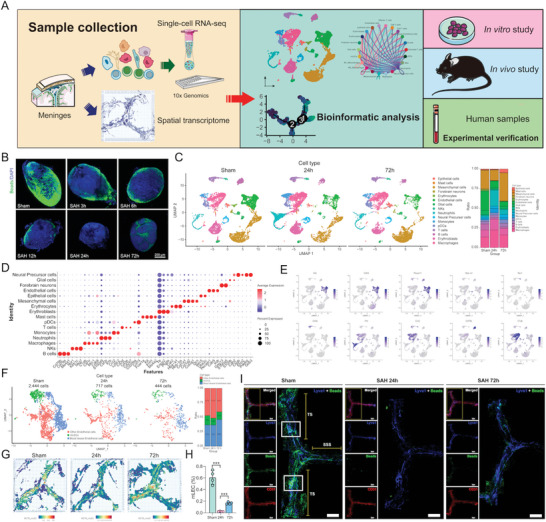
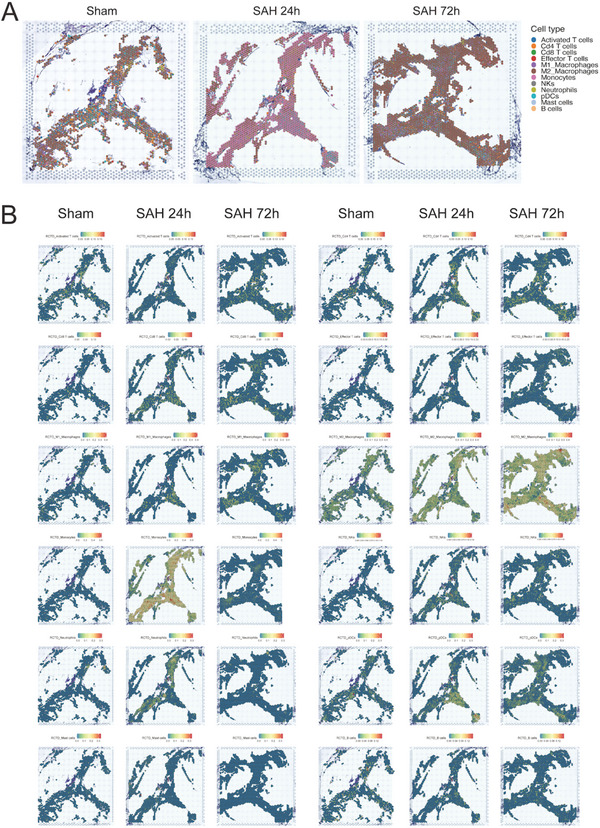
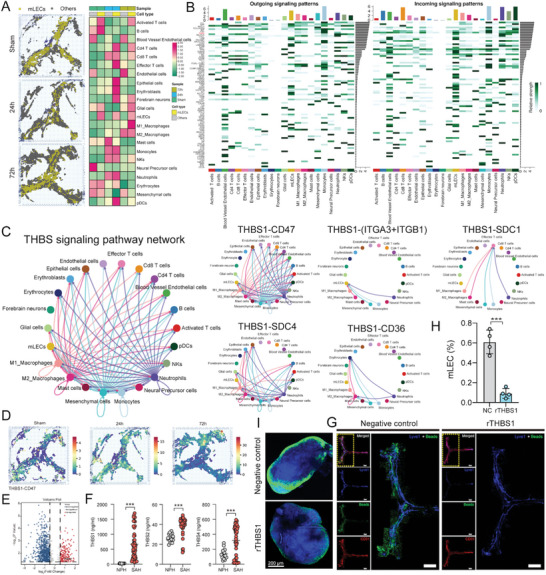
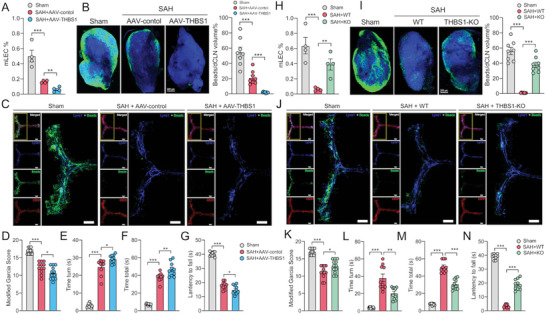
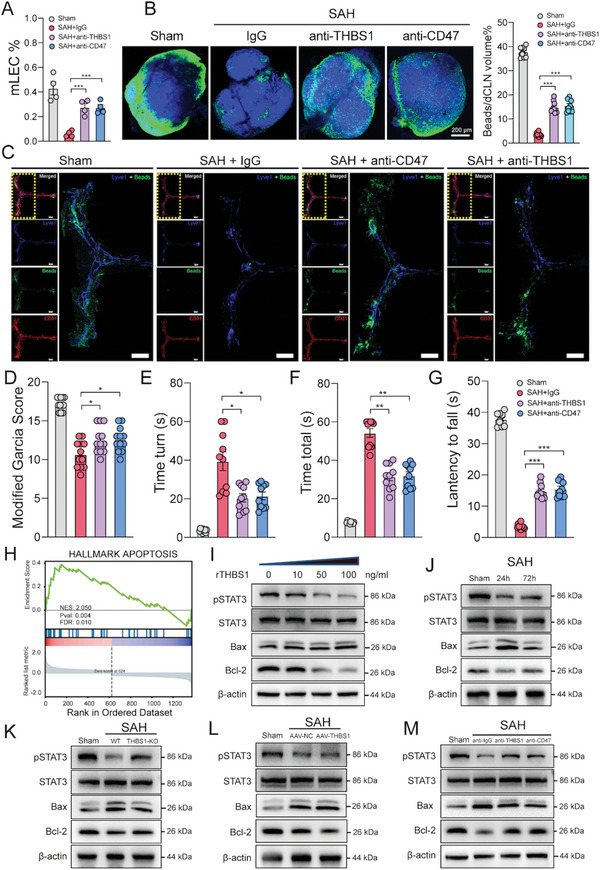
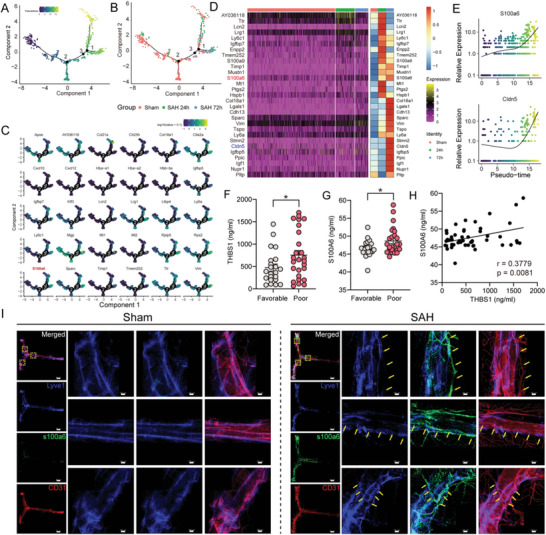
Subarachnoid hemorrhage (SAH) is a devastating subtype of stroke with high mortality and disability rate. Meningeal lymphatic vessels (mLVs) are a newly discovered intracranial fluid transport system and are proven to drain extravasated erythrocytes from cerebrospinal fluid into deep cervical lymph nodes after SAH. However, many studies have reported that the structure and function of mLVs are injured in several central nervous system diseases. Whether SAH can cause mLVs injury and the underlying mechanism remain unclear. Herein, single-cell RNA sequencing and spatial transcriptomics are applied, along with in vivo/vitro experiments, to investigate the alteration of the cellular, molecular, and spatial pattern of mLVs after SAH. First, it is demonstrated that SAH induces mLVs impairment. Then, through bioinformatic analysis of sequencing data, it is discovered that thrombospondin 1 (THBS1) and S100A6 are strongly associated with SAH outcome. Furthermore, the THBS1-CD47 ligand-receptor pair is found to function as a key role in meningeal lymphatic endothelial cell apoptosis via regulating STAT3/Bcl-2 signaling. The results illustrate a landscape of injured mLVs after SAH for the first time and provide a potential therapeutic strategy for SAH based on mLVs protection by disrupting THBS1 and CD47 interaction.

Keywords: meningeal lymphatic; meningeal lymphatic endothelial cells; single-cell RNA sequencing; spatial transcriptome; subarachnoid hemorrhage.


Conflict of interest statement

The authors declare no conflict of interest.

Figures

Figure 1
Figure 1
Single‐cell transcriptomic atlas of mLVs alterations at different time courses after SAH. A) Graphic overview of our study design. Mice dura matters were dissociated into single‐cell suspension and used for scRNA‐seq with 10× Genomics. Dura slides were processed to obtain spatial transcriptomics by 10× Genomics Visium. Integrated analysis of single‐cell transcriptome data and the following in vivo/vitro experiments were performed. B) Representative images of fluorescent beads accumulation in dCLNs at 3, 6, 12, 24, and 72 h post‐SAH. Scale bar: 200 µm. C) UMAP plots of 16 cell clusters with different colors (left) and bar charts of cluster proportion (right) in each group. D) Dot plots showing the average expression of known markers in 16 cell types. The dot size represents the percentage of cells expressing the indicated genes in each cell type. E) Expression levels of selected known marker genes across 25 536 unsorted cells illustrated in UMAP plots from both Sham and SAH dura in mice. F) High‐resolution UMAP plots of three re‐defined endothelial cell sub‐clusters in each group. G) Predicted spatial distribution of mLECs by RCTD. H) Flow cytometric analysis of mLECs percentage at different time courses after SAH, n = 4 per group, *** p < 0.001 versus Sham and 24 h by paired two‐tailed Student's t‐test. I) Representative confocal images of mLVs region at different time courses after SAH. An enlarged view of TS and SSS is shown on the right in each group. Solid boxes show the hotspots along the TS. Lyve1 (blue), Beads (green), and CD31 (red). Scale bar: 1000 µm.
Figure 2
Figure 2
Deconvolution of spatial atlas of mLVs after SAH. A) Spatial scatter pie plots representing the proportion of different cell types from reference atlas within capture locations in mice dura at different time courses after SAH. B) Predicted spatial localization of immune cell types around mLVs by RCTD.
Figure 3
Figure 3
Intercellular communication networks in and around mLVs. A) Spatial visualization of immune cell infiltration based on mLECs distribution. B) Outgoing and incoming signal patterns among all meningeal cells. C) THBS signaling pathway network among all cell types. D) Spatial visualization of THBS1‐CD47 L‐R pair distribution by stLearn. E) Volcano plots showing that THBS1 is one of the upregulated DEGs in the SAH group compared to the NPH group identified by mass spectrometry. F) Quantification of THBS1, THBS2, and THBS4 expression in CSF samples from SAH patients compared to those from NPH patients by ELISA assay, *** p < 0.001 versus NPH by paired two‐tailed Student's t‐test. G) Representative confocal images of mLVs region of the negative control (NC) group and recombinant THBS1 protein treatment (rTHBS1) group. An enlarged view of TS and SSS is shown on the right in each group. Lyve1 (blue), Beads (green), and CD31 (red). Scale bar: 1000 µm. H) Flow cytometric analysis of mLECs percentage in NC group and rTHBS1 group, n = 4 per group, *** p < 0.001 versus NC by paired two‐tailed Student's t‐test. I) Representative images of beads accumulation in dCLNs of the NC group and rTHBS1 group. Scale bar: 200 µm.
Figure 4
Figure 4
Validation of THBS1 impacting mLVs function after SAH. SAH modeling and behavioral tests were performed 4 weeks after the AAV injection. A) Flow cytometric analysis of mLECs percentage in Sham, AAV‐control, and AAV‐THBS1 group at 72 h post‐SAH, n = 4 per group, **p < 0.01, ***p < 0.001 by paired two‐tailed Student's t‐test. B) Representative images and quantification of beads accumulation in dCLNs of Sham, AAV‐control, and AAV‐THBS1 group at 72 h post‐SAH, each data point represents an average of the 2 dCLNs from one individual mouse, n = 8 per group, **p < 0.01, ***p < 0.001 by paired two‐tailed Student's t‐test. Scale bar: 200 µm. C) Representative confocal images of mLVs region of Sham, AAV‐control, and AAV‐THBS1 group at 72 h post‐SAH. An enlarged view of TS and SSS is shown on the right in each group. Lyve1 (blue), Beads (green), and CD31 (red). Scale bar: 1000 µm. D) Modified Garcia test, E) time turn, F) time total, and G) wire hanging test at 72 h after SAH revealed AAV‐THBS1 delivery aggravated short‐term neurological function compared with Sham or AAV‐control group, n = 10–12 per group. *p < 0.05; **p < 0.01, ***p < 0.001 by paired two‐tailed Student's t‐test. H) Flow cytometric analysis of mLECs percentage in Sham, SAH‐WT, and THBS1‐KO group at 24 h post‐SAH, n = 4 per group, **p < 0.01, ***p < 0.001 by paired two‐tailed Student's t‐test. I) Representative images and quantification of beads accumulation in dCLNs in sham, SAH‐WT, and THBS‐KO group at 24 h post‐SAH, each data point represents an average of the 2 dCLNs from one individual mouse. n = 8 per group, **p < 0.01 by paired two‐tailed Student's t‐test. Scale bar: 200 µm. J) Representative confocal images of mLVs region of Sham, SAH‐WT, and THBS1‐KO group at 24 h post‐SAH. An enlarged view of TS and SSS is shown on the right in each group. Lyve1 (blue), Beads (green), and CD31 (red). Scale bar: 1000 µm. K) Modified Garcia test, L) time turn, M) time total, and N) wire hanging test at 24 h after SAH revealed THBS1 knockout improved short‐term neurological function compared with Sham or WT‐SAH group. n = 10–12 per group. *p < 0.05; **p < 0.01, ***p < 0.001 by paired two‐tailed Student's t‐test.
Figure 5
Figure 5
Disturbing THBS1‐CD47 interaction promoted mLVs restoration via inhibiting STAT3/BCL2‐mediated apoptosis in mLECs. A) Flow cytometric analysis of mLECs percentage in sham, SAH + igG, SAH + anti‐CD47, and SAH + anti‐THBS1 group at 24 h post‐SAH, n = 4 per group, ***p < 0.001 by paired two‐tailed Student's t‐test. B) Representative images and quantification of beads accumulation in dCLNs of Sham, SAH + igG, SAH + anti‐CD47, and SAH + anti‐THBS1 group at 24 h post‐SAH, each data point represents an average of the 2 dCLNs from one individual mouse, n = 8 per group, ***p < 0.001 by paired two‐tailed Student's t‐test. Scale bar: 200 µm. C) Representative confocal images of mLVs region of Sham, SAH + igG, SAH + anti‐CD47, and SAH + anti‐THBS1 group at 24 h post‐SAH. An enlarged view of TS and SSS is shown on the right in each group. Lyve1 (blue), Beads (green), and CD31 (red). Scale bar: 1000 µm. D) Modified Garcia test, E) time turn, F) time total, and G) wire hanging test at 24 h after SAH revealed anti‐CD47 and anti‐THBS1 therapy improved short‐term neurological function compared with Sham or SAH + igG group. n = 10–12 per group. *p < 0.05; **p < 0.01, ***p < 0.001 by paired two‐tailed Student's t‐test. H) GSEA showed apoptosis pathway was activated in mLECs after SAH. I) Representative immunoblot images showing effects of rTHBS1 (100 ng mL−1) treatment on pSTAT3 and Bcl‐2 inhibition in primary mLECs. J–M) Representative immunoblot images of STAT3, pSTAT3, Bax, and Bcl‐2 in different groups.
Figure 6
Figure 6
Cell trajectory analysis shows the evolution of mLECs. A) Labeling mLECs with real grouping information based on pseudotime trajectory map. B) Pseudotime trajectory map. C) Trajectory of representative genes in mLECs. D) Heatmap showing the top 30 pseudotime‐related genes. E) Representative two pseudo‐time‐related genes (S100α6 and Cldn5) based on q values. F,G) Increased expression of THBS1 and S100A6 are associated with poor prognosis, n = 48, *p < 0.05 by paired two‐tailed Student's t‐test. H) Linear relationship between THBS1 and S100A6 expression, r = 0.3779, p = 0.0081 by Spearman's rank test. H) Representative confocal images of mLVs region of sham and SAH 24 h group. Enlarged view of selected region in the merged photo (yellow dotted box) are listed on the right in each group. Lyve1 (blue), S100α6 (green), and CD31 (red). Yellow arrows indicate where mLVs lie. Scale bar: 800 µm for the holistic view and 100 µm for the enlarged view.

References

    1. Feng D., Zhou J., Liu H., Wu X., Li F., Zhao J., Zhang Y., Wang L., Chao M., Wang Q., Qin H., Ge S., Liu Q., Zhang J., Qu Y., Sci. Adv. 2022, 8, eabq2423. - PMC - PubMed
    1. Athiraman U., Zipfel G. J., Int. J. Mol. Sci. 2021, 22, 6550. - PMC - PubMed
    1. a) Fang Y., Wang X., Lu J., Shi H., Huang L., Shao A., Zhang A., Liu Y., Ren R., Lenahan C., Tang J., Zhang J., Zhang J. H., Chen S., EBioMedicine 2022, 76, 103843; - PMC - PubMed
    2. b) Chen J., Wang L., Xu H., Xing L., Zhuang Z., Zheng Y., Li X., Wang C., Chen S., Guo Z., Liang Q., Wang Y., Nat. Commun. 2020, 11, 3159. - PMC - PubMed
    1. a) Alitalo K., Nat. Med. 2011, 17, 1371; - PubMed
    2. b) Aspelund A., Robciuc M. R., Karaman S., Makinen T., Alitalo K., Circ. Res. 2016, 118, 515; - PubMed
    3. c) Wiig H., Swartz M. A., Physiol. Rev. 2012, 92, 1005. - PubMed
    1. a) Ahn J. H., Cho H., Kim J. H., Kim S. H., Ham J. S., Park I., Suh S. H., Hong S. P., Song J. H., Hong Y. K., Jeong Y., Park S. H., Koh G. Y., Nature 2019, 572, 62; - PubMed
    2. b) Louveau A., Smirnov I., Keyes T. J., Eccles J. D., Rouhani S. J., Peske J. D., Derecki N. C., Castle D., Mandell J. W., Lee K. S., Harris T. H., Kipnis J., Nature 2015, 523, 337; - PMC - PubMed
    3. c) Aspelund A., Antila S., Proulx S. T., Karlsen T. V., Karaman S., Detmar M., Wiig H., Alitalo K., J. Exp. Med. 2015, 212, 991. - PMC - PubMed

Publication types

MeSH terms

LinkOut - more resources