. 2023 Jul;10(20):e2300455.
doi: 10.1002/advs.202300455. Epub 2023 May 21.

YBX1-Mediated DNA Methylation-Dependent SHANK3 Expression in PBMCs and Developing Cortical Interneurons in Schizophrenia

Affiliations

YBX1-Mediated DNA Methylation-Dependent SHANK3 Expression in PBMCs and Developing Cortical Interneurons in Schizophrenia

Peiyan Ni et al. Adv Sci (Weinh). 2023 Jul.

Abstract

Schizophrenia (SCZ) is a severe psychiatric and neurodevelopmental disorder. The pathological process of SCZ starts early during development, way before the first onset of psychotic symptoms. DNA methylation plays an important role in regulating gene expression and dysregulated DNA methylation is involved in the pathogenesis of various diseases. The methylated DNA immunoprecipitation-chip (MeDIP-chip) is performed to investigate genome-wide DNA methylation dysregulation in peripheral blood mononuclear cells (PBMCs) of patients with first-episode SCZ (FES). Results show that the SHANK3 promoter is hypermethylated, and this hypermethylation (HyperM) is negatively correlated with the cortical surface area in the left inferior temporal cortex and positively correlated with the negative symptom subscores in FES. The transcription factor YBX1 is further found to bind to the HyperM region of SHANK3 promoter in induced pluripotent stem cells (iPSCs)-derived cortical interneurons (cINs) but not glutamatergic neurons. Furthermore, a direct and positive regulatory effect of YBX1 on the expression of SHANK3 is confirmed in cINs using shRNAs. In summary, the dysregulated SHANK3 expression in cINs suggests the potential role of DNA methylation in the neuropathological mechanism underlying SCZ. The results also suggest that HyperM of SHANK3 in PBMCs can serve as a potential peripheral biomarker of SCZ.

Keywords: DNA methylation; SHANK3; YBX1; cortical interneurons; induced pluripotent stem cells; schizophrenia.


Conflict of interest statement

The authors declare no conflict of interest.

Figures
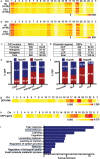
Figure 1
Figure 1
Genome‐wide DNA methylation profile of PBMCs from HCs and patients with FES. a,b) Heatmap showing EP distribution in CGIs (a) and promoter regions (b). The heatmap shows the number of EPs on each chromosome of all samples. c,d) DEP distribution in CGIs (c) and promoter regions (d). Table shows the number and proportion (%) of DEPs located in different CGIs or promoter regions. e,f) The proportion of HyperM and HypoM in CGIs (e) and promoter regions (f). g,h) Heatmap showing the average number of DEPs per Mb (g) or per gene (h). Heatmap depicting the number of DEPs in each chromosome. i) Top Ten GO terms enriched in genes annotated by DEPs in the promoters obtained using the GO database. The GO terms represent biological processes. Chr, chromosome; HC, healthy control; FES, first‐episode schizophrenia; CGI, CpG islands; DEP, differential enrichment peaks; HyperM, hypermethylation; HypoM, hypomethylation; GO, gene ontology.
Figure 2
Figure 2
HyperM in the SHANK3 promoter region in PBMCs of the FES group. a) Illustration showing the SHANK3 gene location and protein structure along with experimental design for evaluating HyperM in the SHANK3 promoter region. a1) Diagram of chromosome 22, p‐the short arm and q‐the long arm. a2) Structure of the SHANK3 gene and the encoded protein. The number represents the exon. a3) The EP, DEP, and ROI in the SHANK3 promoter. The number represents the base position on chromosome 22. b) EP length and scores in each subject (cut‐off value with peak score > 2.0). The horizontal coordinate denotes the location of the samples on chromosome 22. c) Averaged log2‐ratio with ROI analysis validated the HyperM in the FES group (t = 3.100, p = 0.004). Bar represents the mean ± SEM. d,e) The cortical surface area was reduced in the FES group. d) Green represents the fusiform. Light blue represents the inferior parietal cortex. Blue represents the isthmus cingulate. Red represents the frontal pole. Yellow represents the inferior temporal cortex. e) Significant regions with reduced surface area in the FES group compared to the HC group (p < 0.05). Student's t‐test was used for analysis and bars indicate the mean ± SEM. f) HyperM in the SHANK3 promoter region was negatively correlated with the surface area of the left inferior temporal cortex (p = 0.044, r = −0.347). g) HyperM in the SHANK3 promoter region was positively correlated with the PANSS negative subscale scores (p = 0.013, r = 0.603). EP, enrichment peaks; DEP, differential enrichment peaks; ROI, region of interest; L, left; R, right.
Figure 3
Figure 3
HyperM in the SHANK3 promoter in iPSC‐derived cINs of the SCZ group. a) Differentiation scheme and experimental design to obtain cINs from iPSCs and ESCs. b) Immunocytochemistry and cell counting analysis of generated cINs for evaluating the expression of SOX6, GAD1, and β‐tubulin after 8 weeks of differentiation. Scale bar = 50 µm. Data are presented as the mean ± SEM from three independent experiments. c) CG1 and CG4 HyperM in the DEP of the SHANK3 promoter was validated using the pyrosequencing method in cINs. Data are presented as the mean ± SEM (CG1, t = 3.073, p = 0.018; CG4, t = 3.326, p = 0.013). d) SHANK3 expression in cINs was analyzed by RNA‐seq. Gene expression is shown as TPM. Data are presented as the mean ± SEM (t = 2.988, p = 0.020). e) The methylation of CG1 and CG4 was negatively correlated with the TPM of SHANK3 (CG1: r = −0.859, p = 0.003; CG4: r = −0.762, p = 0.017). f) Differentiation scheme and experimental design for generating GNs from iPSCs. g) Immunocytochemistry analysis of generated GNs for evaluating the expression of vGlu and GABA at week 7 of differentiation. Scale bar = 50 µm. h) SHANK3 expression in GNs was analyzed by RNA‐seq. Gene expression is shown as TPM. Data are presented as the mean ± SEM (t = 2.541, p = 0.038). SRM, serum replacement media; N2, N2 supplement (1:200); AA, 200 µm ascorbic acid; B27, B27 supplement (1:100); LDN, 100 nm LDN193189; SB, 10 µm SB431542; SAG, 0.1 µm smoothened agonist; IWP2, 5 µm inhibitor of Wnt production‐2; FGF8, 100 ng mL−1 fibroblast growth factor 8; BDNF, 10 ng mL−1 brain‐derived neurotrophic factor; GDNF, 10 ng mL−1 glial cell‐derived neurotrophic factor; HC, healthy control; SCZ, schizophrenia; β‐tub, β‐tubulin; TPM, transcripts per million.
Figure 4
Figure 4
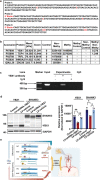
Binding of the transcription factor YBX1 to the HyperM region of the SHANK3 promoter. a) Sequences of probes with biotin labeling and methylation modification used in the pull‐down experiment. Sequences without biotin‐labeling and methylation modification were used as negative controls. b) Transcription factors were identified by mass spectrometry analysis using the MaxQuant computational platform. c) ChIP analysis to confirm the direct binding of the transcription factor YBX1. Nonspecific IgG and beads‐only were used as negative controls. d) Capillary western blotting to evaluate YBX1 and SHANK3 expression in H9‐derived cIN spheres infected with vehicle or YBX1 shRNA lentiviruses. Data are presented as the mean ± SEM. One‐way ANOVA was used for analysis (n = 3) followed by Dunnett's post‐hoc analysis. After normalization to GAPDH, the relative expression of YBX1 (F = 22.434, p = 0.002; control vs shYBX1 Dunnett's p = 0.001; vehicle vs shYBX1 Dunnett's p = 0.004) and SHANK3 (F = 9.204, p = 0.015; control vs shYBX1 Dunnett's p = 0.016; vehicle vs shYBX1 Dunnett's p = 0.019) was quantified by measuring the peak areas detected by the Compass for Simple Western software. e) Schematic diagram illustrating the pathological role of the YBX1‐SHANK3 axis and the translational prospects of the SHANK3 promotor HyperM in PBMCs in schizophrenia. HC, healthy control; SCZ, schizophrenia; cIN, cortical interneuron; PBMCs, peripheral blood mononuclear cells; HyperM, hypermethylation.

References

    1. American Psychiatric Association ,Diagnostic and statistical manual of mental disorders: DSM‐5TM (5th ed.), American Psychiatric Publishing, Washington, DC 2013.
    1. a) GBD 2019 Diseases and Injuries Collaborators , Lancet 2020, 396, 1204; - PMC - PubMed
    2. b) Kahn R. S., Sommer I. E., Murray R. M., Meyer‐Lindenberg A., Weinberger D. R., Cannon T. D., O'Donovan M., Correll C. U., Kane J. M., van Os J., Insel T. R., Nat. Rev. Dis. Primers 2015, 1, 15067. - PubMed
    1. a) Ovenden E. S., McGregor N. W., Emsley R. A., Warnich L., Prog. Neuro‐Psychopharmacol. Biol. Psychiatry 2018, 81, 38; - PubMed
    2. b) Insel T. R., Nature 2010, 468, 187; - PubMed
    3. c) Galderisi S., Mucci A., Buchanan R. W., Arango C., Psychiatry 2018, 5, 664. - PubMed
    1. Pepper E., Cardno G. A., Curr. Psychiatry Rev. 2014, 10, 133.
    1. Schizophrenia Working Group of the Psychiatric Genomics Consortium , Nature 2014, 511, 421.

Publication types

MeSH terms