. 2023 Jul 5;31(7):2169-2187.
doi: 10.1016/j.ymthe.2023.05.015. Epub 2023 May 21.

Polyphyllin D punctures hypertrophic lysosomes to reverse drug resistance of hepatocellular carcinoma by targeting acid sphingomyelinase

Affiliations

Polyphyllin D punctures hypertrophic lysosomes to reverse drug resistance of hepatocellular carcinoma by targeting acid sphingomyelinase

Yang Wang et al. Mol Ther. .

Abstract

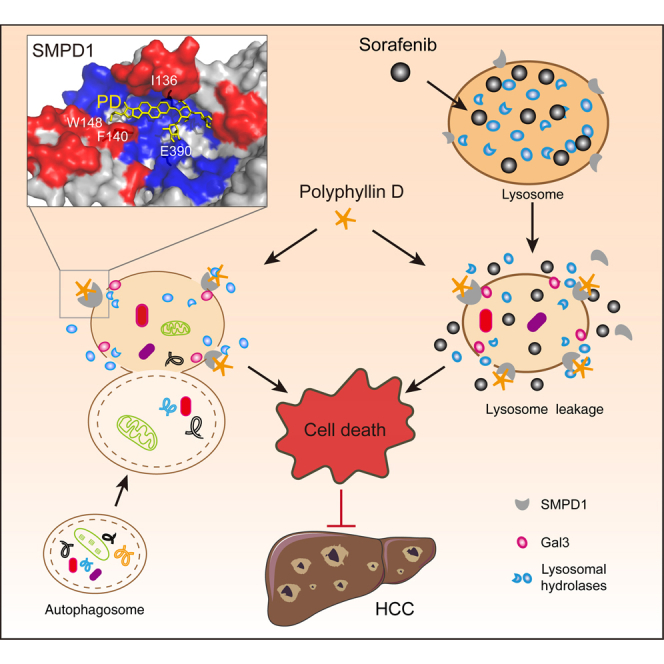
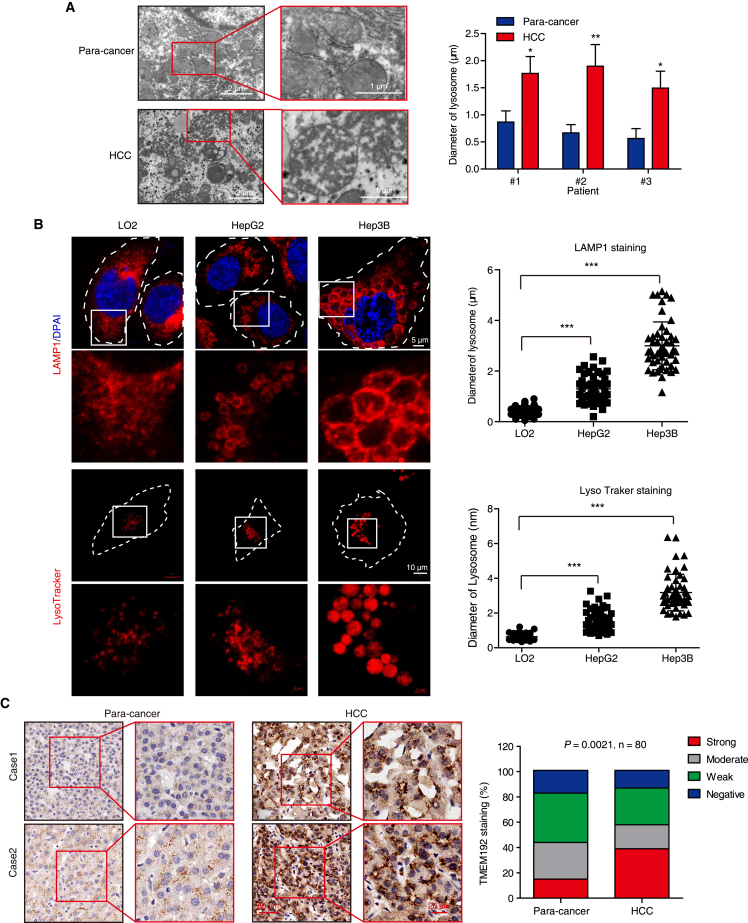
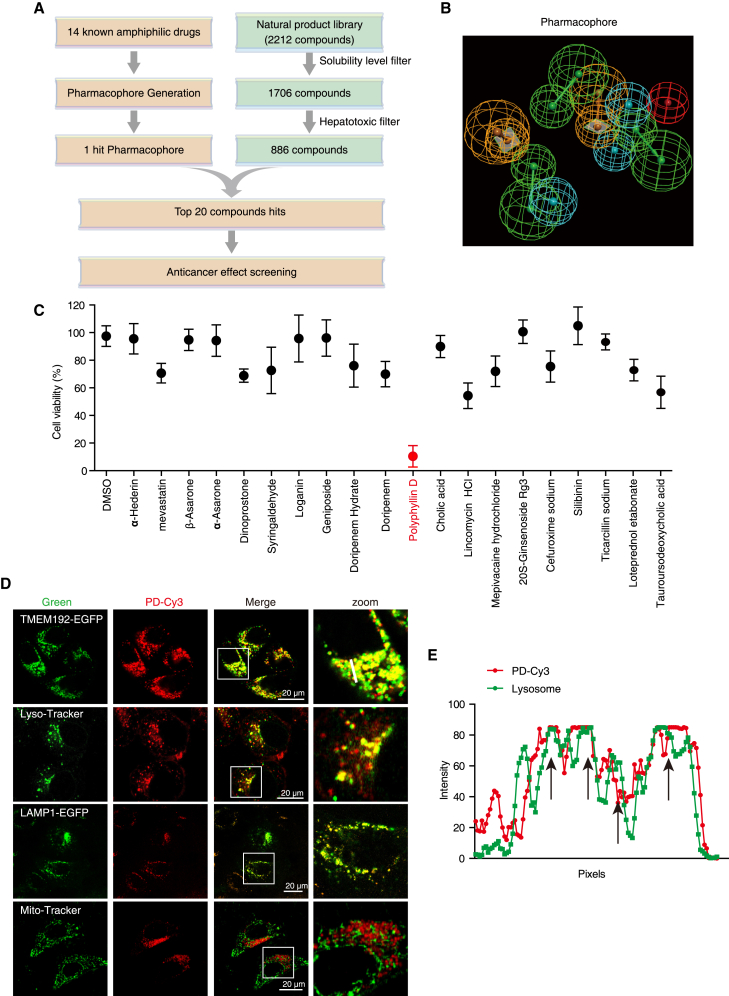
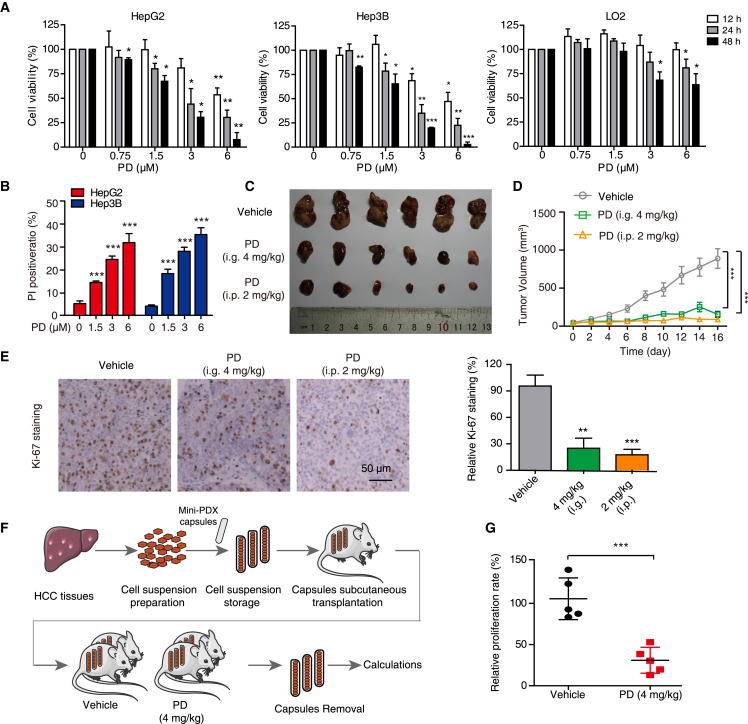
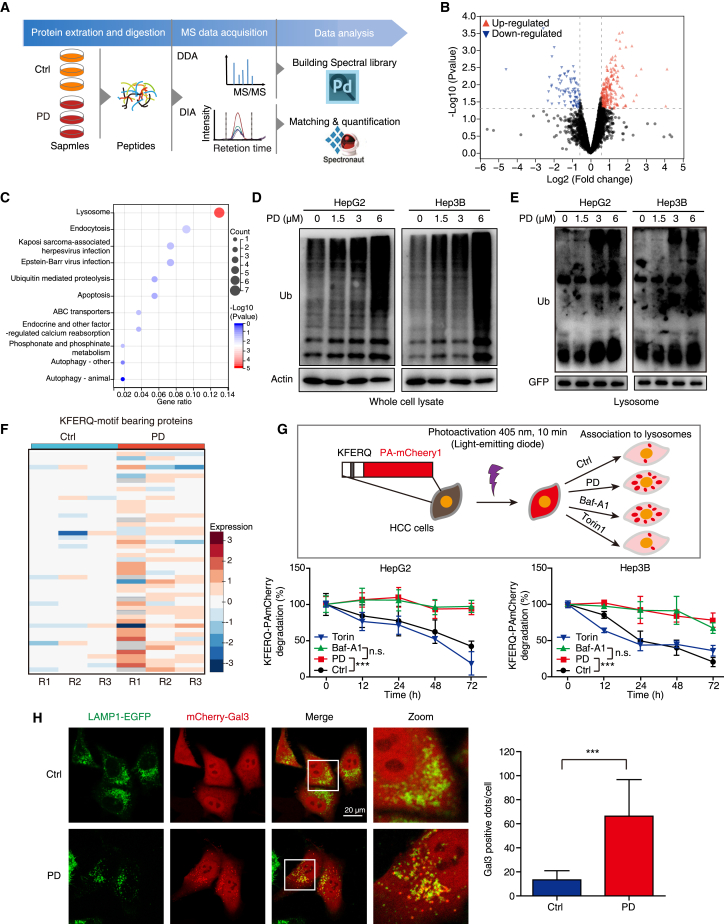
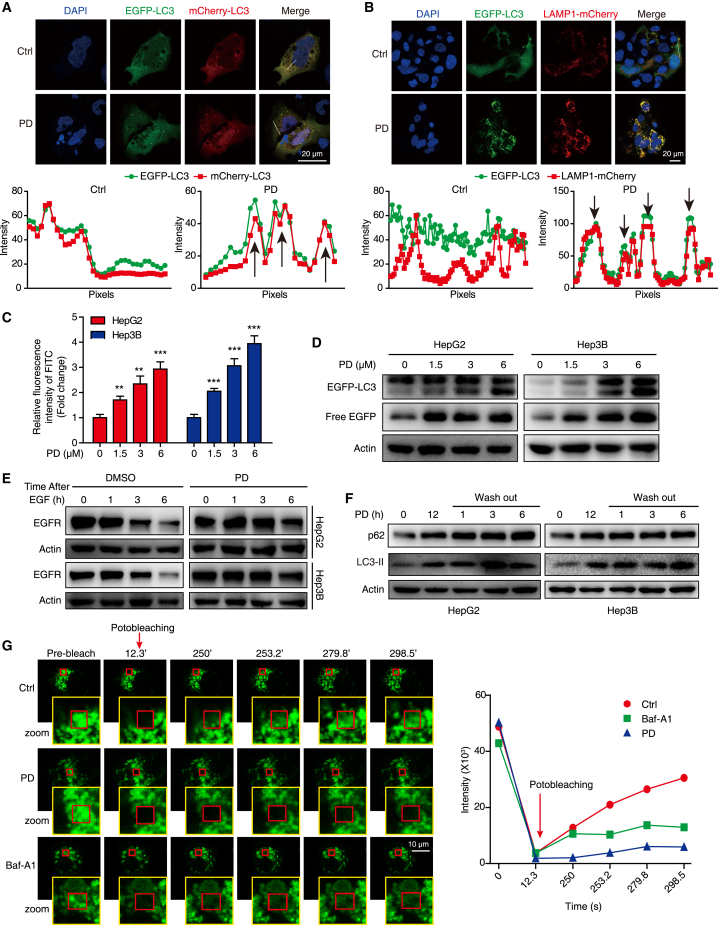
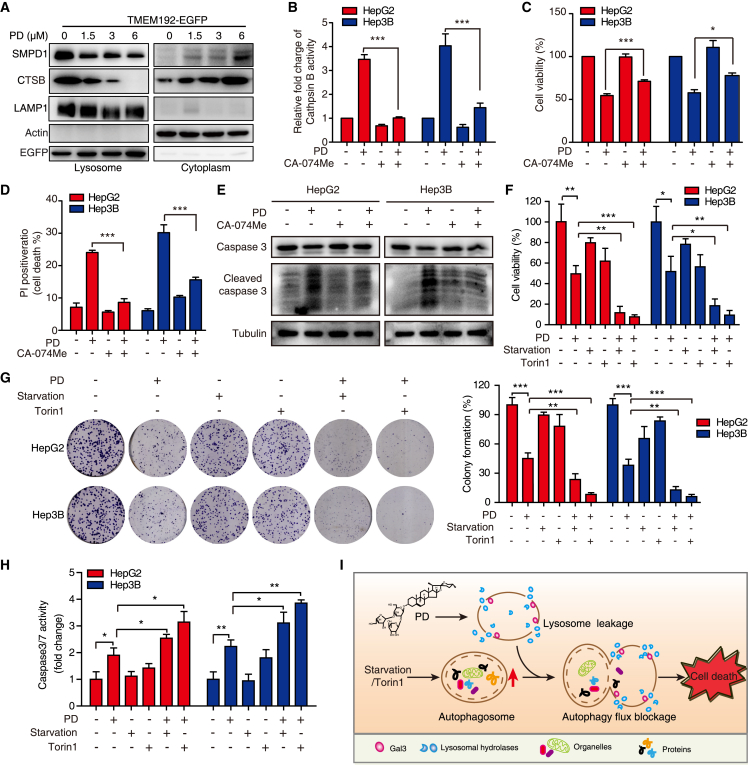
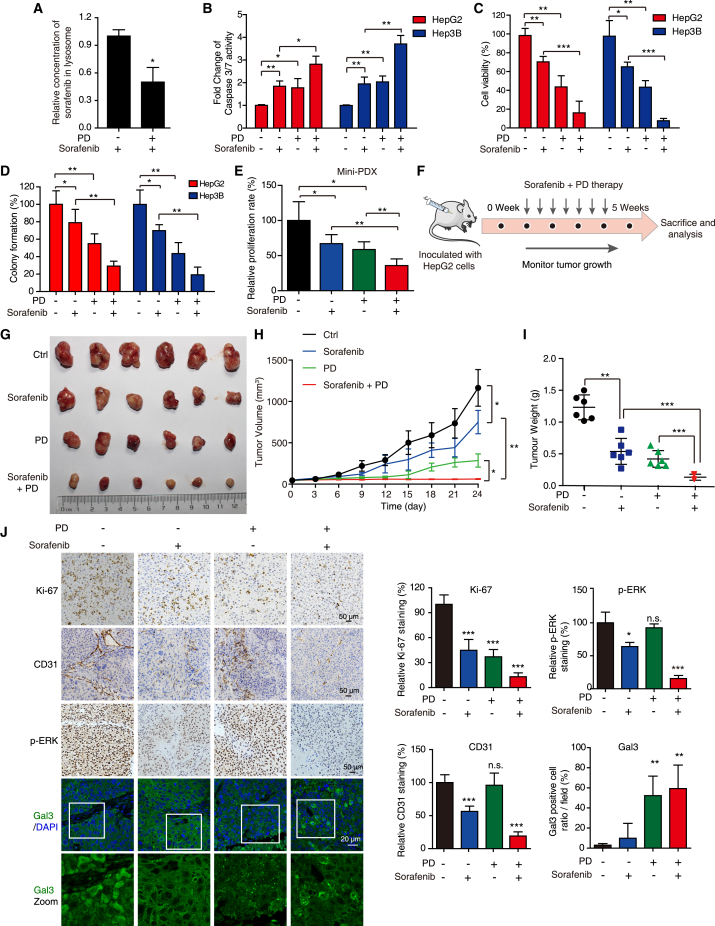
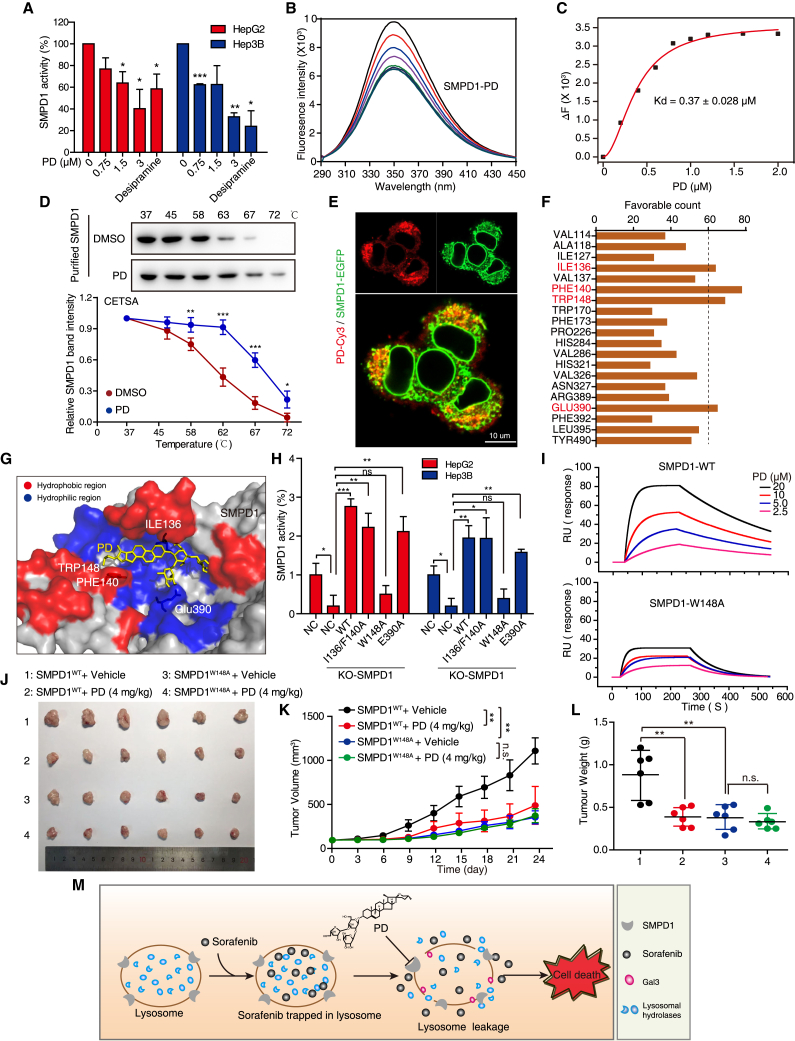
Hypertrophic lysosomes are critical for tumor progression and drug resistance; however, effective and specific lysosome-targeting compounds for cancer therapy are lacking. Here we conducted a lysosomotropic pharmacophore-based in silico screen in a natural product library (2,212 compounds), and identified polyphyllin D (PD) as a novel lysosome-targeted compound. PD treatment was found to cause lysosomal damage, as evidenced by the blockade of autophagic flux, loss of lysophagy, and the release of lysosomal contents, thus exhibiting anticancer effects on hepatocellular carcinoma (HCC) cell both in vitro and in vivo. Closer mechanistic examination revealed that PD suppressed the activity of acid sphingomyelinase (SMPD1), a lysosomal phosphodieserase that catalyzes the hydrolysis of sphingomyelin to produce ceramide and phosphocholine, by directly occupying its surface groove, with Trp148 in SMPD1 acting as a major binding residue; this suppression of SMPD1 activity irreversibly triggers lysosomal injury and initiates lysosome-dependent cell death. Furthermore, PD-enhanced lysosomal membrane permeabilization to release sorafenib, augmenting the anticancer effect of sorafenib both in vivo and in vitro. Overall, our study suggests that PD can potentially be further developed as a novel autophagy inhibitor, and a combination of PD with classical chemotherapeutic anticancer drugs could represent a novel therapeutic strategy for HCC intervention.

Keywords: hepatocellular carcinoma; lysophagy; lysosomal cell death; lysosome hypertrophy; polyphyllin D; sorafenib resistance.


Conflict of interest statement

Declaration of interests The authors declare no competing interests.

Figures

None
Graphical abstract
Figure 1
Figure 1
HCC cells display lysosomal hypertrophy (A) Representative TEM images of lysosomal morphology and quantification of lysosomal diameter from three HCC and paired paracancerous tissues. (B) The morphology of lysosomes in HepG2, Hep3B, and LO2 cells stained with anti-LAMP1 antibody (fixed cells) or LysoTracker (living cells) were imaged by confocal microscope, and the lysosome diameter was measured and statistically analyzed. Five random fields with at least 50 lysosomes were measured for lysosome diameter in each cell type. All data are represented as mean ± SD; significance was determined by unpaired Student’s t test for (A) and (B); p < 0.05; ∗∗p < 0.01; ∗∗∗p < 0.001. (C) Representative images and expression pattern of TMEM192 in cancer tissues and paired paracancerous tissues from 80 HCC patients. Scale bar, 20 μm.
Figure 2
Figure 2
Identification of PD as a lysosome-targeting compound (A) Schematic diagram depicting the strategy for the identification of amphiphilic drugs by virtual screening with a natural product library (2,212 compounds). (B) Pharmacophore mapping of fit compounds in the test set with 14 known amphiphilic drugs. Pharmacophore features: Green, HB acceptor; cyan, hydrophobic; orange, Ring aromatic; red, POS ionizable. (C) Cell viability measurement of HepG2 cells treated with the top 20 compounds at 10 μM for 24 h by WST-1 assay. Polyphyllin D (PD) with the highest inhibitory ratio on cell viability was marked in red. (D) Colocalization of PD with lysosomes. PD-Cy3 (1 μM) loaded HepG2 cells were stained with LysoTracker (green) or Mito-Tracker (green) or transfected with TMEM192-EGFP and LAMP1-EGFP, and subjected to confocal imaging. (E) The intensity profile of PD-Cy3 and TMEM192-EGFP along the white line was plotted in (D), with the colocalization sites marked with black arrows.
Figure 3
Figure 3
PD inhibits HCC cell growth both in vitro and in vivo (A) Cell viability measurement of HepG2, Hep3B, and LO2 cells treated with PD at increasing concentrations (up to 6 μM) for 12, 24, and 48 h by WST-1 assays. (B) The cell death of HepG2 and Hep3B cells stimulated with PD (0–6 μM, 24 h) was detected by PI staining, and the PI-positive cells were quantified. (C) Representative images of excised Hep3B tumors from mice with intragastric administration (i.g.) at 4 mg/kg or intraperitoneal injection (i.p.) at 2 mg/kg (n = 6). (D) Tumor growth curves; data are represented as mean ± SEM. (E) IHC staining for Ki-67. (F) An overview of the establishment of HCC MiniPDX model. (G) Scatterplot showing the relative proliferation rate of the HCC MiniPDX model upon treatment with PD (i.g. 4 mg/kg). n = 6; data are represented as mean ± SD; ∗p < 0.05; ∗∗p < 0.01; ∗∗∗p < 0.001.
Figure 4
Figure 4
PD induces lysosomal injury and delays global cargo degradation (A) Workflow of DIA-based proteomics for the identification of PD-regulated proteins. (B) Volcano plot of DEPs in the PD group vs. the control group. Red dots, upregulated proteins; Blue dots, downregulated proteins. (C) Kyoto Encyclopedia of Genes and Genomes pathway analysis of the upregulated proteins in the PD group. (D, E) HCC cells were treated with PD (0–6 μM) for 24 h, and the ubiquitin levels in whole-cell lysates (D) and lysosomes (E) were determined by western blotting. The HCC cells expressing GFP tagged TMEM192 for the lysosome extraction. TMEM192-GFP was used as loading control for lysosome fraction. (F) Heatmap showing the KFERQ motif-bearing proteins regulated by PD. (G) HCC cells expressing the KFERQ-PA-mCherry1 reporter were subjected to photoconversion at 405 nm for 10 min, and then treated with PD (1.5 μM), Baf-A1 (200 nM; an inhibitor of vacuolar-type H+-ATPase), or Torin1 (1 μM; an inhibitor of mTOR), respectively. Fluorescence (emitted at 535 nm) was measured with a multifunctional microplate reader at the indicated time points. (H) HepG2 cells expressing mCherry-Gal3 and LAMP1-EGFP were treated with or without PD (1.5 μM) for 12 h, and subjected to confocal imaging. At least 30 random cells were measured for Gal3-positive dots. All data are represented as mean ± SD; ns, no significance; ∗∗∗p < 0.001.
Figure 5
Figure 5
PD blocks autophagic flux in HCC cells (A) HepG2 cells transfected with mCherry-EGFP-LC3 were treated with PD (3 μM, 24 h), and photographed using confocal microscopy. The intensity profiles of EGFP and mCherry along the white line are plotted in the lower panels, with the colocalization sites marked with black arrows. (B) HepG2 cells co-transfected with the EGFP-LC3 and LAMP1-mCherry plasmids were incubated with PD (3 μM, 24 h), and then detected by confocal microscopy. The intensity profiles of EGFP-LC3 and LAMP1-mCherry along the white line were plotted in the lower panels, with the colocalization sites marked by black arrows. (C) Both HCC cell lines were loaded with FITC-dextran for 24 h and then treated with increasing concentrations of PD (0–6 μM); FITC fluorescence was detected by flow cytometry. Data are represented as the mean ± SD, n = 3; ∗∗p < 0.01; ∗∗∗p < 0.001. (D) Western blot analysis of EGFP-LC3 and free EGFP levels in EGFP-LC3 expressing HCC cells treated with increasing concentrations of PD for 24 h. (E) Cells pretreated with PD (3 μM, 12 h) were incubated with EGF (200 ng/mL, 2 h), then the medium was washed out and samples were collected at the indicated time points for IB analysis. (F) After HCC cells were treated with PD (3 μM, 12 h), then western blot analysis was performed to measure the expression of p62 and LC3-II at the indicated time points after PD washed out. (G) HepG2 cells expressing TMEM192-EGFP was incubated with DMSO (Ctrl), PD (3 μM), or Baf-A1 (200 nM, an inhibitor of vacuolar-type H+-ATPase) for 24 h, and then imaged upon photobleaching at the indicated time points. The decay of intensity was calculated in each frame, from the first frame after photobleaching to the end of the acquisition.
Figure 6
Figure 6
PD triggers LMP to release lysosomal contents augmented by autophagic flux burden (A) Western blot analysis of the SMPD1 and cathepsin B levels in lysosome and cytoplasm fractions after PD treatment. (B–E) HepG2 and Hep3B cells were treated with PD (3 μM, 24 h) in the presence or absence of CA-074 methyl ester (50 μM), a cathepsin B inhibitor. Then the activity of cathepsin B was analyzed by flow cytometry (B), the cell viability was tested by WST-1 assay (C), death cells were analyzed by PI staining assay (D), and the expression of pro-caspase 3, cleaved caspase-3 was determined by western blotting (E). (F–H) The anticancer effects of PD were augmented by starvation and Torin1 treatment. HCC cells were treated with PD (3 μM), serum deprived or Torin1 (1 μM, a specific mTOR inhibitor) as indicated. The cell viability was then tested by WST-1 assay (F), the ability to form colonies was determined by the colony formation assay (G), and caspase 3/7 activity was measured by flow cytometry (H). (I) A proposed model summarizing how PD triggers lysosome leakage, contributing to cell death, which can be amplified by the intracellular autophagic flux burden. All data are represented as mean ± SD, n = 3; ∗p < 0.05; ∗∗p < 0.01; ∗∗∗p < 0.001.
Figure 7
Figure 7
PD amplifies the anticancer effects of sorafenib on HCC in vitro and in vivo (A) The concentration of sorafenib in lysosomes with or without PD treatment (3 μM) was analyzed by LC-MS/MS, showing that PD induced sorafenib release from lysosomes. (B–D) HCC cells were treated with PD (1.5 μM) in the presence or absence of sorafenib (10 μM) as indicated. Then, caspase 3/7 activity was measured by flow cytometry (B), cell viability was tested by WST-1 assay (C), and the cell growth was determined by colony formation assay (D). (E) The therapeutic response of PD and sorafenib combined treatment on the HCC MiniPDX model. The relative proliferation rate of the HCC MiniPDX model upon treatment with PD (i.g. 4 mg/kg) and sorafenib (i.g. 10 mg/kg) was measured (n = 6). (F–J) Nude mice bearing HepG2-derived xenografts received PD (4 mg/kg), sorafenib (10 mg/kg), or vehicle control by oral gavage every 3 days, respectively (n = 6) (F). The tumor photos (G), tumor volume curves (H), tumor weights (I), and IHC staining for Ki-67, CD31, p-ERK, and Gal3/DAPI in the indicated tumor xenografts (J) are shown. All data are presented as the mean ± SD; ∗p < 0.05; ∗∗p < 0.01; ∗∗∗p < 0.001; ns, no significance.
Figure 8
Figure 8
PD inhibits HCC cell growth by targeting the surface groove of SMPD1 at W148 (A) Enzymatic activity of SMPD1 in HCC cells treated with increasing concentrations of PD (0–3 μM) or desipramine (10 μM, positive control) was determined by SMPD1 activity assay. (B) The interaction between PD and SMPD1 was determined by fluorescence titration experiments. (C) The fluorescence quenching of SMPD1 at 340 nm vs. the PD concentration was fitted with Hill plot. (D) CETSA curves comparing the change in the thermal stability of recombinant SMPD1 upon treatment with PD and DMSO. (E) Confocal microscope of cells expressing SMPD1-GFP after treatment with PD-Cy3 (1 μM), the colocalization of SMPD1 and PD-Cy3 was imaged. Scale bar, 10 μm. (F) The favorable counts for each amino acid of SMPD1 bound with PD. (G) Proposed binding pose depiction of the potential interaction mode between PD and SMPD1. Red, hydrophobic region; blue, hydrophilic region. (H) SMPD1WT, SMPD1I136/P140A, SMPD1W148A, or SMPD1E390A was introduced into SMPD1-KO cells, and the enzymatic activity of SMPD1 was detected by SMPD1 activity assay. (I) SPR sensorgram for the association of PD with immobilized SMPD1WT and SMPD1W148A. (J–L) Tumors formed by HepG2-SMPD1-KO cells expressing WT or W148 mutant SMPD1 proteins were treated with or without PD (i.g 4 mg/kg), then the tumor photos (J), tumor growth curves (K), and tumor weight (L) were compared (n = 6). All data are represented as the mean ± SD; p < 0.05; ∗∗p < 0.01; ∗∗∗p < 0.001. (M) Schematic diagram summarizing how PD overcomes sorafenib resistance in HCC.

References

    1. Schaaf M.B., Houbaert D., Meçe O., To S.K., Ganne M., Maes H., Agostinis P. Lysosomal pathways and autophagy distinctively control endothelial cell behavior to affect tumor vasculature. Front. Oncol. 2019;9:171. - PMC - PubMed
    1. Serrano-Puebla A., Boya P. Lysosomal membrane permeabilization in cell death: new evidence and implications for health and disease. Ann. N. Y. Acad. Sci. 2016;1371:30–44. - PubMed
    1. Piao S., Amaravadi R.K. Targeting the lysosome in cancer. Ann. N. Y. Acad. Sci. 2016;1371:45–54. - PMC - PubMed
    1. Gulbins E., Kolesnick R.N. It takes a CAD to kill a tumor cell with a LMP. Cancer Cell. 2013;24:279–281. - PubMed
    1. Mrschtik M., Ryan K.M. Lysosomal proteins in cell death and autophagy. FEBS J. 2015;282:1858–1870. - PubMed

Publication types

LinkOut - more resources