

FHOD1 is upregulated in glioma cells and attenuates ferroptosis of glioma cells by targeting HSPB1 signaling
- PMID: 37211949
- PMCID: PMC10580363
- DOI: 10.1111/cns.14264
FHOD1 is upregulated in glioma cells and attenuates ferroptosis of glioma cells by targeting HSPB1 signaling
Abstract
Background: As a new type of regulatory cell death, ferroptosis has been proven to be involved in cancer pathogenesis and therapeutic response. However, the detailed roles of ferroptosis or ferroptosis-associated genes in glioma remain to be clarified.
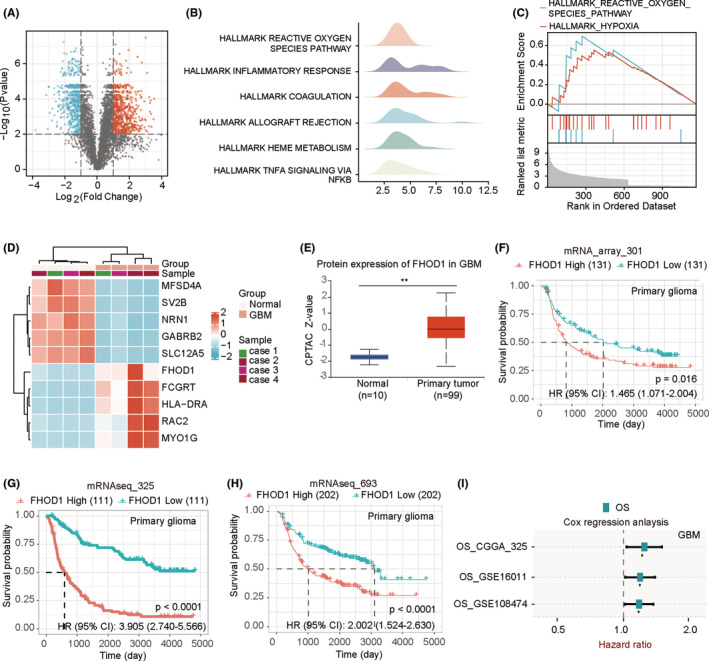
Methods: Here, we performed the TMT/iTRAQ-Based Quantitative Proteomic Approach to identify the differentially expressed proteins between glioma specimens and adjacent tissues. Kaplan-Meier survival was used to estimate the survival values. We also explored the regulatory roles of abnormally expressed formin homology 2 domain-containing protein 1 (FHOD1) in glioma ferroptosis sensitivity.
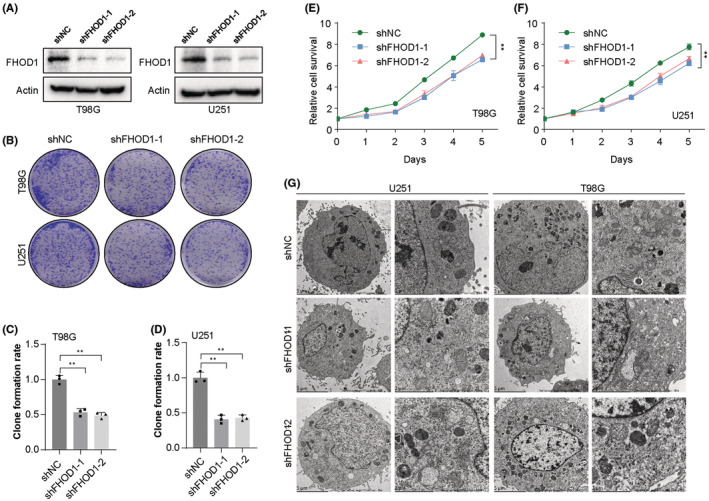
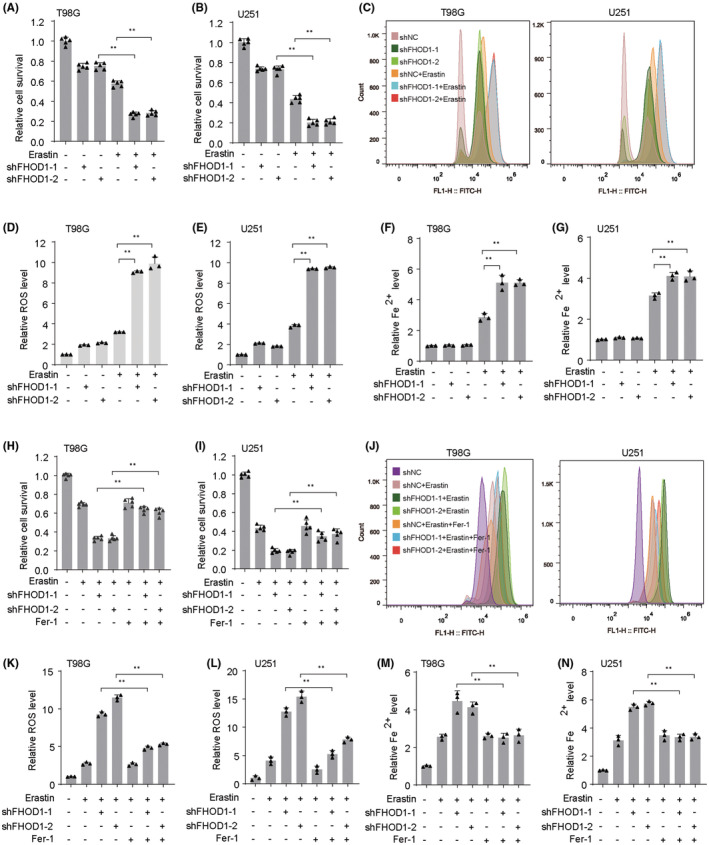
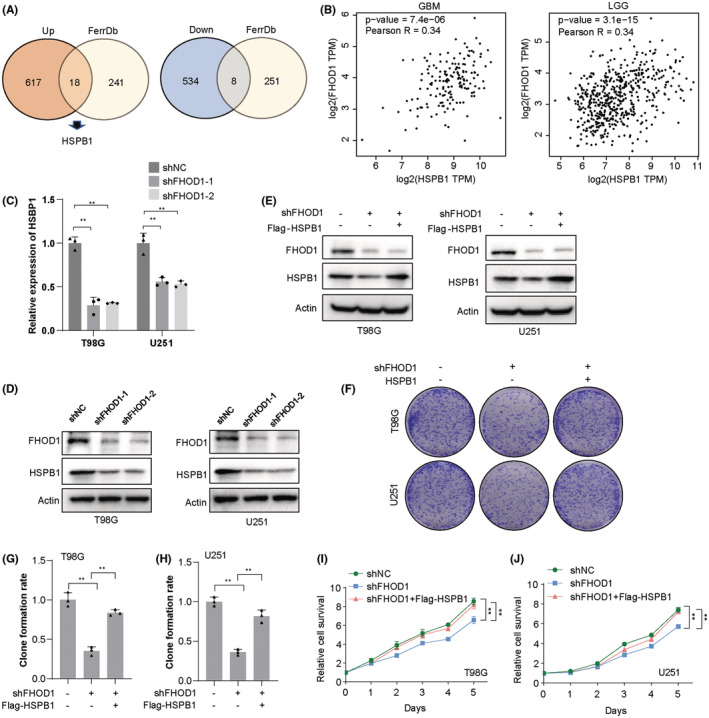
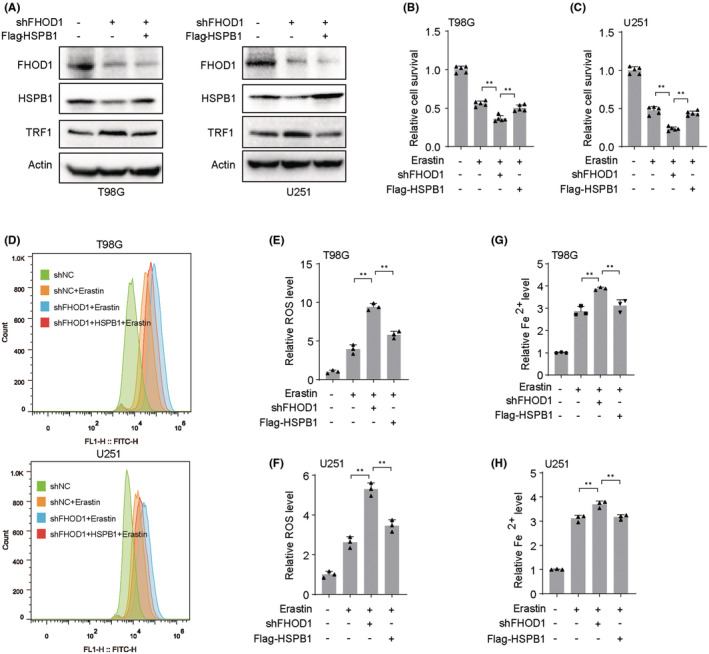
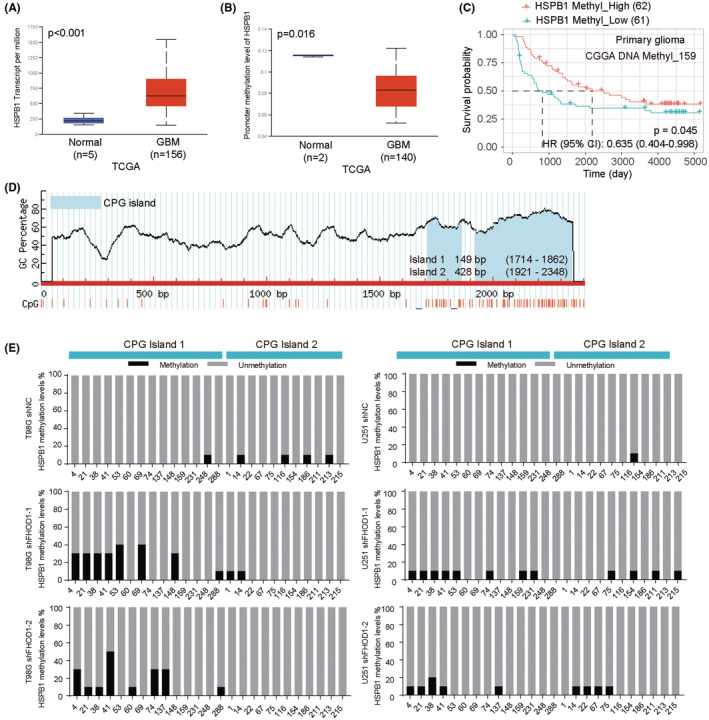
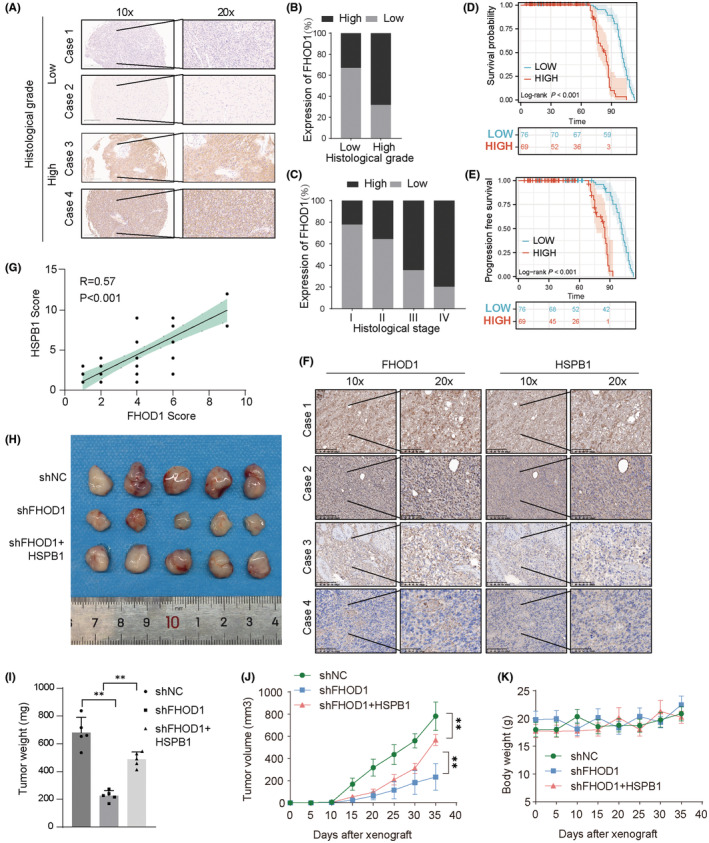
Results: In our study, FHOD1 was identified to be the most significantly upregulated protein in glioma tissues. Multiple glioma datasets revealed that the glioma patients with low FHOD1 expression displayed favorable survival time. Functional analysis proved that the knockdown of FHOD1 inhibited cell growth and improved the cellular sensitivity to ferroptosis in glioma cells T98G and U251. Mechanically, we found the up-regulation and hypomethylation of HSPB1, a negative regulator of ferroptosis, in glioma tissues. FHOD1 knockdown could enhance the ferroptosis sensitivity of glioma cells via up-regulating the methylated heat-shock protein B (HSPB1). Overexpression of HSPB1 significantly reversed FHOD1 knockdown-mediated ferroptosis.
Conclusions: In summary, this study demonstrated that the FHOD1-HSPB1 axis exerts marked regulatory effects on ferroptosis, and might affect the prognosis and therapeutic response in glioma.
Keywords: FHOD1; HSPB1; ferroptosis; glioma; prognosis.
© 2023 The Authors. CNS Neuroscience & Therapeutics published by John Wiley & Sons Ltd.
Conflict of interest statement
The authors declare that there are no conflicts of interest.
Figures
Similar articles
-
Role of FHOD1 in tumor cells and tumor immune microenvironment.Front Immunol. 2025 Apr 29;16:1514488. doi: 10.3389/fimmu.2025.1514488. eCollection 2025. Front Immunol. 2025. PMID: 40364836 Free PMC article. Review.
-
Multiple formin proteins participate in glioblastoma migration.BMC Cancer. 2020 Jul 29;20(1):710. doi: 10.1186/s12885-020-07211-7. BMC Cancer. 2020. PMID: 32727404 Free PMC article.
-
Effects of ferroptosis-related gene HSPB1 on acute myeloid leukemia.Int J Lab Hematol. 2024 Oct;46(5):899-909. doi: 10.1111/ijlh.14319. Epub 2024 Jun 2. Int J Lab Hematol. 2024. PMID: 38826023
-
Novel signaling axis of FHOD1-RNF213-Col1α/Col3α in the pathogenesis of hypertension-induced tunica media thickening.J Mol Cell Cardiol. 2023 Sep;182:57-72. doi: 10.1016/j.yjmcc.2023.07.008. Epub 2023 Jul 21. J Mol Cell Cardiol. 2023. PMID: 37482037
-
Peptide aptamers: tools to negatively or positively modulate HSPB1(27) function.Philos Trans R Soc Lond B Biol Sci. 2013 Mar 25;368(1617):20120075. doi: 10.1098/rstb.2012.0075. Print 2013 May 5. Philos Trans R Soc Lond B Biol Sci. 2013. PMID: 23530261 Free PMC article. Review.
Cited by
-
Role of FHOD1 in tumor cells and tumor immune microenvironment.Front Immunol. 2025 Apr 29;16:1514488. doi: 10.3389/fimmu.2025.1514488. eCollection 2025. Front Immunol. 2025. PMID: 40364836 Free PMC article. Review.
-
GPX8 regulates pan-apoptosis in gliomas to promote microglial migration and mediate immunotherapy responses.Front Immunol. 2023 Sep 19;14:1260169. doi: 10.3389/fimmu.2023.1260169. eCollection 2023. Front Immunol. 2023. PMID: 37795080 Free PMC article.
-
CircRNF10 triggers a positive feedback loop to facilitate progression of glioblastoma via redeploying the ferroptosis defense in GSCs.J Exp Clin Cancer Res. 2023 Sep 19;42(1):242. doi: 10.1186/s13046-023-02816-9. J Exp Clin Cancer Res. 2023. PMID: 37723588 Free PMC article.
-
Global research landscape and hotspots for ferroptosis in glioma: A comprehensive bibliometric and visual analysis.Heliyon. 2025 Jan 25;11(3):e42242. doi: 10.1016/j.heliyon.2025.e42242. eCollection 2025 Feb 15. Heliyon. 2025. PMID: 39931474 Free PMC article. Review.
References
-
- Li X, Geng X, Chen Z, Yuan Z. Recent advances in glioma microenvironment‐response nanoplatforms for phototherapy and sonotherapy. Pharmacol Res. 2022;179:106218. - PubMed
Publication types
MeSH terms
Substances
LinkOut - more resources
Full Text Sources
Molecular Biology Databases
Research Materials
Miscellaneous
