

Phospholipid scramblase Xkr8 is required for developmental axon pruning via phosphatidylserine exposure
- PMID: 37211968
- PMCID: PMC10350823
- DOI: 10.15252/embj.2022111790
Phospholipid scramblase Xkr8 is required for developmental axon pruning via phosphatidylserine exposure
Abstract
The mature mammalian brain connectome emerges during development via the extension and pruning of neuronal connections. Glial cells have been identified as key players in the phagocytic elimination of neuronal synapses and projections. Recently, phosphatidylserine has been identified as neuronal "eat-me" signal that guides elimination of unnecessary input sources, but the associated transduction systems involved in such pruning are yet to be described. Here, we identified Xk-related protein 8 (Xkr8), a phospholipid scramblase, as a key factor for the pruning of axons in the developing mammalian brain. We found that mouse Xkr8 is highly expressed immediately after birth and required for phosphatidylserine exposure in the hippocampus. Mice lacking Xkr8 showed excess excitatory nerve terminals, increased density of cortico-cortical and cortico-spinal projections, aberrant electrophysiological profiles of hippocampal neurons, and global brain hyperconnectivity. These data identify phospholipid scrambling by Xkr8 as a central process in the labeling and discrimination of developing neuronal projections for pruning in the mammalian brain.
Keywords: callosal projections; circuit maturation; phosphatidylserine; phospholipid scrambling; synaptic pruning.
© 2023 The Authors. Published under the terms of the CC BY 4.0 license.
Conflict of interest statement
The authors declare that they have no conflict of interest.
Figures
- A
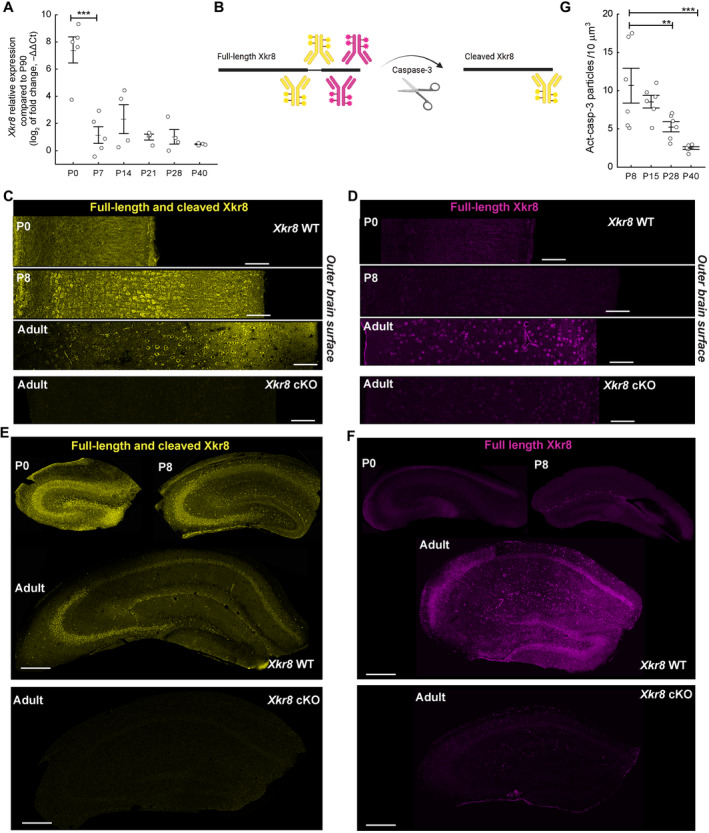
Xkr8 mRNA expression immediately after birth and during postnatal development. Quantitative RT–PCR data were normalized to Xkr8 mRNA expression at P90 (one‐way ANOVA, each dot represents an individual mouse, n = 4–6 per age group).
- B
To visualize the cleavage of Xkr8, two distinct antibodies were used that recognize either both full‐length and cleaved Xkr8 (yellow) or full‐length Xkr8 only (magenta).
- C–F
(C, E) Immunofluorescence labeling with an antibody that recognizes both full‐length and cleaved Xkr8 in developing (P0, P8) and adult S1 cortex and hippocampus. (D, F) Immunofluorescence labeling with an antibody recognizing full‐length uncleaved Xkr8 in developing (P0, P8) and adult S1 cortex and hippocampus. Loss of Xkr8 immunosignal in double transgenic Xkr8 flx/flx;Emx1::Cre animals (Xkr8 cKO) is observed with both Xkr8 antibodies (C–F).
- G
Immunofluorescence labeling of active caspase‐3 in developing brain from P8 to P40 in Xkr8 WT brains was analyzed by nested design and mixed model ANOVA, each dot represents an individual mouse (n = 6 per age group; images are presented in Fig EV2A).
- A, B
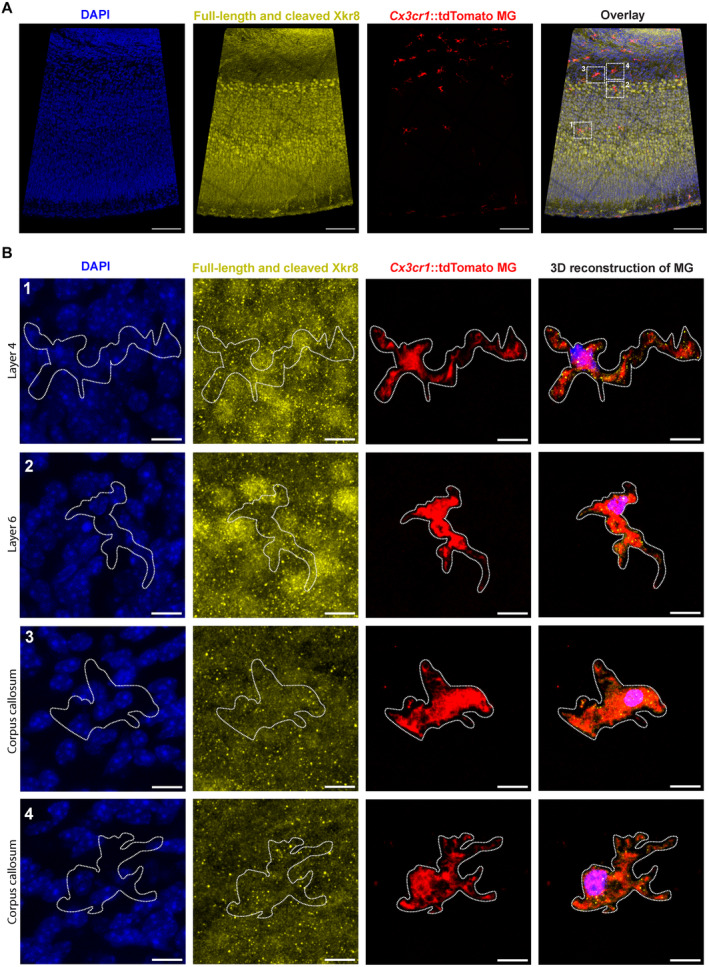
Immunofluorescence labeling of total Xkr8 (yellow) within tdTomato+ microglia (red) in the S1 cortex of P0 mouse in mosaic image (A) and enlarged representative cells in layer 4 (B, 1), layer 6 (B, 2) and corpus callosum (B, 3 and 4); scale bars 100 μm (A) and 10 μm (B).
- A, B
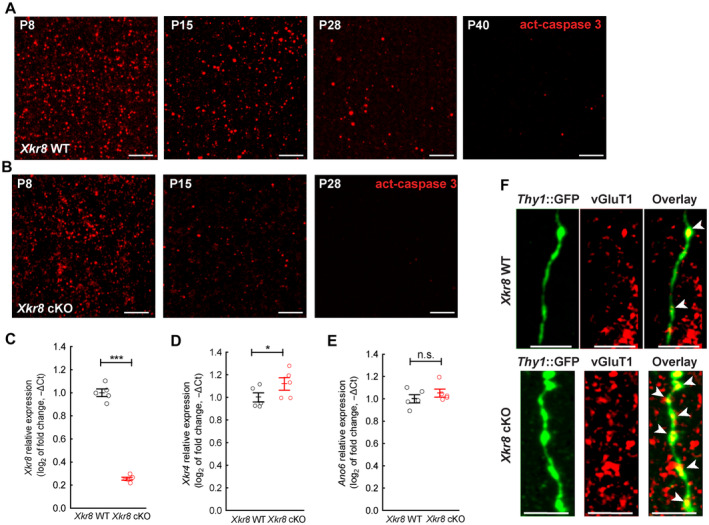
Immunofluorescence labeling of active caspase‐3 in developing brain of Xkr8 WT (A) and Xkr8 cKO (B) mice from P8 to P40; scale bar 2 μm. Signal quantification is presented in Fig 2C.
- C–E
Expression of Xkr8 (C), Xkr4 (D) and Ano6 (E) mRNA in postnatal P0 brain of Xkr8 WT and Xkr8 cKO mouse was measured by quantitative RT–PCR, normalized to the expression of Gadph at P0 and to the expression of that mRNA in Xkr8 WT brain. Data were analyzed by one‐way ANOVA, each dot represents an individual mouse, n = 5 per genotype group; mean ± SEM, *P < 0.05, ***P < 0.001.
- F
Immunofluorescence labeling of vGluT1 (red) in Thy1::GFP+ axons (green) in Xkr8 WT and Xkr8 cKO hippocampus. The arrows indicate axonal varicosities; scale bar 5 μm.

- A, B
Immunofluorescence co‐labeling of active caspase‐3 (cyan) and Xkr8 antibodies that recognize either both full‐length and cleaved Xkr8 (A, yellow) or only full‐length Xkr8 (B, magenta) in the S1 cortex of P8 mouse. Arrows mark co‐localizing particles, dashed circles label particles that do not co‐localize; scale bar 10 μm.
- A, B
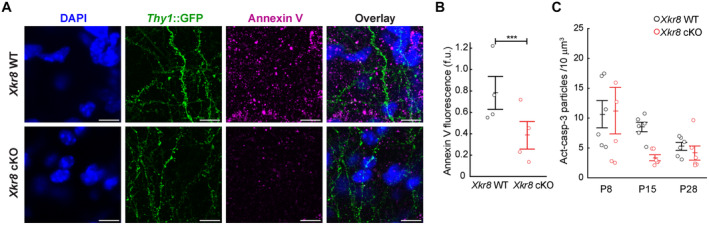
Organotypic slices of Xkr8 WT and cKO hippocampus with Thy1::GFP neurons (green) were labeled with PtdSer‐binding fluorescently tagged Annexin V (magenta) at 16–19 DIV. The fluorescence of bound Annexin V was quantified on ImageJ by measuring the integrated density of fluorescent structures within the same volume for each slice and expressing the value as fluorescence units (f.u.; two‐tailed Student's t‐test, each dot represents an individual slice preparation, n = 4).
- C
Immunofluorescence labeling of active caspase‐3 in developing brain from P8 to P28 in Xkr8 WT and Xkr8 cKO brains was quantified and compared by nested design and mixed model ANOVA (F (2,30) = 0.86, P = 0.433), each dot represents an individual mouse (n = 6 per age group) (images are presented in Fig EV2A and B).
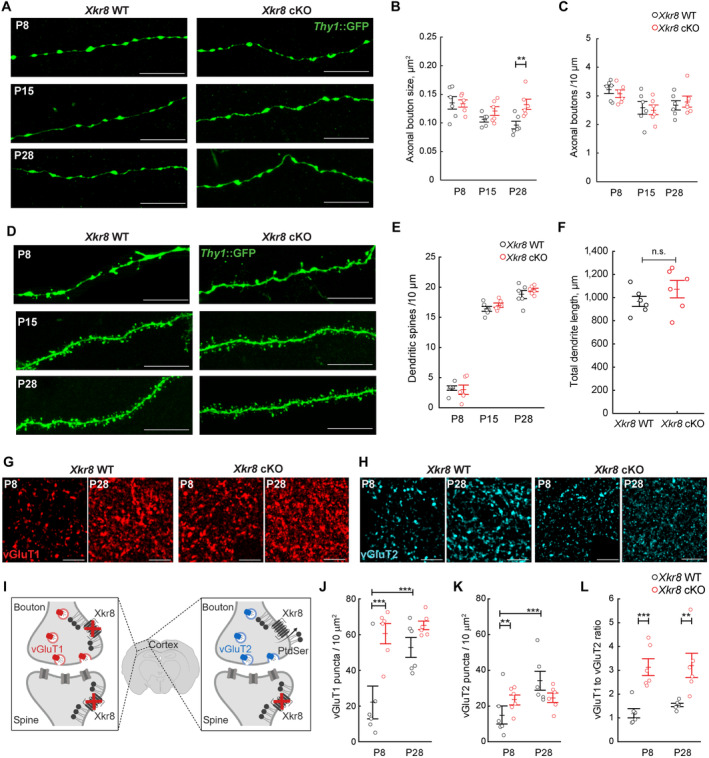
- A–C
The size and density of axonal boutons on Thy1::GFP axons (green) in Xkr8 WT and cKO animals (nested design and mixed model ANOVA, each dot represents an individual mouse, n = 6 per age and genotype group).
- D, E
Dendritic spine morphology (D) and density (E) of Thy1::GFP+ CA1 neurons in Xkr8 WT and cKO animals from P8 to P28 (nested design and mixed model ANOVA, each dot represents an individual mouse, n = 5–6 per age and genotype group).
- F
Total length of dendritic branches of Thy1::GFP+ CA1 neurons in Xkr8 WT and cKO brains (nested design and mixed model ANOVA, each dot represents an individual mouse, n = 6 per genotype group).
- G, H
Immunofluorescence labeling of vGluT1+ and vGluT2+ boutons in L4 somatosensory cortex of Xkr8 WT and cKO brains.
- I
Schematic representation of selective Xkr8 loss in cortical vGluT1+ pre‐ and post‐synaptic neurons, but not thalamocortical vGluT2+ projections in L4 of somatosensory cortex of Xkr8 cKO brains.
- J–L
The density of cortical (vGluT1+, J) and thalamic (vGluT2+, K) and the ratio of vGluT1+ and vGluT2+ inputs (L) in Xkr8 WT and cKO brains (nested design and mixed model ANOVA, each dot represents an individual mouse, n = 6 per age and genotype group).
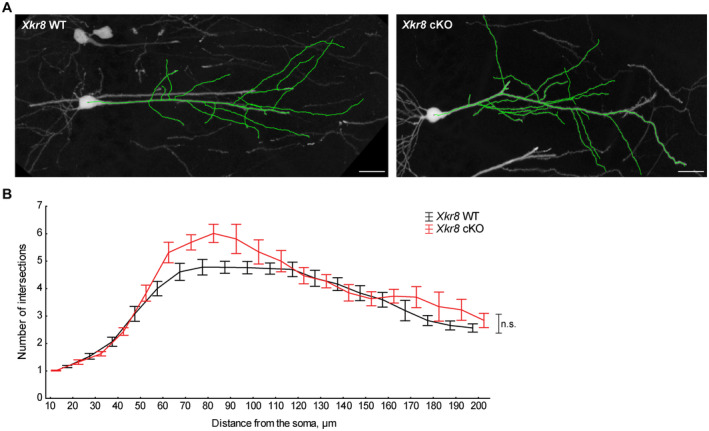
Representative dendritic arbors of Thy1::GFP+ hippocampal CA1 neurons at P28 in Xkr8 WT and cKO brains; scale bar 20 μm.
Dendritic branching patterns of Thy1::GFP+ CA1 neurons in Xkr8 WT and cKO brains were defined by Sholl analysis, which quantifies the number of dendritic branches at predefined distances from the soma (Mann–Whitney test, n = 6 mice per genotype group; mean ± SEM).
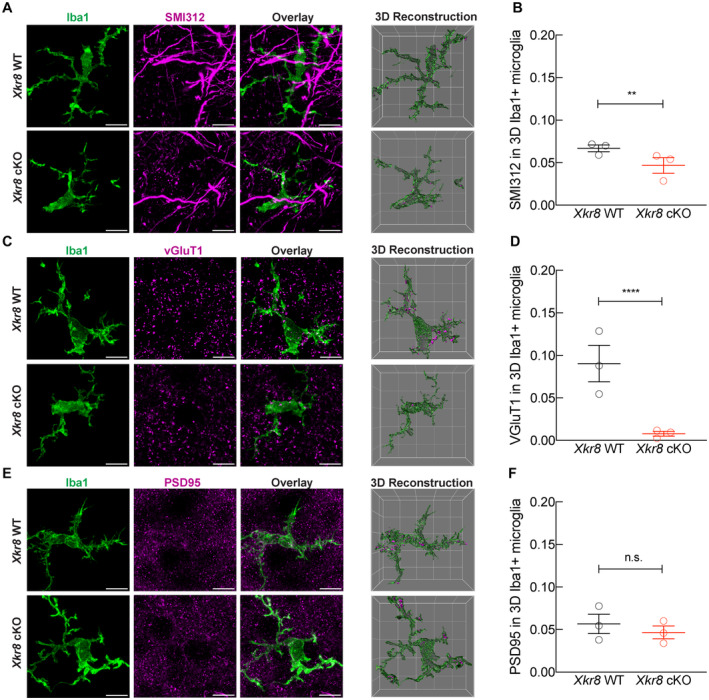
- A–F
The immunolabeling of internalized pan‐axonal material (A, B), pre‐synaptic vGluT1 particles (C, D) and post‐synaptic PSD95 particles (E, F) within Iba1+ microglia in P8 cortex of Xkr8 WT and Xkr8 cKO mice was quantified per individual 3D reconstructed microglial cell. The total volume of internalized particles was normalized to microglial cell volume and compared by nested design and mixed model ANOVA, each dot represents an individual mouse (n = 3 per genotype group). Data presented as mean ± SEM; **P < 0.01, ****P < 0.0001; scale bar 10 μm, grid cell 10 μm.
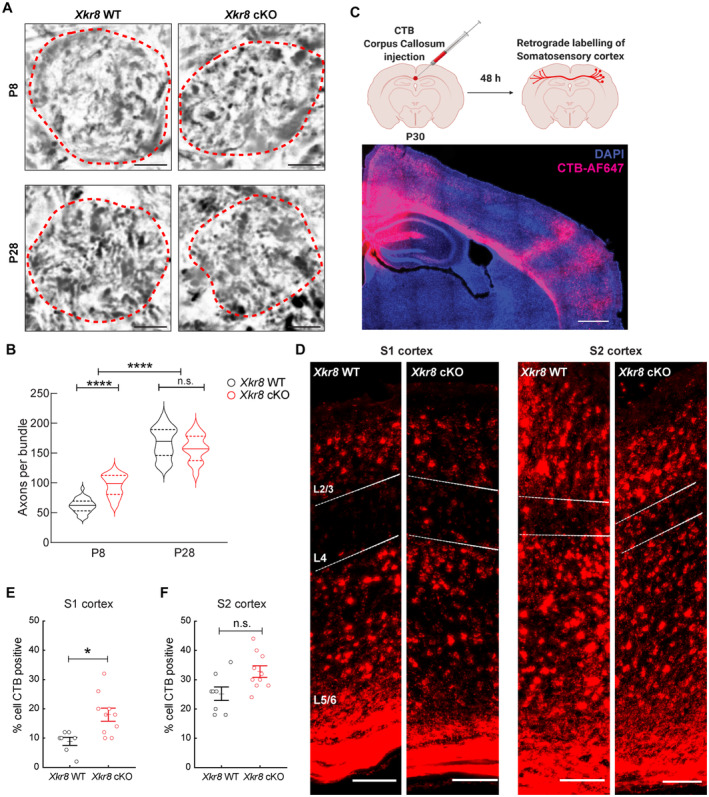
- A, B
Corticospinal axons of the axonal bundles of pyramidal tracts in medulla of P8 and P28 Xkr8 WT and cKO mice were visualized by Palmgren staining and quantified per each bundle, delineated by a dashed line (Mann–Whitney test, n = 6 mice per genotype, the data are presented as median and quartiles).
- C, D
To label callosal projections in vivo, cholera toxin subunit B (CTB) was injected stereotactically into corpus callosum of Xkr8 WT and cKO brains at P30‐32. Back‐labeled neurons were quantified in L4 of primary (S1) and secondary (S2) somatosensory cortex.
- E, F
Xkr8 cKO animals showed significantly more back‐labeled neurons in S1‐L4, but not S2‐L4 indicating aberrant pruning of collosal S1 projections (nested design and mixed model ANOVA, each dot represents an individual mouse, n = 7–10 per genotype group).
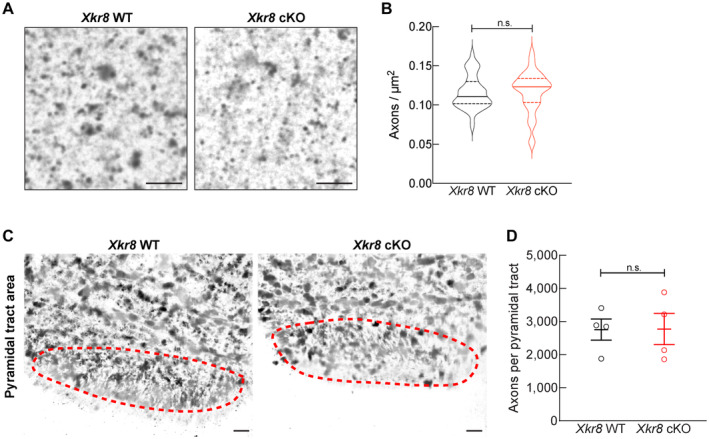
Corticospinal axons of the pyramidal tracts in medulla of P0 Xkr8 WT and cKO mice were visualized by Palmgren staining in high magnification (60×) to quantify axonal density; scale bar 4 μm.
Corticospinal axon density (Mann–Whitney test, n = 4 mice per genotype, the data are presented as median and quartiles).
Corticospinal axons of the pyramidal tracts in medulla of P0 Xkr8 WT and cKO mice were visualized by Palmgren staining in low magnification (20×) to measure pyramidal tract area, delineated by dashed lines; scale bar 20 μm.
Corticospinal axon count per whole pyramidal tract area (two‐tailed Student's t‐test, n = 4 mice per genotype, the data are presented as mean ± SEM).
- A
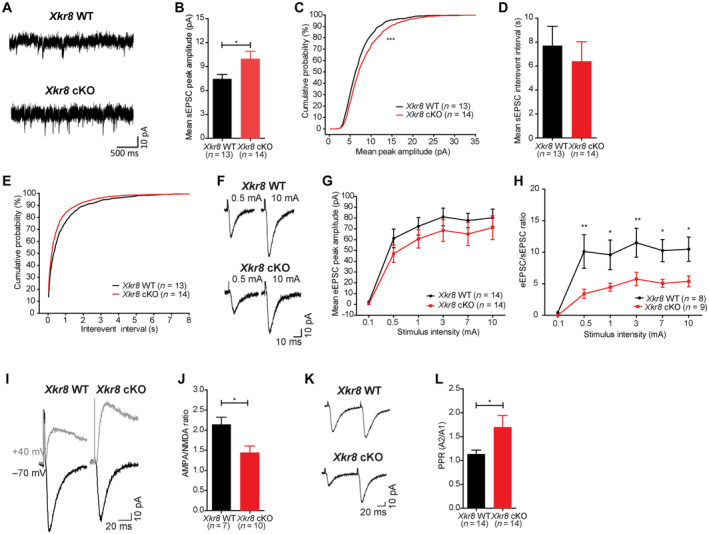
Sample traces of spontaneous excitatory postsynaptic currents (sEPSC) of Xkr8 WT and cKO neurons in acute hippocampal slices.
- B–E
Xkr8 cKO neurons had increased mean sEPSC amplitude (B, C), but no changes in sEPSC frequency (D, E; P = 0.58).
- F–H
Evoked excitatory postsynaptic currents (eEPSC) of Xkr8 cKO neurons showed a trend to decrease (P = 0.08) (F, G) and the ratio of eEPSC and sEPSC amplitudes was lower in Xkr8 knockout neurons (H).
- I–L
Xkr8 cKO neurons had reduced of AMPA/NMDA amplitude ratio (I, J) and increased paired‐pulse ratio (PPR; K, L).
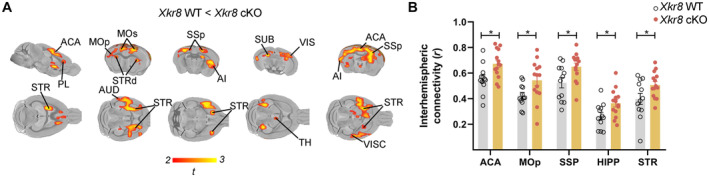
Brain regions with significantly increased functional connectivity in Xkr8 cKO mice compared to Xkr8 WT mice as identified by seed‐based mapping of rsfMRI networks (t‐test, P < 0.05 FWE cluster‐corrected, with cluster‐defining threshold of t 24 > 2.07, P < 0.05; for seed placement see Appendix Fig S5). Colored regions represent the areas of the brain exhibiting increased functional connectivity in Xkr8 cKO compared to Xkr8 WT brains; color scale represents the level of functional correlation; abbreviations specify anatomical designations of identified regions.
Inter‐hemispheric connectivity in representative brain volumes of interest in Xkr8 WT and cKO mice. Regional quantification was performed by computing regional fMRI correlation between the right and left hemisphere. The analysis revealed increased inter‐hemispheric connectivity in Xkr8 cKO brains compared to Xkr8 WT (two‐tailed Student's t‐test, each dot represents an individual mouse, n = 12–14 per genotype; data presented as mean ± SEM, *P < 0.05).
References
-
- Basilico B, Pagani F, Grimaldi A, Cortese B, Di Angelantonio S, Weinhard L, Gross C, Limatola C, Maggi L, Ragozzino D (2019) Microglia shape presynaptic properties at developing glutamatergic synapses. Glia 67: 53–67 - PubMed
-
- Bertero A, Liska A, Pagani M, Parolisi R, Masferrer ME, Gritti M, Pedrazzoli M, Galbusera A, Sarica A, Cerasa A et al (2018) Autism‐associated 16p11.2 microdeletion impairs prefrontal functional connectivity in mouse and human. Brain 141: 2055–2065 - PubMed
-
- Bijsterbosch J, Harrison SJ, Jbabdi S, Woolrich M, Beckmann C, Smith S, Duff EP (2020) Challenges and future directions for representations of functional brain organization. Nat Neurosci 23: 1484–1495 - PubMed
Publication types
MeSH terms
Substances
Grants and funding
LinkOut - more resources
Full Text Sources
Molecular Biology Databases
