

A salt stress-activated GSO1-SOS2-SOS1 module protects the Arabidopsis root stem cell niche by enhancing sodium ion extrusion
- PMID: 37211994
- PMCID: PMC10308370
- DOI: 10.15252/embj.2022113004
A salt stress-activated GSO1-SOS2-SOS1 module protects the Arabidopsis root stem cell niche by enhancing sodium ion extrusion
Abstract
Soil salinity impairs plant growth reducing crop productivity. Toxic accumulation of sodium ions is counteracted by the Salt Overly Sensitive (SOS) pathway for Na+ extrusion, comprising the Na+ transporter SOS1, the kinase SOS2, and SOS3 as one of several Calcineurin-B-like (CBL) Ca2 + sensors. Here, we report that the receptor-like kinase GSO1/SGN3 activates SOS2, independently of SOS3 binding, by physical interaction and phosphorylation at Thr16. Loss of GSO1 function renders plants salt sensitive and GSO1 is both sufficient and required for activating the SOS2-SOS1 module in yeast and in planta. Salt stress causes the accumulation of GSO1 in two specific and spatially defined areas of the root tip: in the endodermis section undergoing Casparian strip (CS) formation, where it reinforces the CIF-GSO1-SGN1 axis for CS barrier formation; and in the meristem, where it creates the GSO1-SOS2-SOS1 axis for Na+ detoxification. Thus, GSO1 simultaneously prevents Na+ both from diffusing into the vasculature, and from poisoning unprotected stem cells in the meristem. By protecting the meristem, receptor-like kinase-conferred activation of the SOS2-SOS1 module allows root growth to be maintained in adverse environments.
Keywords: Arabidopsis; SOS pathway; meristem; receptor-like kinase; salt stress.
© 2023 The Authors. Published under the terms of the CC BY NC ND 4.0 license.
Conflict of interest statement
The authors declare that they have no conflict of interest.
Figures
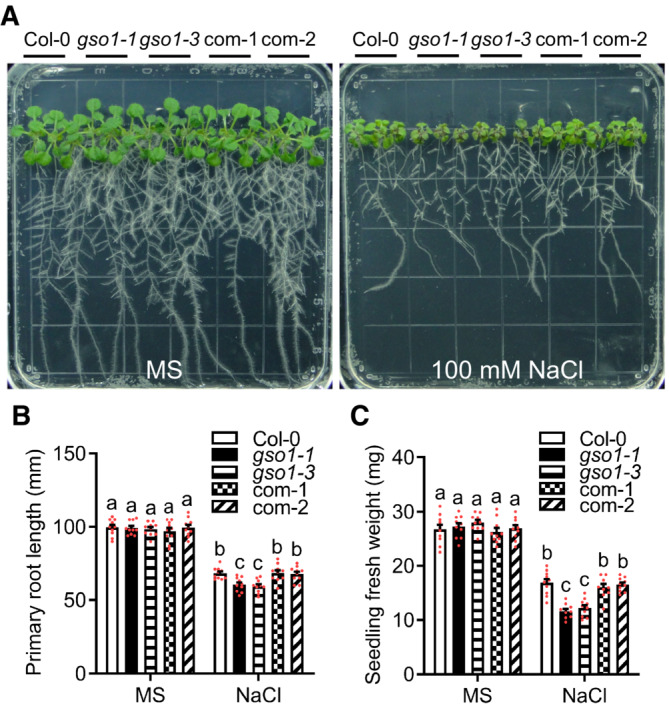
- A
Phenotypes of WT (Col‐0), two gso1 mutant alleles (gso1‐1, gso1‐3) and two independent complementation lines (com‐1, com‐2). Seedlings were grown on 1/2 MS for 6 days and then transferred to 1/2 MS medium supplemented with or without 100 mM NaCl for 10 days.
- B, C
Primary root length and seedling fresh weight of seedlings depicted in (A) were measured at day 10 after transfer (mean ± SEM, n = 10, P < 0.05, two‐way ANOVA).
- A–C
Phenotypes of indicated plant lines. Seedlings were grown on 1/2 MS medium for 6 days and then transferred to 1/2 MS medium with 100 mM NaCl for 7 days. Primary root length (B) and seedling fresh weight (C) of seedlings depicted in (A) were measured at day 7 after transfer (mean ± SEM, n = 10, P < 0.05, two‐way ANOVA).
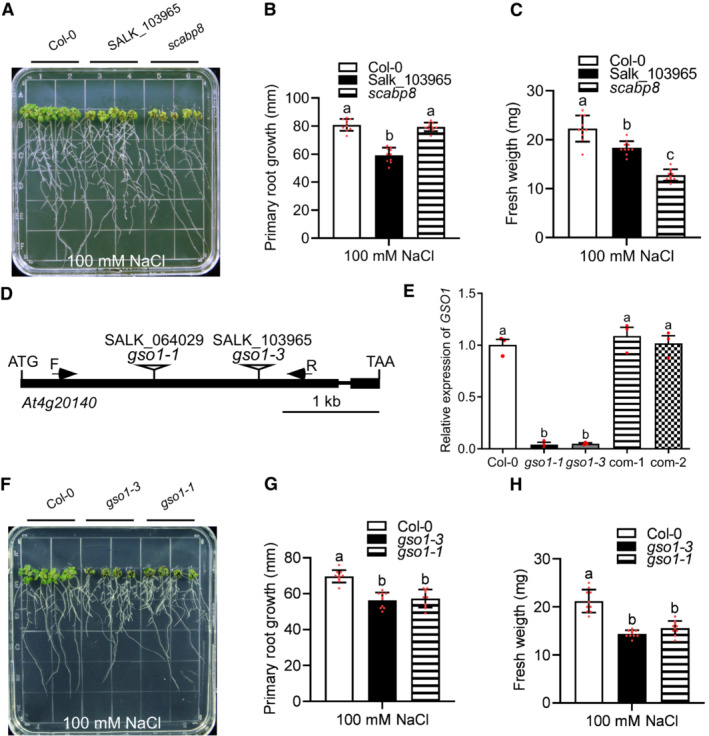
- D
Gene structure of At4g20140 (GSO1) (closed box: exon; line: intron; triangle, T‐DNA insertion site for indicated SALK lines).
- E
qRT‐PCR analyses of GSO1 expression in WT (Col‐0), two gso1 mutants and two independent complemented lines (com‐1, com‐2). UBQ10 was used as reference.
- F–H
Phenotypes of WT (Col‐0) and gso1 mutants. Seedlings were grown on 1/2 MS medium for 6 days and then transferred to 1/2 MS medium supplemented with 100 mM NaCl for 10 days. Primary root length (G) and seedling fresh weight (H) of seedlings depicted in (F) were measured at day 10 after transfer (mean ± SEM, n = 10, P < 0.05, one‐way ANOVA).
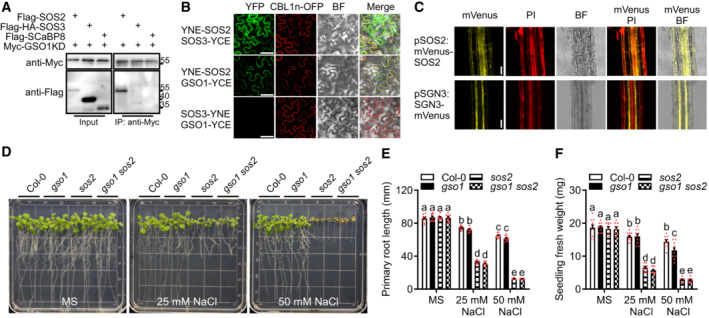
- A
Co‐IP of GSO1 and SOS2 using Arabidopsis protoplasts transiently expressing Myc‐GSO1KD (GSO1 kinase domain) and Flag‐SOS2, Flag‐HA‐SOS3 or Flag‐SCaBP8. Protein extracts were immunoprecipitated with anti‐Myc antibody and immunoblotted with anti‐Myc antibody or anti‐Flag antibody.
- B
BiFC analyses involving GSO1, SOS2, SOS3 in N. benthamiana. Scale bars: 50 μm. BiFC analyses of YNE‐SOS2 with SOS3‐YCE or GSO1‐YCE in N. benthamiana leaves. SOS3‐YNE co‐expressed with GSO1‐YCE as negative control. CBL1n‐OFP was co‐expressed as plasma membrane maker. Scale bars: 50 μm (BF: brightfield).
- C
High resolution localization analyses of SOS2 and GSO1 expressed under their respective native promoter at 1.5 mm from the quiescent center. Propidium iodide (PI) was used to stain the cell wall. Scale bars: 100 μm (BF: brightfield).
- D
Phenotypes of WT (Col‐0), gso1‐3, sos2‐2 and gso1‐3 sos2‐2. Seedlings were grown on 1/2 MS medium for 6 days and then transferred to 1/2 MS supplemented with or without extra NaCl for 10 days.
- E, F
Primary root length and fresh weight of seedlings depicted in (D) were measured at day 7 after transfer (mean ± SEM, n = 10, P < 0.05, two‐way ANOVA).
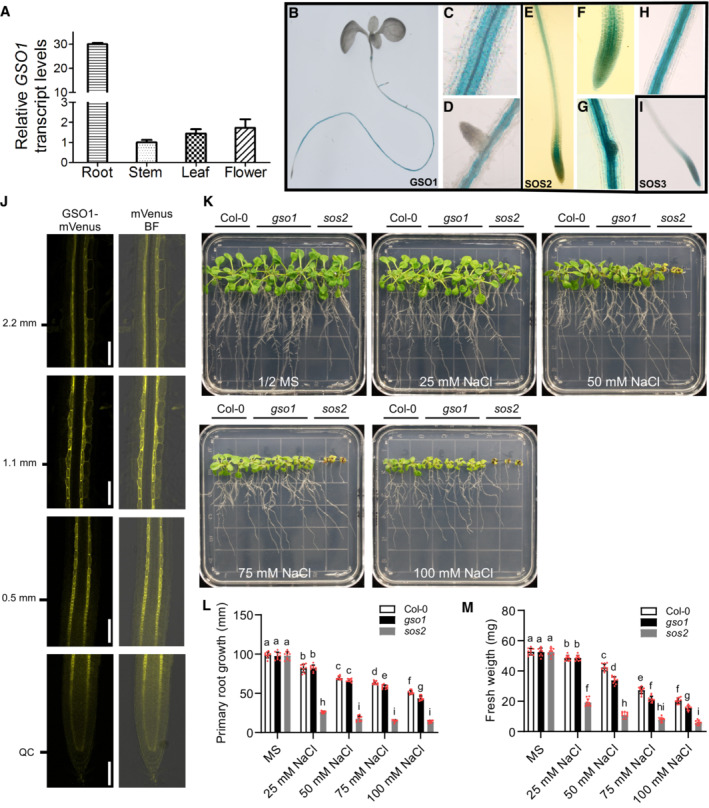
- A
qRT‐PCR analyses of GSO1 expression. Total RNA was extracted from roots, stems, leaves, and flowers. Actin2 was used as reference.
- B–D
GUS activity under the promoter of GSO1 indicated by blue color.
- E–H
pSOS2‐driven GUS activity.
- I
pSOS3‐driven GUS activity.
- J
Localization analyses of GSO1‐mVenus in the root. ClearSee treatment was used to improve the detection. Scale bars: 100 μm.
- K–M
Phenotypes of WT (Col‐0), gso1‐3 and sos2‐2. Seedlings were grown on 1/2 MS medium for 6 days and then transferred to 1/2 MS medium supplemented with or without the indicated concentrations of NaCl for 10 days. Primary root length (L) and seedling fresh weight (M) were measured at day 10 after transfer (mean ± SEM, n = 10, P < 0.05, two‐way ANOVA).
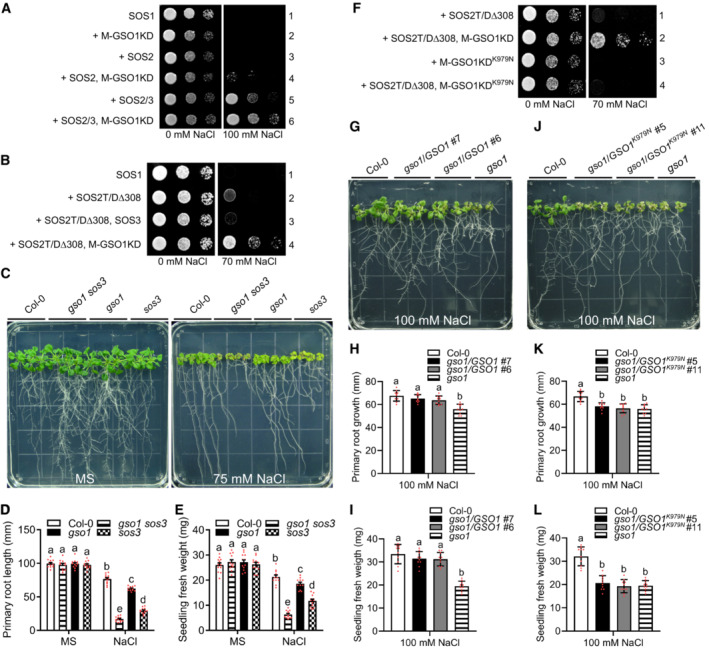
- A
Yeast strain JP837 cells transformed with empty vectors (control) or the indicated combinations of Arabidopsis genes were grown on AP medium supplemented with or without 100 mM NaCl for 3 days at 28°C (M: myristoylation motif, KD: kinase domain).
- B
Yeast strain JP837 cells transformed with the indicated combinations of genes were grown on AP medium supplemented with or without 75 mM NaCl for 4 days at 28°C (SOS2T/DΔ308: constitutively active form SOS2, M: myristoylation motif, KD: kinase domain).
- C
Phenotypes of WT (Col‐0), gso1‐3, sos3 and gso1‐3 sos3 grown on 1/2 MS medium for 6 days and then transferred to 1/2 MS medium supplemented with or without 75 mM NaCl for 10 days.
- D, E
Primary root length and fresh weight of seedlings depicted in (C) were measured at day 10 after transfer (mean ± SEM, n = 12, P < 0.05, two‐way ANOVA).
- F
Yeast strain JP837 cells expressing SOS2T/DΔ308 were transformed with M‐GSO1KD or M‐GSO1KDK979N and grown on AP medium as in (B).
- G–L
Phenotypes, primary root length and seedling fresh weight of indicated plant lines grown on 1/2 MS medium for 6 days and then transferred to 1/2 MS medium supplemented with 100 mM NaCl for 7 days (mean ± SEM, n = 10, P < 0.05, one‐way ANOVA).
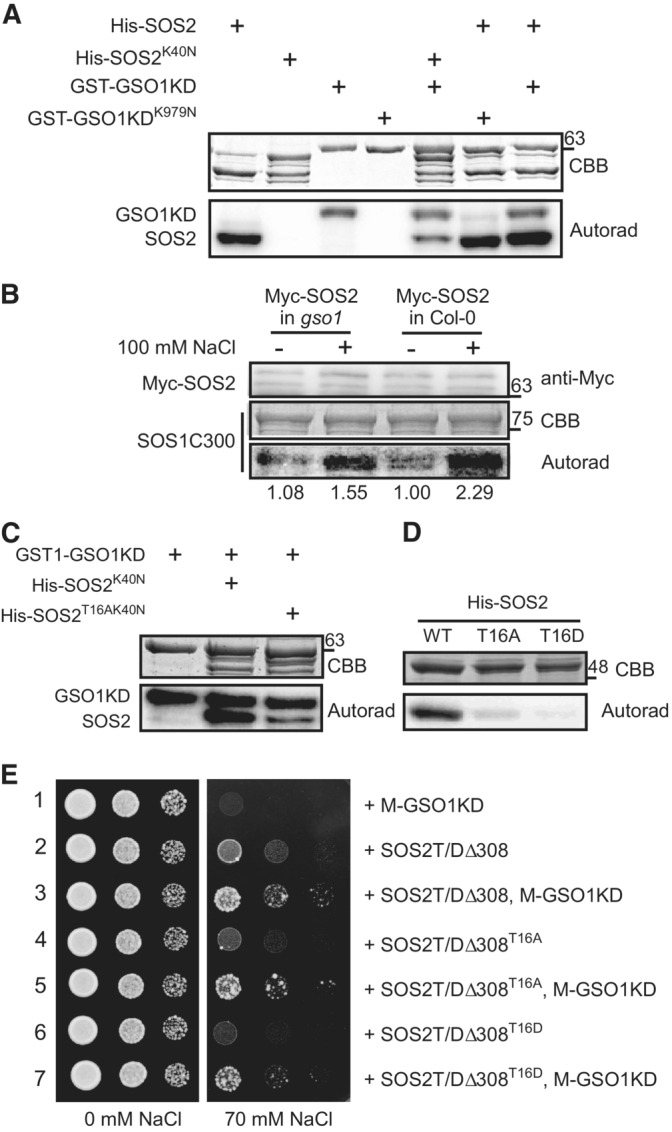
Coomassie Brilliant Blue stain (CBB) and autoradiograph of in vitro kinase assay combining the indicated combinations of SOS2/SOS2K40N and GSO1KD/GSO1KDK979N.
Immunoblot using anti‐Myc antibody and CBB and autoradiograph from kinase assays combining Myc‐SOS2 with SOS1C300 as substrate. Ten‐day‐old seedlings stably expressing Pro35S:6Myc‐SOS2 in Col‐0 or gso1‐3 were treated with or without 100 mM NaCl for 12 h, and Myc‐SOS2 protein immunoprecipitated with anti‐C‐Myc antibody‐conjugated agarose from roots was used in the assays. Signal strength of the phosphorylation bands has been calculated relative to the left lane.
CBB and autoradiograph of in vitro kinase assays combining GSO1KD (kinase domain) with SOS2K40N or SOS2T16AK40N.
CBB and autoradiograph of in vitro kinase assays using SOS2 p‐site variants addressing autophosphorylation activity.
Yeast strain JP837 cells expressing SOS1 plus the indicated combinations of genes were grown on AP medium supplemented with or without 70 mM NaCl for 4 days at 28°C (SOS2T/DΔ308: constitutively active form SOS2, M: myristoylation motif, KD: kinase domain).
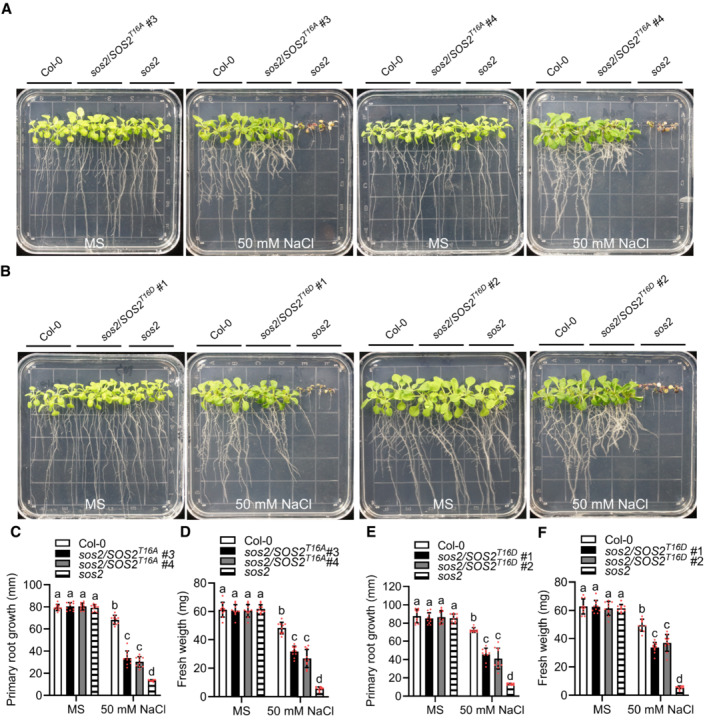
- A–F
Phenotypes of Col‐0, sos2‐2, SOS2T16A #3 and SOS2T16A #4 (A), SOS2T16D #1 and SOS2T16D #2 (B). Seedlings were grown on 1/2 MS medium for 6 days and then transferred to 1/2 MS medium with or without 50 mM NaCl for 10 days. Primary root length (C and E) and seedling fresh weight (D and F) of seedlings at day 10 after transfer (mean ± SEM, n = 10, P < 0.05, two‐way ANOVA).
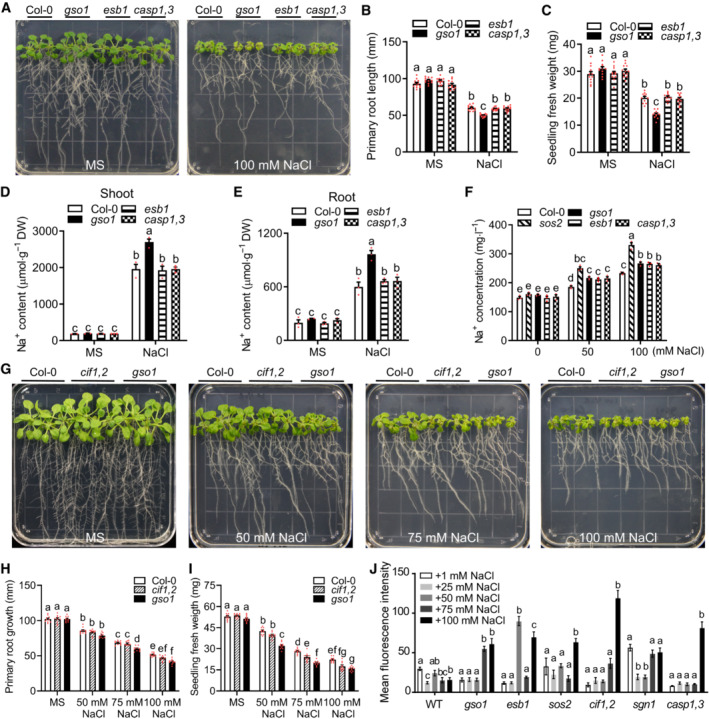
- A
Phenotypes of WT (Col‐0), gso1‐3, esb1, and casp1 casp3. Seedlings were grown on 1/2 MS for 6 days and then transferred to 1/2 MS medium with or without 100 mM NaCl for 10 days.
- B, C
Primary root length and seedling fresh weight of seedlings depicted in (A) were measured at day 10 after transfer (mean ± SEM, n = 12, two‐way ANOVA, P < 0.05).
- D, E
Na+ content in roots and shoots of the indicated genotypes. Seedlings were grown on 1/2 MS medium for 6 days and then transferred to 1/2 MS medium with or without 100 mM NaCl for 8 days (DW: dry weight, mean ± SEM, n = 3, P < 0.05, two‐way ANOVA).
- F
Na+ content of xylem sap of indicated genotypes. Seedlings were grown in soil for 2 weeks and then treated with 1/2 MS medium or 1/2 MS medium supplemented with NaCl for 1 day (mean ± SEM, n = 3, P < 0.05, two‐way ANOVA).
- G
Phenotypes of WT (Col‐0), cif1 cif2, and gso1‐3. Seedlings were grown on 1/2 MS medium for 6 days and then transferred to 1/2 MS medium supplemented with or without 100 mM NaCl for 10 days.
- H, I
Primary root length and seedling fresh weight of seedlings depicted in (A) were measured at day 10 after transfer (mean ± SEM, n = 10, P < 0.05, two‐way ANOVA).
- J
Quantification of Fluorol Yellow fluorescence intensity indicating amounts of suberin accumulation in maximum projections of z‐stacks in the first mm of the continuously suberized endodermis in the indicated genotypes. Seedlings were grown on 1/2 MS for 5 days and then treated with the indicated NaCl concentrations for 2 days (mean ± SEM, n = 3–5, P < 0.05, one‐way ANOVA and post hoc Tukey Kramer test, different letters indicate significant difference).
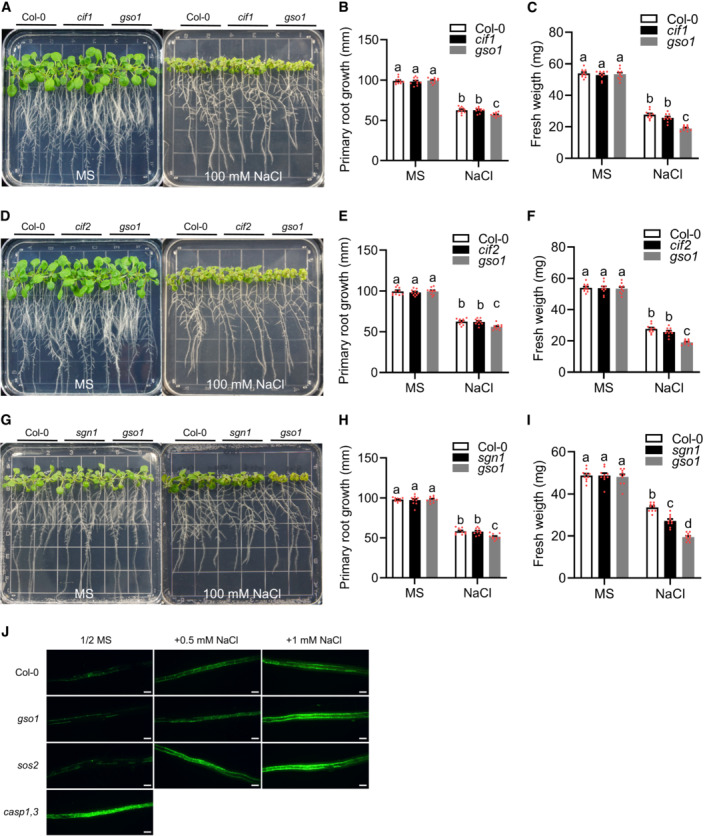
- A–I
Phenotypes of WT (Col‐0), gso1‐3, cif1 (A), cif2 (D), and sgn1 (G). Seedings were grown on 1/2 MS medium for 6 days and then transferred to 1/2 MS medium supplemented with or without 100 mM NaCl for 10 days. Primary root length (B, E and H) and seedling fresh weight (C, F, and I) of seedlings depicted in (A) at day 10 after transfer (mean ± SEM, n = 10, P < 0.05, two‐way ANOVA).
- J
Fluorol yellow staining of suberin in roots. WT (Col‐0), gso1‐3, sos2‐2 and casp1 casp3 were grown on 1/2 MS medium with or without NaCl for 5 days and the suberin amount in the DZ was analyzed. Scale bars: 50 μm.
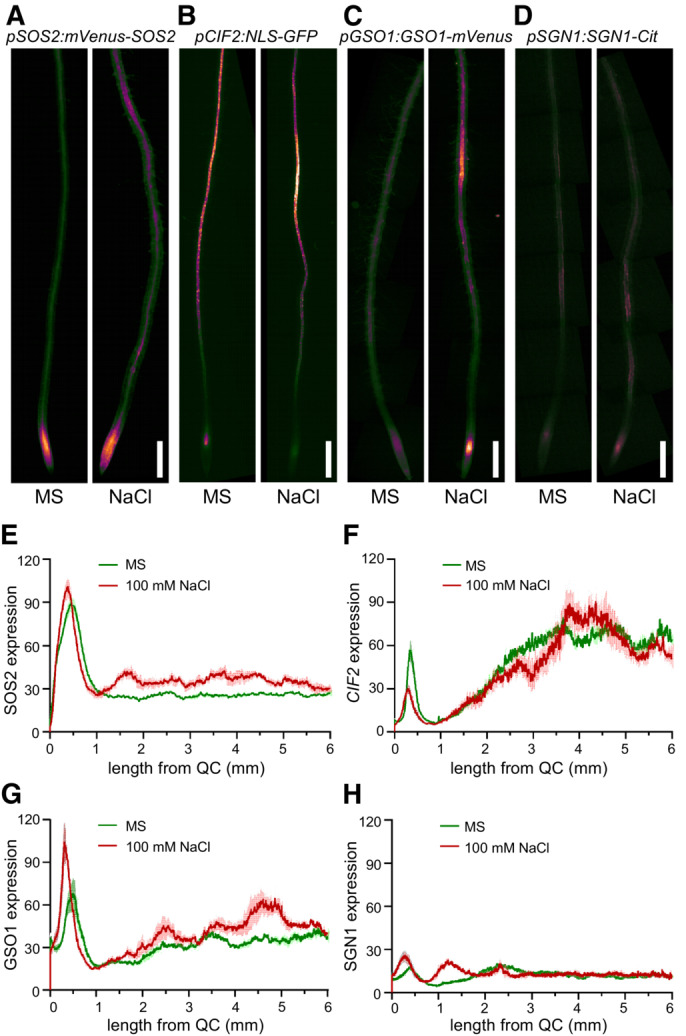
- A–D
Protein accumulation (A, C, D) or gene expression (B) of SOS2, CIF2, GSO1, and SGN1 displayed as false color fluorescence intensity. Seedlings from the indicated plant lines were grown on 1/2 MS for 4–5 days and then transferred to 1/2 MS with or without 100 mM NaCl for 1 day. Scale bars: 200 μm.
- E–H
Longitudinal quantification of protein accumulation or gene expression depicted in (A–D) represented as 8‐bit fluorescence intensity (Mean ± SEM, n = 4–5).
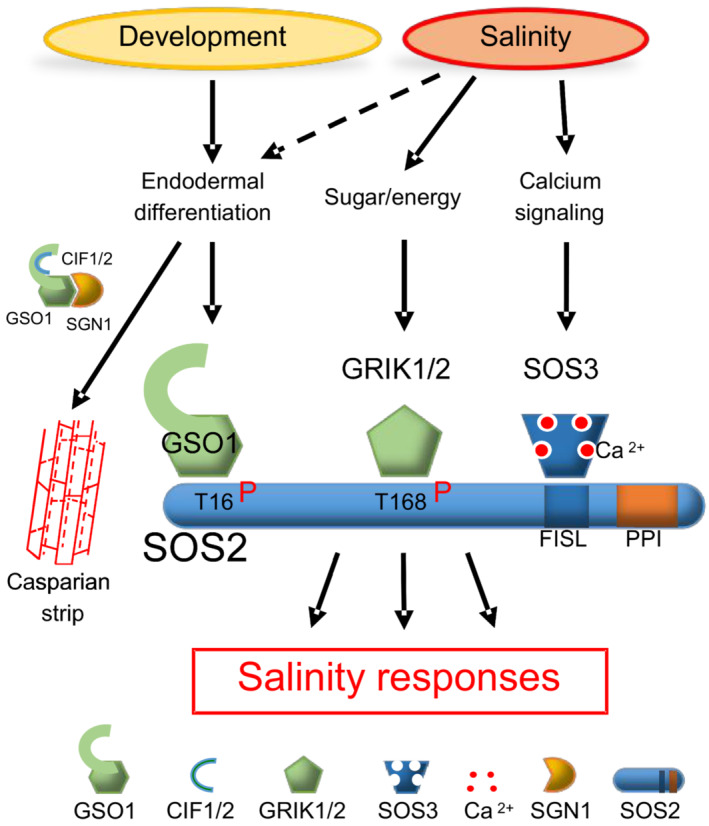
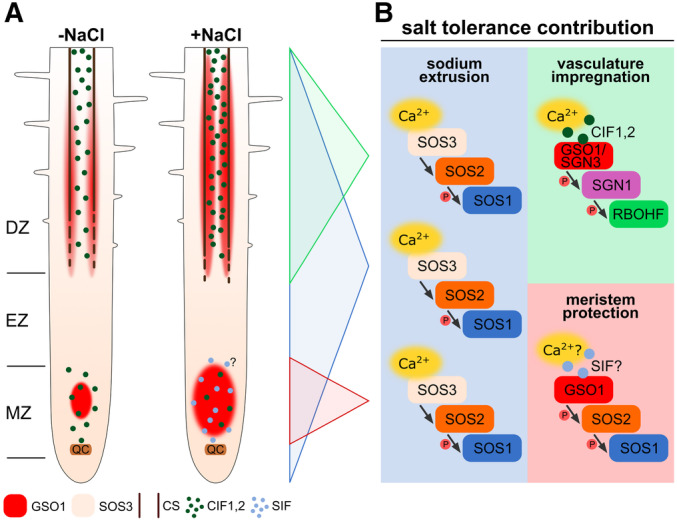
Organ‐scale model. Interrupted lines indicate CS formation, continuous lines indicate a closed functional CS. Protein accumulation of GSO1 and SOS3 is represented by color intensity (QC: quiescent center, MZ: meristematic zone, EZ: elongation zone, DZ: differentiation zone, SIF: Salt‐Induced Factor).
Molecular model.
Similar articles
-
The protein kinase complex CBL10-CIPK8-SOS1 functions in Arabidopsis to regulate salt tolerance.J Exp Bot. 2020 Mar 25;71(6):1801-1814. doi: 10.1093/jxb/erz549. J Exp Bot. 2020. PMID: 31858132 Free PMC article.
-
Transgenic evaluation of activated mutant alleles of SOS2 reveals a critical requirement for its kinase activity and C-terminal regulatory domain for salt tolerance in Arabidopsis thaliana.Plant Cell. 2004 Feb;16(2):435-49. doi: 10.1105/tpc.019174. Epub 2004 Jan 23. Plant Cell. 2004. PMID: 14742879 Free PMC article.
-
A Ca2+-sensor switch for tolerance to elevated salt stress in Arabidopsis.Dev Cell. 2022 Sep 12;57(17):2081-2094.e7. doi: 10.1016/j.devcel.2022.08.001. Epub 2022 Aug 24. Dev Cell. 2022. PMID: 36007523
-
Ion homeostasis during salt stress in plants.Curr Opin Cell Biol. 2001 Aug;13(4):399-404. doi: 10.1016/s0955-0674(00)00227-1. Curr Opin Cell Biol. 2001. PMID: 11454443 Review.
-
A Salt Overly Sensitive Pathway Member from Brassica juncea BjSOS3 Can Functionally Complement ΔAtsos3 in Arabidopsis.Curr Genomics. 2018 Jan;19(1):60-69. doi: 10.2174/1389202918666170228133621. Curr Genomics. 2018. PMID: 29491733 Free PMC article. Review.
Cited by
-
Uncovering the genomic basis of phenological traits in Chouardia litardierei (Asparagaceae) through a genome-wide association study (GWAS).Front Plant Sci. 2025 Apr 17;16:1571608. doi: 10.3389/fpls.2025.1571608. eCollection 2025. Front Plant Sci. 2025. PMID: 40365558 Free PMC article.
-
Maintenance of stem cell activity in plant development and stress responses.Front Plant Sci. 2023 Dec 12;14:1302046. doi: 10.3389/fpls.2023.1302046. eCollection 2023. Front Plant Sci. 2023. PMID: 38155857 Free PMC article. Review.
-
Relative effects of melatonin and hydrogen sulfide treatments in mitigating salt damage in wheat.Front Plant Sci. 2024 Jul 25;15:1406092. doi: 10.3389/fpls.2024.1406092. eCollection 2024. Front Plant Sci. 2024. PMID: 39119490 Free PMC article.
-
Genome-Wide Identification of the CIF Gene Family and Protein Interaction with GSO1s Under the p-HBA-Induced Continuous Cropping Obstacle in Pogostemon cablin.Int J Mol Sci. 2025 Feb 13;26(4):1568. doi: 10.3390/ijms26041568. Int J Mol Sci. 2025. PMID: 40004033 Free PMC article.
-
SOS2 phosphorylates FREE1 to regulate multi-vesicular body trafficking and vacuolar dynamics under salt stress.Plant Cell. 2025 Mar 5;37(3):koaf012. doi: 10.1093/plcell/koaf012. Plant Cell. 2025. PMID: 39792473
References
-
- Alassimone J, Fujita S, Doblas VG, Van Dop M, Barberon M, Kalmbach L, Vermeer JEM, Rojas‐Murcia N, Santuari L, Hardtke CS et al (2016) Polarly localized kinase SGN1 is required for Casparian strip integrity and positioning. Nat Plants 2: 1–10 - PubMed
-
- Barberon M (2017) The endodermis as a checkpoint for nutrients. New Phytol 213: 1604–1610 - PubMed
-
- Barberon M, Vermeer JEM, De Bellis D, Wang P, Naseer S, Andersen TG, Humbel BM, Nawrath C, Takano J, Salt DE et al (2016) Adaptation of root function by nutrient‐induced plasticity of endodermal differentiation. Cell 164: 447–459 - PubMed
Publication types
MeSH terms
Substances
LinkOut - more resources
Full Text Sources
Molecular Biology Databases
Miscellaneous
