

mTORC1 activity negatively regulates human hair follicle growth and pigmentation
- PMID: 37212043
- PMCID: PMC10328083
- DOI: 10.15252/embr.202256574
mTORC1 activity negatively regulates human hair follicle growth and pigmentation
Abstract
Dysregulation of the activity of the mechanistic target of rapamycin complex 1 (mTORC1) is commonly linked to aging, cancer, and genetic disorders such as tuberous sclerosis (TS), a rare neurodevelopmental multisystemic disease characterized by benign tumors, seizures, and intellectual disability. Although patches of white hair on the scalp (poliosis) are considered as early signs of TS, the underlying molecular mechanisms and potential involvement of mTORC1 in hair depigmentation remain unclear. Here, we have used healthy, organ-cultured human scalp hair follicles (HFs) to interrogate the role of mTORC1 in a prototypic human (mini-)organ. Gray/white HFs exhibit high mTORC1 activity, while mTORC1 inhibition by rapamycin stimulated HF growth and pigmentation, even in gray/white HFs that still contained some surviving melanocytes. Mechanistically, this occurred via increased intrafollicular production of the melanotropic hormone, α-MSH. In contrast, knockdown of intrafollicular TSC2, a negative regulator of mTORC1, significantly reduced HF pigmentation. Our findings introduce mTORC1 activity as an important negative regulator of human HF growth and pigmentation and suggest that pharmacological mTORC1 inhibition could become a novel strategy in the management of hair loss and depigmentation disorders.
Keywords: alpha-MSH/MC1R; mTORC1; melanocyte; rapamycin; tuberous sclerosis.
© 2023 The Authors. Published under the terms of the CC BY 4.0 license.
Conflict of interest statement
The authors declare that they have no conflict of interest. For the record, RP and JC and JG were or are employees of Monasterium Laboratory, a skin & hair research CRO (
Figures
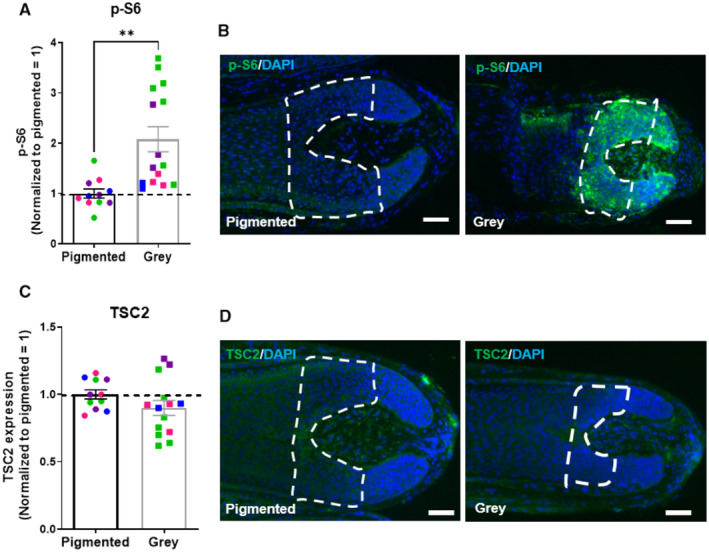
Quantitative analysis of phosphorylated S6 (p‐S6; mTORC1 activity read‐out) immunoreactivity. N = 11–15 pigmented or gray HFs from four different donors.
Representative images of p‐S6 immunofluorescence.
Quantitative analysis of TSC2 protein levels. N = 11–14 pigmented or gray HFs from four different donors.
Representative images of TSC2 immunofluorescence.
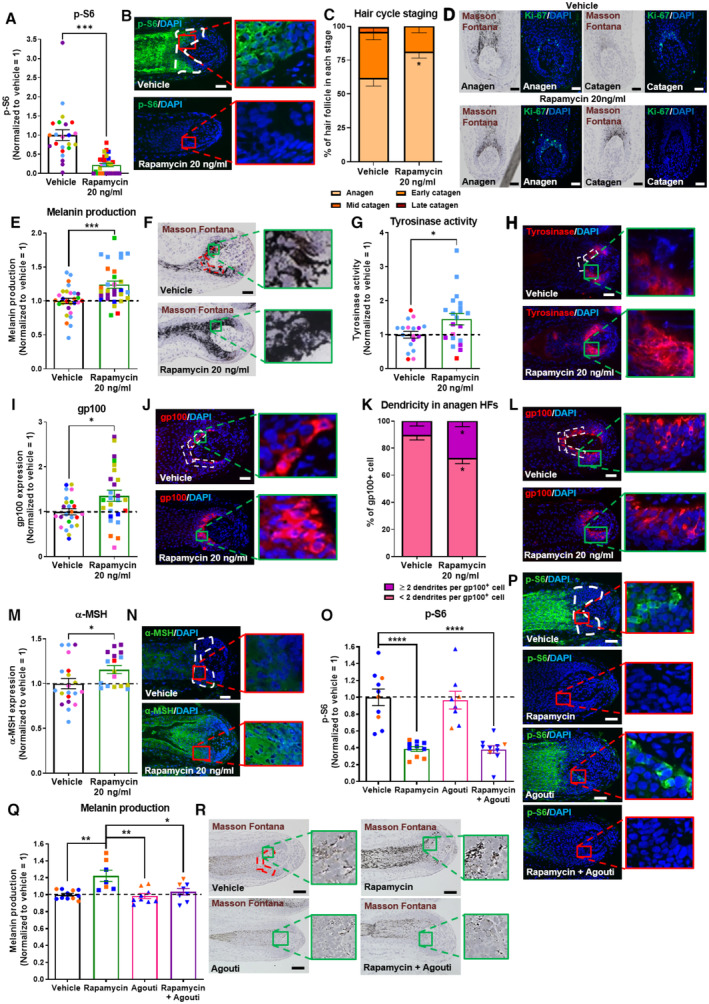
Quantitative analysis of phosphorylated S6 (p‐S6; mTORC1 activity read‐out) immunoreactivity. N = 23–30 anagen VI HFs from eight different donors treated with Rapamycin 20 ng/ml or untreated (vehicle) for 7 days.
Representative images of p‐S6 immunofluorescence.
Hair cycle staging was performed using Ki‐67 and Masson–Fontana histochemistry (Kloepper et al, 2010). Mean ± SEM; N = 36–39 HFs per group from six different donors treated with Rapamycin 20 ng/ml or vehicle (control) for 7 days.
Representative fluorescence images of Ki‐67 and bright‐field microscopic images of Masson–Fontana.
Quantitative histomorphometry of melanin production by Masson–Fontana histochemistry. N = 28–30 anagen VI HFs from eight different donors treated with Rapamycin 20 ng/ml or untreated (vehicle) for 7 days.
Representative bright‐field microscopic images of Masson–Fontana histochemistry.
Quantitative analysis of tyrosinase activity. N = 18–21 anagen VI HFs from five different donors treated with Rapamycin 20 ng/ml or untreated (vehicle) for 7 days.
Representative images of tyrosinase activity immunofluorescence.
Quantitative analysis of gp100 expression. N = 24–26 anagen VI HFs from eight different donors treated with Rapamycin 20 ng/ml or untreated (vehicle) for 7 days.
Representative images of gp100 immunofluorescence.
Quantitative analysis of melanocyte dendricity. N = 22–24 anagen VI HFs from six different donors treated with Rapamycin 20 ng/ml or untreated (vehicle) for 7 days.
Representative images of gp100 immunofluorescence.
Quantitative analysis of α‐MSH expression. N = 17–20 anagen VI HFs from five different donors treated with Rapamycin 20 ng/ml or untreated (vehicle) for 7 days.
Representative images of α‐MSH immunofluorescence.
Quantitative analysis of phosphorylated S6 (p‐S6; mTORC1 activity read‐out) immunoreactivity. N = 8–10 anagen VI HFs from two different donors treated with Rapamycin 20 ng/ml, 2 μg/ml Agouti, Rapamycin + Agouti or untreated (vehicle) for 7 days.
Representative images of p‐S6 immunofluorescence.
Quantitative histomorphometry of melanin production by Masson–Fontana histochemistry. N = 8–11 anagen VI HFs from two different donors treated with Rapamycin 20 ng/ml, 2 μg/ml Agouti, Rapamycin + Agouti or untreated (vehicle) for 7 days.
Representative bright‐field microscopic images of Masson–Fontana histochemistry.
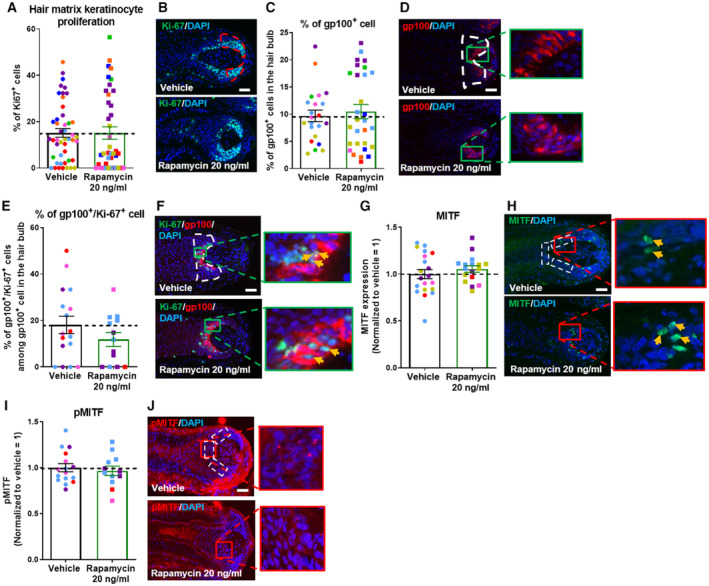
Quantitative analysis of Ki‐67+ cell number. N = 40–48 anagen VI HFs from eight different donors treated with Rapamycin 20 ng/ml or untreated (vehicle) for 7 days.
Representative images of Ki‐67 immunofluorescence.
Quantitative immunohistomorphometry of the number of gp100+ cells. N = 22–29 anagen VI HFs from eight different donors treated with Rapamycin 20 ng/ml or untreated (vehicle) for 7 days.
Representative images of gp100 immunofluorescence.
Quantitative analysis of gp100+/Ki‐67+ cell number. N = 13–17 anagen VI HFs from four different donors treated with Rapamycin 20 ng/ml or untreated (vehicle) for 7 days.
Representative images of gp100/Ki‐67 immunofluorescence. Yellow arrows indicate gp100+/Ki‐67+ cells.
Quantitative analysis of MITF expression. N = 17–20 anagen VI HFs from five different donors treated with Rapamycin 20 ng/ml or untreated (vehicle) for 7 days.
Representative images of MITF immunofluorescence. Yellow arrows indicate MITF+ cells.
Quantitative analysis of MITF phosphorylation (pMITF). N = 12–16 anagen VI HFs from four different donors treated with Rapamycin 20 ng/ml or untreated (vehicle) for 7 days.
Representative images of pMITF immunofluorescence.
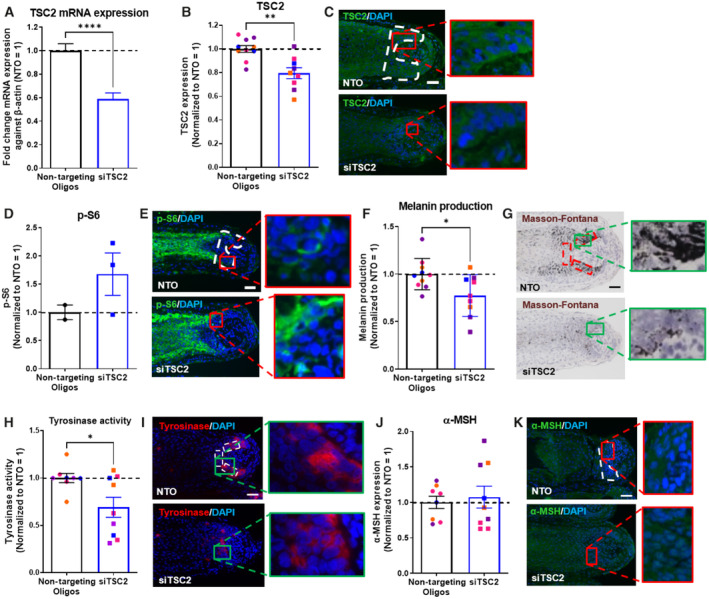
- A, B
Quantitative analysis of TSC2 mRNA (A) and protein expression (B). N = 8–10 anagen VI HFs from four different donors treated with siTSC2 or nontargeting oligos (NTO) for 6 days.
- C
Representative images of TSC2 immunofluorescence.
- D
Quantitative analysis of phosphorylated S6 (p‐S6; mTORC1 activity read‐out) immunoreactivity. N = 2–3 anagen VI HFs from one donor treated with siTSC2 or nontargeting oligos for 6 days.
- E
Representative images of p‐S6 immunofluorescence.
- F
Quantitative histomorphometry of melanin production. N = 9–10 anagen VI HFs from four different donors treated with siTSC2 or nontargeting oligos for 6 days.
- G
Representative bright‐field microscopic images of Masson–Fontana histochemistry.
- H
Quantitative analysis of tyrosinase activity. N = 8–9 anagen VI HFs from four different donors treated with siTSC2 or nontargeting oligos for 6 days.
- I
Representative images of tyrosinase activity immunofluorescence.
- J
Quantitative analysis of α‐MSH expression. N = 8–9 anagen VI HFs from four different donors treated with siTSC2 or nontargeting oligos for 6 days.
- K
Representative images of α‐MSH immunofluorescence.
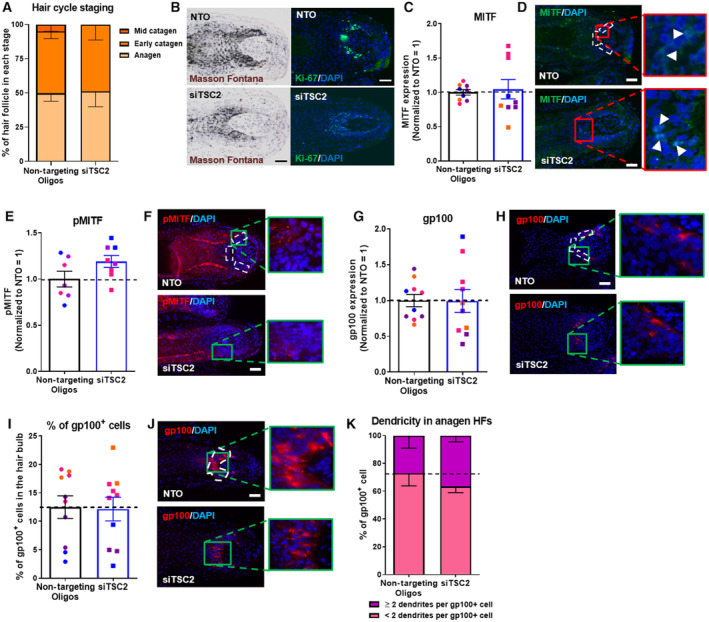
Hair cycle staging was performed using Ki‐67 and Masson–Fontana histochemistry. Mean ± SEM; N = 21–22 HFs per group from four different donors treated with siTSC2 or nontargeting oligos for 6 days; Unpaired Student's t‐test.
Representative fluorescence images of Ki‐67 and bright‐field microscopic images of Masson–Fontana.
Quantitative analysis of MITF expression. N = 9 anagen VI HFs from four different donors treated with siTSC2 or nontargeting oligos (NTO) for 6 days.
Representative images of MITF immunofluorescence. White arrows show MITF+ cells.
Quantitative analysis of MITF phosphorylation (pMITF). N = 8 anagen VI HFs from four different donors treated with siTSC2 or nontargeting oligos for 6 days.
Representative images of pMITF immunofluorescence.
Quantitative analysis of gp100 expression. N = 10 anagen VI HFs from four different donors treated with siTSC2 or nontargeting oligos for 6 days.
Representative images of gp100 immunofluorescence.
Quantitative analysis of gp100+ cell number. N = 9 anagen VI HFs from four different donors treated with siTSC2 or nontargeting oligos for 6 days.
Representative images of gp100 immunofluorescence.
Quantitative analysis of melanocyte dendricity. N = 10 anagen VI HFs from four different donors treated with siTSC2 or nontargeting oligos for 6 days.
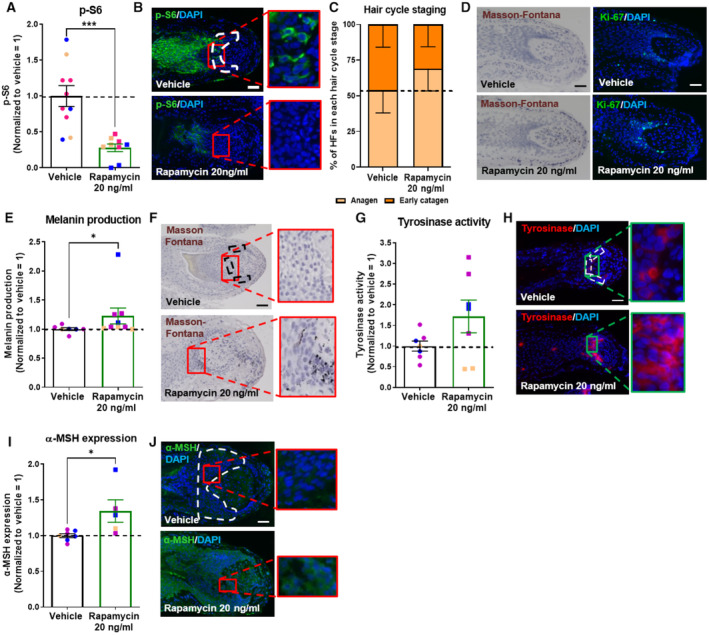
Quantitative analysis of phosphorylated S6 (p‐S6; mTORC1 activity read‐out) immunoreactivity. N = 9–10 gray anagen VI HFs from three different donors treated with Rapamycin 20 ng/ml or untreated (vehicle) for 7 days.
Representative fluorescence images of p‐S6 immunofluorescence.
Hair cycle staging was performed using Ki‐67 and Masson–Fontana histochemistry. Mean ± SEM; N = 16–17 gray HFs per group from three different donors treated with Rapamycin 20 ng/ml or untreated (vehicle) for 7 days.
Representative fluorescence images of Ki‐67 and bright‐field microscopic images of Masson–Fontana.
Quantitative histomorphometry of melanin production by Masson–Fontana histochemistry. N = 7–9 gray anagen VI HFs from three different donors treated with Rapamycin 20 ng/ml or untreated (vehicle) for 7 days.
Representative pictures of Masson–Fontana histochemistry.
Quantitative analysis of tyrosinase activity. N = 7 gray anagen VI HFs from three different donors treated with Rapamycin 20 ng/ml or untreated (vehicle) for 7 days.
Representative images of tyrosinase activity immunofluorescence.
Quantitative analysis of α‐MSH expression in defined reference area within the bulb. N = 5–7 gray anagen VI HFs from three different donors treated with Rapamycin 20 ng/ml or untreated (vehicle) for 7 days.
Representative images of α‐MSH immunofluorescence.
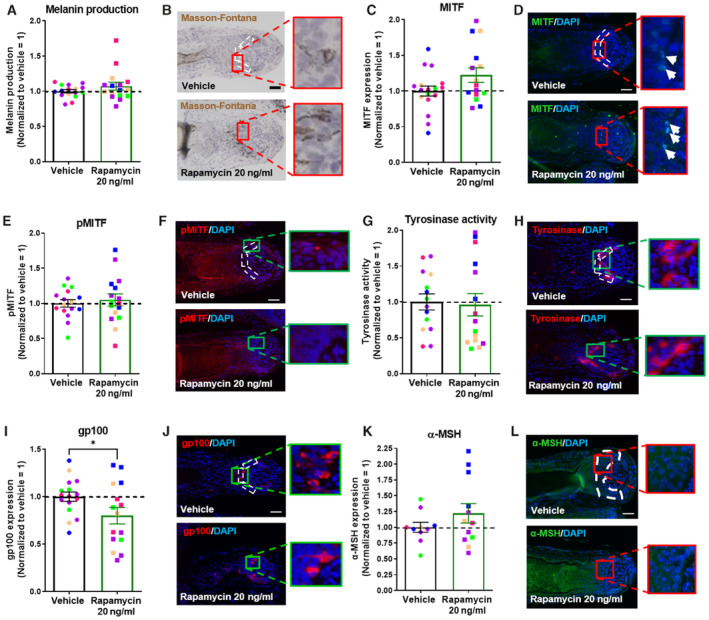
Quantitative histomorphometry of melanin production by Masson–Fontana histochemistry in defined reference area in the bulb. N = 16 gray anagen VI HFs from five different donors treated with Rapamycin 20 ng/ml or untreated (vehicle) for 7 days.
Representative bright‐field microscopy images of Masson–Fontana histochemistry.
Quantitative analysis of MITF expression in defined reference area in the bulb. N = 15–17 gray anagen VI HFs from five different donors treated with Rapamycin 20 ng/ml or untreated (vehicle) for 7 days.
Representative images of MITF immunofluorescence. White arrows showed MITF+ cells.
Quantitative analysis of MITF phosphorylation (pMITF) in defined reference area in the bulb. N = 16 gray anagen VI HFs from five different donors treated with Rapamycin 20 ng/ml or untreated (vehicle) for 7 days.
Representative fluorescence images of pMITF immunofluorescence. White arrows showed pMITF+ cells.
Quantitative analysis of tyrosinase activity in defined reference area in the bulb. N = 12–13 gray anagen VI HFs from four different donors treated with Rapamycin 20 ng/ml or untreated (vehicle) for 7 days.
Representative images of tyrosinase activity immunofluorescence.
Quantitative analysis of gp100 expression in defined reference area within the bulb. N = 15–16 gray anagen VI HFs from five different donors treated with Rapamycin 20 ng/ml or untreated (vehicle) for 7 days.
Representative images of gp100 immunofluorescence.
Quantitative analysis of α‐MSH expression in defined reference area within the bulb. N = 10–12 gray anagen VI HFs from five different donors treated with Rapamycin 20 ng/ml or untreated (vehicle) for 7 days.
Representative images of α‐MSH immunofluorescence.
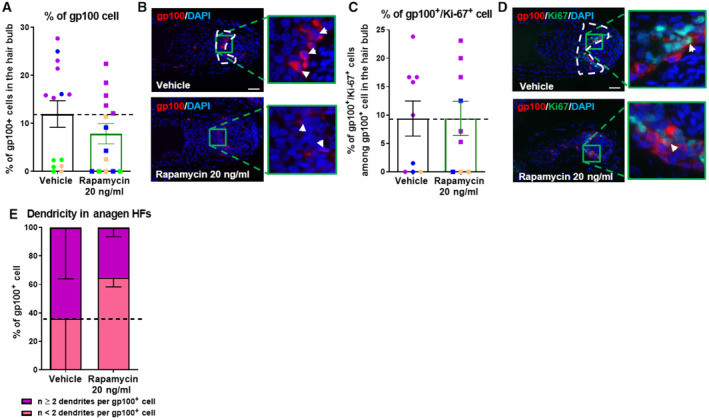
Quantitative immunohistomorphometry of the number of gp100+ cells. N = 14 gray anagen VI HFs from four different donors treated with Rapamycin 20 ng/ml or untreated (vehicle) for 7 days.
Representative images of gp100 immunofluorescence. Arrows indicate gp100+ cells.
Quantitative analysis of gp100+/ki‐67+ cell number. N = 9 gray anagen VI HFs from three different donors treated with Rapamycin 20 ng/ml or untreated (vehicle) for 7 days.
Representative images of gp100/ki‐67 immunofluorescence. Arrows indicate gp100+Ki‐67+ cells.
Quantitative analysis of melanocyte dendricity. N = 10–12 gray anagen VI HFs from four different donors treated with Rapamycin 20 ng/ml or untreated (vehicle) for 7 days.
References
-
- Apibal Y, Reakatanan W, Chunharas A (2008) Poliosis as the first clue of tuberous sclerosis. Pediatr Dermatol 25: 486–487 - PubMed
-
- Arck PC, Overall R, Spatz K, Liezman C, Handjiski B, Klapp BF, Birch‐Machin MA, Peters EMJ (2006) Towards a ‘free radical theory of graying’: melanocyte apoptosis in the aging human hair follicle is an indicator of oxidative stress induced tissue damage. FASEB J 20: 1567–1569 - PubMed
-
- Arora N, Siddiqui EM, Mehan S (2021) Involvement of adenylate cyclase/cAMP/CREB and SOX9/MITF in melanogenesis to prevent vitiligo. Mol Cell Biochem 476: 1401–1409 - PubMed
-
- Balestri R, Rizzoli L, Pedrolli A, Urru S, Rech G, Neri I, Girardelli CR, Magnano M (2022) Analysis of current data on the use of topical mTOR inhibitors in the treatment of facial angiofibromas in tuberous sclerosis complex ‐ an update. J Eur Acad Dermatol Venereol 37: 474–487 - PubMed
Publication types
MeSH terms
Substances
Grants and funding
LinkOut - more resources
Full Text Sources
Research Materials
Miscellaneous
