. 2023 Jun 15;11(3):e0125223.
doi: 10.1128/spectrum.01252-23. Epub 2023 May 22.

Variable Region Sequences Influence 16S rRNA Performance

Affiliations

Variable Region Sequences Influence 16S rRNA Performance

Nikhil Bose et al. Microbiol Spectr. .

Abstract

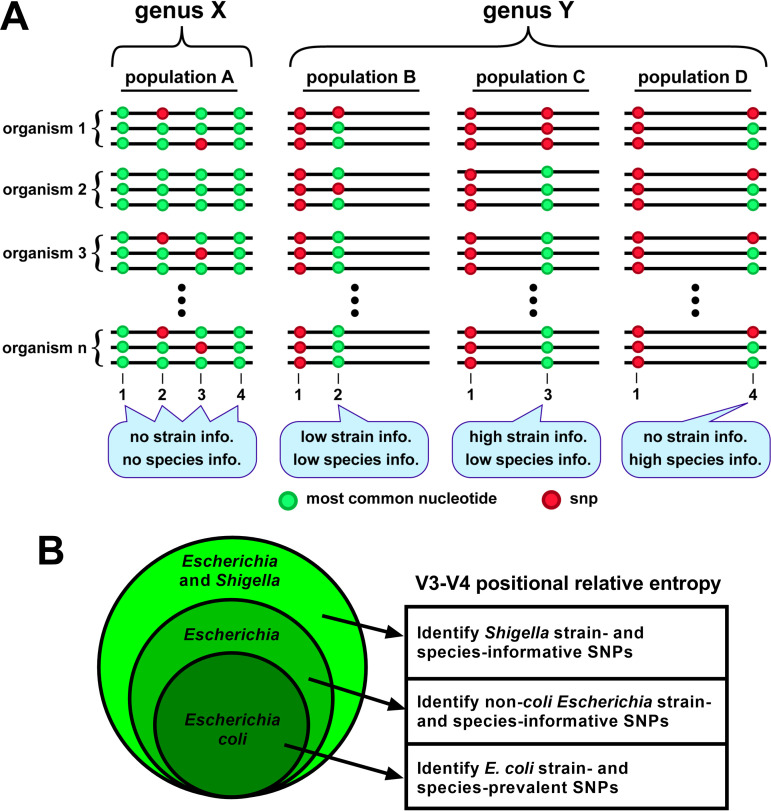
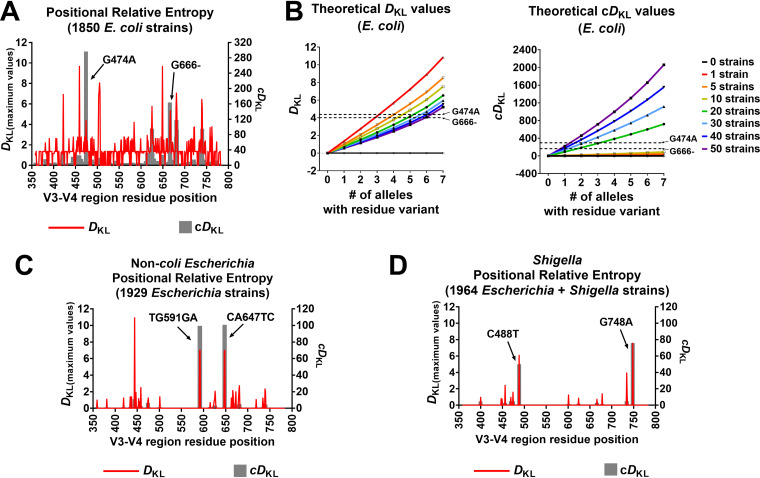
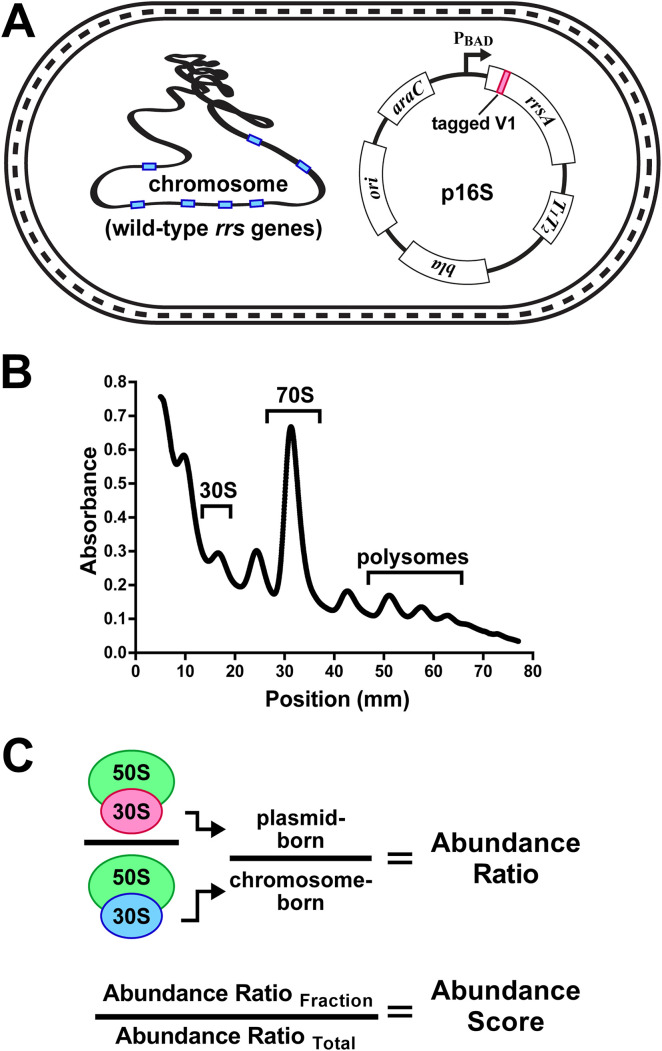
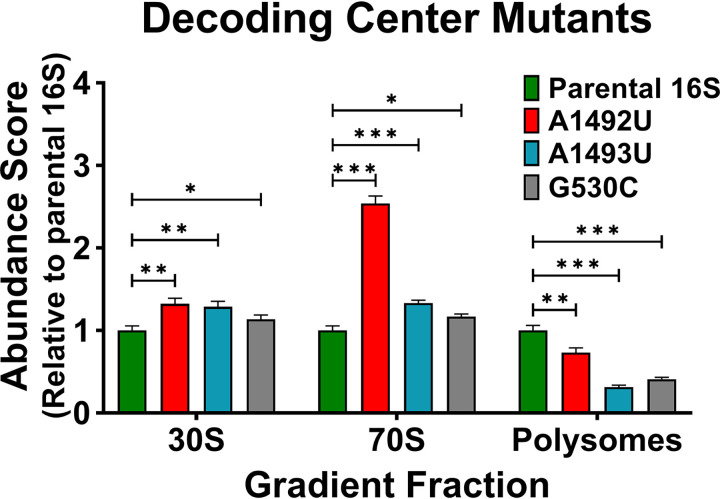
16S rRNA gene sequences are commonly analyzed for taxonomic and phylogenetic studies because they contain variable regions that can help distinguish different genera. However, intra-genus distinction using variable region homology is often impossible due to the high overall sequence identities among closely related species, even though some residues may be conserved within respective species. Using a computational method that included the allelic diversity within individual genomes, we discovered that certain Escherichia and Shigella species can be distinguished by a multi-allelic 16S rRNA variable region single nucleotide polymorphism (SNP). To evaluate the performance of 16S rRNAs with altered variable regions, we developed an in vivo system that measures the acceptance and distribution of variant 16S rRNAs into a large pool of natural versions supporting normal translation and growth. We found that 16S rRNAs containing evolutionarily disparate variable regions were underpopulated both in ribosomes and in active translation pools, even for an SNP. Overall, this study revealed that variable region sequences can substantially influence the performance of 16S rRNAs and that this biological constraint can be leveraged to justify refining taxonomic assignments of variable region sequence data. IMPORTANCE This study reevaluates the notion that 16S rRNA gene variable region sequences are uninformative for intra-genus classification and that single nucleotide variations within them have no consequence to strains that bear them. We demonstrated that the performance of 16S rRNAs in Escherichia coli can be negatively impacted by sequence changes in variable regions, even for single nucleotide changes that are native to closely related Escherichia and Shigella species; thus, biological performance is likely constraining the evolution of variable regions in bacteria. Further, the native nucleotide variations we tested occur in all strains of their respective species and across their multiple 16S rRNA gene copies, suggesting that these species evolved beyond what would be discerned from a consensus sequence comparison. Therefore, this work also reveals that the multiple 16S rRNA gene alleles found in most bacteria can provide more informative phylogenetic and taxonomic detail than a single reference allele.

Keywords: 16S rRNA; relative entropy; ribosome quality; single nucleotide polymorphism; taxonomy; variable region.


Conflict of interest statement

The authors declare no conflict of interest.

Figures

FIG 1
FIG 1
Illustration of 16S rRNA V3-V4 positional relative entropy. Relative entropy analysis can be used to identify strain- or species-specific residues among variable region sequences in a population. (A) Schematic depictions of variable regions of a multi-copy gene found in 2 hypothetical genera, X, and Y. In a sequenced cohort of genus X organisms (population A), invariant residues at positions 1 and 4 provide no sub-genus information, and SNPs observed at positions 2 and 3 are not associated with a particular species or strain, so their identities provide no information at those taxonomic levels. In genus Y, the SNP at position 1 is a strong genus indicator (relative to that of genus X). In population B, occasional SNPs at position 2 provide no information because they are observed in single alleles in strains nonspecific to a species. In population C, an SNP at position 3 is a strong strain indicator because it is present in all alleles in the strain’s genome. In population D, an occasional SNP at position 4 indicates the presence of that species but provides no strain information. (B) A Venn diagram illustrating the process of using positional relative entropy (DKL) to identify informative V3-V4 residues, starting from (i) those prevalent in a strain or multiple strains relative to the total E. coli population, then (ii) those informative of non-coli Escherichia strains and species relative to the total Escherichia population, and lastly (iii) those informative of Shigella strains and species relative to the total Escherichia and Shigella population.
FIG 2
FIG 2
Informative 16S rRNA gene V3-V4 sequence polymorphisms among Escherichia and Shigella. Relative entropy was used to identify strain- and species-informative SNPs within Escherichia and Shigella V3-V4 sequences across all genomic copies of 16S rRNA genes. (A) A DKL peak (red) corresponds to an SNP at that position that is highly correlated with a particular strain among E. coli strains. A peak in a cumulative DKL (cDKL) plot (gray) indicates an SNP that is prevalent across strains and may be specific to E. coli species. For the evaluated E. coli population (1850 strains), 2 positions showed high species cDKL, corresponding to G474A (cDKL = 296.48) and G666- (cDKL = 163.86). (B) Theoretical values for DKL and cDKL were calculated for up to 50 strains in the E. coli population having an SNP in 0 to 7 out of 7 alleles (total of 12,876 sequences in the population). The DKL and cDKL values of the notable SNPs discussed in (A) are indicated for reference. (C) DKL and cDKL values were determined for non-coli Escherichia strains. Two polymorphisms, TG591GA and CA647TC, had high strain and species values and were found only in E. albertii strains. (D) DKL and cDKL values were calculated to identify Shigella strain- and species-SNPs within the large population of Escherichia and Shigella. C488T and G748A had high strain and species values and were S. boydii- and S. dysenteriae-informative, respectively.
FIG 3
FIG 3
Establishing the performance of 16S rRNA variants. Modified 16S rRNAs were evaluated in an E. coli strain with intact rrn operons. (A) The E. coli rrsA gene was cloned into a plasmid under the control of a tightly repressed PBAD promoter. The cloned rrsA was modified in its variable 1 (V1) region to contain a unique tracking tag sequence that was detectable using RT-qPCR. Other mutations were subsequently introduced in this tagged V1 rrsA for abundance evaluations of expressed 16S rRNA. (B) Fractionation of cell lysates using sucrose gradients allowed for isolation of 16S rRNAs in various stages of small subunit assembly and translation. The regions of 30S, 70S, and polysome material collected in this study are indicated. (C) RNA was extracted from gradient fractions and used to establish the abundance ratio of plasmid-born 16S relative to chromosome-born in the same fraction. An abundance score was then calculated by comparing the abundance ratio in a given fraction to that of the unfractionated lysate.
FIG 4
FIG 4
Evaluating decoding center mutants. Abundance scores were determined for plasmid-born 16S rRNA containing separate decoding center mutations A1492U (red), A1493U (blue), and G530C (gray). Scores for mutants were compared to those observed for the parental 16S rRNA (y axis) for the 30S, 70S, and polysome lysate fractions. Error bars represent standard deviations for biological replicates (n = 3). Comparative statistics represent Student's t test results. P values <0.05 (*), < 0.01 (**), < 0.001 (***).
FIG 5
FIG 5
Identification and performance assessment of 16S rRNA with disparate V3 region variants. The central portions of V3 regions are generally not conserved and fall into 2 length categories. (A) Escherichia coli and Clostridioides difficile V3 region secondary structures were computationally predicted using RNAfold (69). The C. difficile V3 encodes a shorter helix and is missing the outer stem-loop. At the tip of the E. coli hairpin is residue A465 (arrow). (B) An analysis of residue consensus in V3 region sequences revealed that A465 is present in over 99% of bacteria in the class Gammaproteobacteria (total of 162,325 sequences). (C) In the E. coli ribosome, A465 is located at the tip of helix 17 (lime-green) and forms potential hydrogen bonds with G203 and C215 in the V2 region (dark gray). Yellow spheres are residues of small subunit proteins (image rendered from PDB 4V9D). (D) Abundance scores for E. coli 16S rRNA with C. diff V3 (orange) and an A465U transversion (violet) were determined relative to the parent 16S. Error bars represent standard deviations for biological replicates (n = 3). Comparative statistics represent Student's t test results. P value < 0.001(***).
FIG 6
FIG 6
Structure of V3-V4 informative residues in E. coli and abundance scores for Escherichia and Shigella species variants. The residue positions for Escherichia and Shigella species-informative SNPs were assessed in an of E. coli ribosome structure (PDB 4V9D). Abundance scores were evaluated for E. coli 16S rRNA harboring informative Escherichia and Shigella species-informative V3-V4 residues. V3 residues in ribosome structures and abundance scores associated with their mutation are colored lime-green, and those for the V4 region are colored dark blue. Unmutated residues are colored dark gray in structures. (A) G474 hydrogen bonds with U458 and G666 with U740. (B) The abundance scores for 16S rRNAs harboring the species-informative E. coli variations (G474A and G666-) were evaluated in vivo. (C) Residues at sites for E. albertii-specific polymorphisms (UG591GA and CA647UC) complemented each other. (D) Abundance scores for E. coli 16S rRNAs harboring E. albertii V3-V4 variants at 1 or both sites were evaluated. (E) C488 and G748 are positioned to interact with G446 and C658 respectively. (F) Abundance scores for E. coli 16S rRNAs harboring C488U (Shigella boydii SNP) or G748A (Shigella dysenteriae SNP) were evaluated. Error bars represent standard deviations for biological replicates (n = 3). Comparative statistics represent Student's t test results. P values ≥ 0.05 (ns), < 0.05 (*), < 0.01 (**), < 0.001 (***).

References

    1. Culver GM. 2003. Assembly of the 30S ribosomal subunit. Biopolymers 68:234–249. doi:10.1002/bip.10221. - DOI - PubMed
    1. Schuwirth BS, Borovinskaya MA, Hau CW, Zhang W, Vila-Sanjurjo A, Holton JM, Cate JH. 2005. Structures of the bacterial ribosome at 3.5 A resolution. Science 310:827–834. doi:10.1126/science.1117230. - DOI - PubMed
    1. Talkington MW, Siuzdak G, Williamson JR. 2005. An assembly landscape for the 30S ribosomal subunit. Nature 438:628–632. doi:10.1038/nature04261. - DOI - PMC - PubMed
    1. Woodson SA. 2008. RNA folding and ribosome assembly. Curr Opin Chem Biol 12:667–673. doi:10.1016/j.cbpa.2008.09.024. - DOI - PMC - PubMed
    1. Davis JH, Williamson JR. 2017. Structure and dynamics of bacterial ribosome biogenesis. Philos Trans R Soc Lond B Biol Sci 372. doi:10.1098/rstb.2016.0181. - DOI - PMC - PubMed

Publication types

LinkOut - more resources