. 2023 Jun 1;60(3):915-937.
doi: 10.1215/00703370-10772782.

Probabilistic County-Level Population Projections

Affiliations

Probabilistic County-Level Population Projections

Crystal Cy Yu et al. Demography. .

Abstract

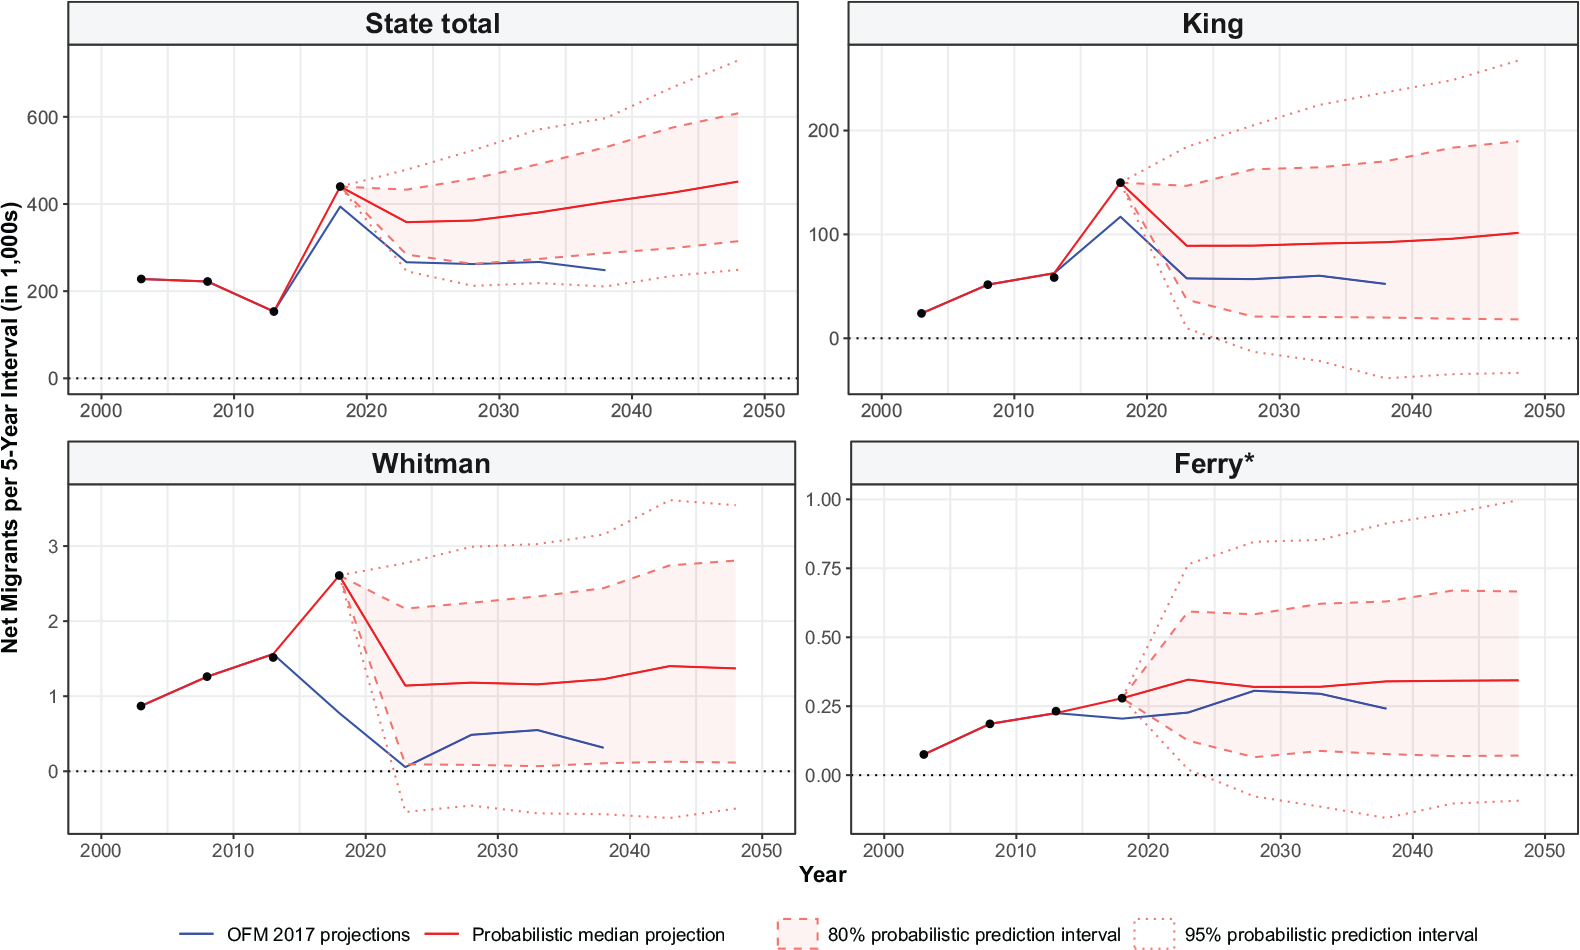
Population projections provide predictions of future population sizes for an area. Historically, most population projections have been produced using deterministic or scenario-based approaches and have not assessed uncertainty about future population change. Starting in 2015, however, the United Nations (UN) has produced probabilistic population projections for all countries using a Bayesian approach. There is also considerable interest in subnational probabilistic population projections, but the UN's national approach cannot be used directly for this purpose, because within-country correlations in fertility and mortality are generally larger than between-country ones, migration is not constrained in the same way, and there is a need to account for college and other special populations, particularly at the county level. We propose a Bayesian method for producing subnational population projections, including migration and accounting for college populations, by building on but modifying the UN approach. We illustrate our approach by applying it to the counties of Washington State and comparing the results with extant deterministic projections produced by Washington State demographers. Out-of-sample experiments show that our method gives accurate and well-calibrated forecasts and forecast intervals. In most cases, our intervals were narrower than the growth-based intervals issued by the state, particularly for shorter time horizons.

Keywords: Bayesian model; Cohort-component method; Probabilistic population projections; Subnational projections; Uncertainty.


Figures

Fig. 1
Fig. 1
The process of generating a probabilistic population projection for each county in Washington State. The processes of generating probabilistic trajectories of the various components are shown in rectangular boxes: TFR (total fertility rate) in pink, sex-specific e0 (life expectancy at birth) in green, NMR (net migration rate) in yellow, and population in blue. The parallelograms show input and output data sets; those shaded in gray are data sets provided by the user. The R software packages used for the respective processes are shown in boldface in the lower right corners of the colored boxes. BHM = Bayesian hierarchical model. AR(1) = first-order autoregressive process.
Fig. 2
Fig. 2
Projected total population for select geographies. Aggregated projected population numbers for Washington State are shown in the top left panel. Projected population totals for King, Whitman, and Ferry Counties are shown in the other panels. To accommodate the differences in population size for these four geographies, the scale for the y-axes—total population in thousands—is different in each panel. Counties with populations below 25,000, such as Ferry County, have an asterisk following the name. Four sets of projections are plotted in each panel: three deterministic trajectories produced by OFM, which are depicted in blue, and our probabilistic trajectories, depicted in red. The most recent set of population projections produced by OFM were published in 2017, with a projection start year of 2020. The lower and upper dot-dashed blue lines correspond to OFM’s low and high projections, respectively, while the solid blue line is the medium projection. The 80% and 95% prediction intervals (dashed and dotted red lines, respectively) around the median projection (the solid red line) illustrate uncertainty and the potential range for projected total population size.
Fig. 3
Fig. 3
County-level projections of total population for all counties in Washington. The counties in the figure are arranged to approximate their geographic location in the state. An aggregated state total is shown in the bottom left corner. The scale of the y-axis is different for each geographic unit. Counties with populations below 25,000 have an asterisk following the name.
Fig. 4
Fig. 4
Predicted number of net migrants over the projection period 2020‒2050 for the state as a whole, as well as for King, Whitman, and Ferry Counties. Deterministic projections for net migration are available only for the medium series, and through the 2035‒2040 period. Our probabilistic projections of net migration have been produced out to 2050. The OFM projections draw upon observed data through approximately 2017, while our probabilistic projections start with updated, observed estimates of migration through 2019. The scale of the y-axis is different for each geographic unit. Counties with populations below 25,000 have an asterisk following the name.
Fig. 5
Fig. 5
County-level projections of total net migrants per 5-year period for all counties in Washington. The counties in the figure are arranged to approximate their geographic location within the state. An aggregated state total is depicted in the lower left corner. The scale of the y-axis is different for each geographic unit. Counties with populations below 25,000 have an asterisk following the name.
Fig. 6
Fig. 6
County-level results of total births per 5-year period for all counties. The counties in the figure are arranged to approximate their geographic location within the state. An aggregated state total is depicted in the lower left corner. The scale of the y-axis is different for each geographic unit. Counties with populations below 25,000 have an asterisk following the name.
Fig. 7
Fig. 7
Probabilistic population pyramid for King County, comparing the year 2020 (red bars) with the projected median for 2050 (black boxes) and showing the corresponding 80% and 95% probability intervals (PI; blue and green bars, respectively).

References

    1. Alkema L, Gerland P, Raftery A, & Wilmoth J (2015). The United Nations probabilistic population projections: An introduction to demographic forecasting with uncertainty. Foresight, 2015(37), 19–24. - PMC - PubMed
    1. Alkema L, Raftery AE, Gerland P, Clark SJ, Pelletier F, Buettner T, & Heilig GK (2011). Probabilistic projections of the total fertility rate for all countries. Demography, 48, 815–839. - PMC - PubMed
    1. Azose J, Ševčíková H, & Raftery A (2022). bayesMig: Bayesian projection of migration (R package version 0.2–3) [Computer software]. Available at https://github.com/PPgp/bayesMig
    1. Azose JJ, & Raftery AE (2015). Bayesian probabilistic projection of international migration. Demography, 52, 1627–1650. - PMC - PubMed
    1. Azose JJ, Ševčíková H, & Raftery AE (2016). Probabilistic population projections with migration uncertainty. Proceedings of the National Academy of Sciences, 113, 6460–6465. - PMC - PubMed

Publication types

LinkOut - more resources