

High-throughput Saccharomyces cerevisiae cultivation method for credentialing-based untargeted metabolomics
- PMID: 37212869
- PMCID: PMC10289995
- DOI: 10.1007/s00216-023-04724-5
High-throughput Saccharomyces cerevisiae cultivation method for credentialing-based untargeted metabolomics
Abstract
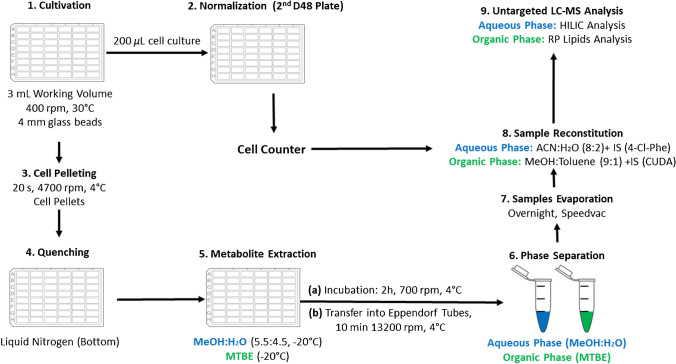
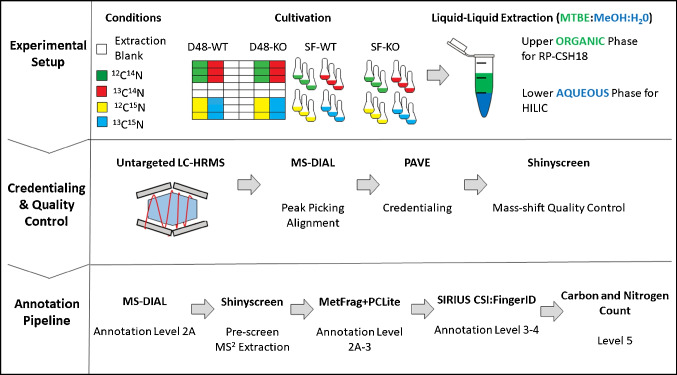
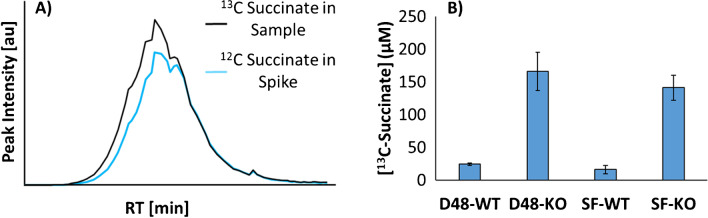
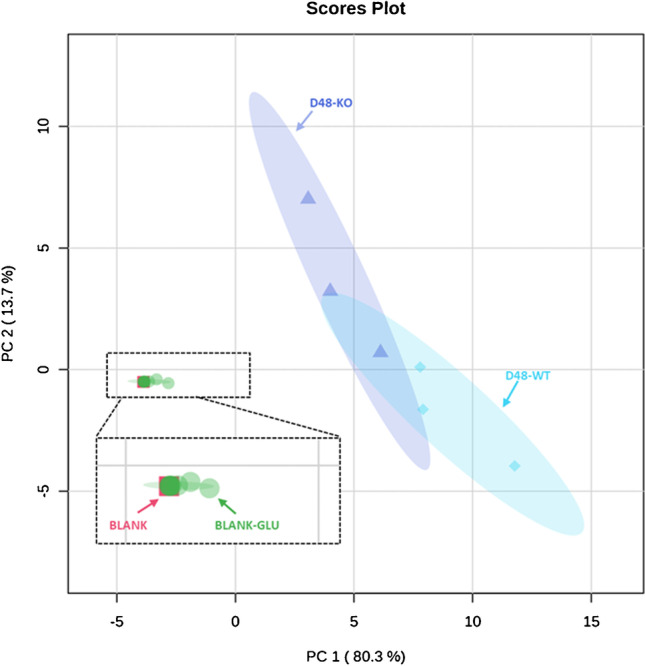
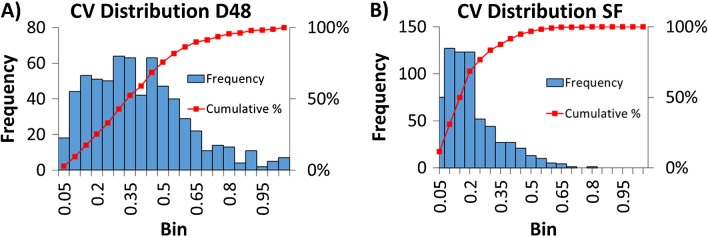
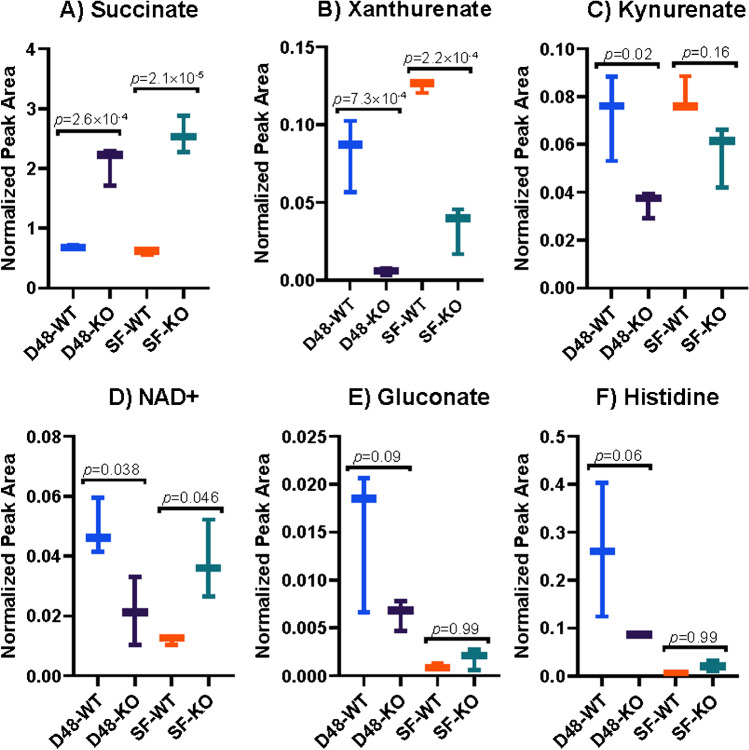
Identifying metabolites in model organisms is critical for many areas of biology, including unravelling disease aetiology or elucidating functions of putative enzymes. Even now, hundreds of predicted metabolic genes in Saccharomyces cerevisiae remain uncharacterized, indicating that our understanding of metabolism is far from complete even in well-characterized organisms. While untargeted high-resolution mass spectrometry (HRMS) enables the detection of thousands of features per analysis, many of these have a non-biological origin. Stable isotope labelling (SIL) approaches can serve as credentialing strategies to distinguish biologically relevant features from background signals, but implementing these experiments at large scale remains challenging. Here, we developed a SIL-based approach for high-throughput untargeted metabolomics in S. cerevisiae, including deep-48 well format-based cultivation and metabolite extraction, building on the peak annotation and verification engine (PAVE) tool. Aqueous and nonpolar extracts were analysed using HILIC and RP liquid chromatography, respectively, coupled to Orbitrap Q Exactive HF mass spectrometry. Of the approximately 37,000 total detected features, only 3-7% of the features were credentialed and used for data analysis with open-source software such as MS-DIAL, MetFrag, Shinyscreen, SIRIUS CSI:FingerID, and MetaboAnalyst, leading to the successful annotation of 198 metabolites using MS2 database matching. Comparable metabolic profiles were observed for wild-type and sdh1Δ yeast strains grown in deep-48 well plates versus the classical shake flask format, including the expected increase in intracellular succinate concentration in the sdh1Δ strain. The described approach enables high-throughput yeast cultivation and credentialing-based untargeted metabolomics, providing a means to efficiently perform molecular phenotypic screens and help complete metabolic networks.
Keywords: High-throughput sample generation; Liquid chromatography; Metabolomics; Saccharomyces cerevisiae; Stable isotope labelling; Untargeted high-resolution mass spectrometry.
© 2023. The Author(s).
Conflict of interest statement
The authors declare no competing interests.
Figures
Similar articles
-
Untargeted Metabolomic Analysis in the Short-Lived Killifish Using HILIC Ultra Performance Liquid Chromatography Method Coupled to a Q Exactive Orbitrap Mass Spectrometer.Methods Mol Biol. 2025;2925:397-405. doi: 10.1007/978-1-0716-4534-5_26. Methods Mol Biol. 2025. PMID: 40498203
-
LC-MS untargeted metabolomics assesses the delayed response of glufosinate treatment of transgenic glufosinate resistant (GR) buffalo grasses (Stenotaphrum secundatum L.).Metabolomics. 2021 Feb 20;17(3):28. doi: 10.1007/s11306-021-01776-5. Metabolomics. 2021. PMID: 33609206
-
Peak Annotation and Verification Engine for Untargeted LC-MS Metabolomics.Anal Chem. 2019 Feb 5;91(3):1838-1846. doi: 10.1021/acs.analchem.8b03132. Epub 2019 Jan 10. Anal Chem. 2019. PMID: 30586294 Free PMC article.
-
Mass spectrometric based approaches in urine metabolomics and biomarker discovery.Mass Spectrom Rev. 2017 Mar;36(2):115-134. doi: 10.1002/mas.21455. Epub 2015 Apr 16. Mass Spectrom Rev. 2017. PMID: 25881008 Review.
-
Challenges and emergent solutions for LC-MS/MS based untargeted metabolomics in diseases.Mass Spectrom Rev. 2018 Nov;37(6):772-792. doi: 10.1002/mas.21562. Epub 2018 Feb 27. Mass Spectrom Rev. 2018. PMID: 29486047 Review.
Cited by
-
4,4'-methylenediphenol reduces Aβ-induced toxicity in a Caenorhabditis elegans model of Alzheimer's disease.Front Aging Neurosci. 2024 May 30;16:1393721. doi: 10.3389/fnagi.2024.1393721. eCollection 2024. Front Aging Neurosci. 2024. PMID: 38872629 Free PMC article.
References
-
- Li D, Liang W, Feng X, Ruan T, Jiang G. Recent advances in data-mining techniques for measuring transformation products by high-resolution mass spectrometry. TrAC Trends Anal Chem. 2021;143:116409. 10.1016/j.trac.2021.116409.
-
- Horai H, Arita M, Kanaya S, Nihei Y, Ikeda T, Suwa K, Ojima Y, Tanaka K, Tanaka S, Aoshima K, Oda Y, Kakazu Y, Kusano M, Tohge T, Matsuda F, Sawada Y, Hirai MY, Nakanishi H, Ikeda K, Akimoto N, Maoka T, Takahashi H, Ara T, Sakurai N, Suzuki H, Shibata D, Neumann S, Iida T, Tanaka K, Funatsu K, Matsuura F, Soga T, Taguchi R, Saito K, Nishioka T. MassBank: a public repository for sharing mass spectral data for life sciences. J Mass Spectrom. 2010;45:703–714. doi: 10.1002/jms.1777. - DOI - PubMed
MeSH terms
Grants and funding
LinkOut - more resources
Full Text Sources
Molecular Biology Databases
Research Materials
Miscellaneous
