True Origin of Amide I Shifts Observed in Protein Spectra Obtained with Sum Frequency Generation Spectroscopy
- PMID: 37213084
- PMCID: PMC10240526
- DOI: 10.1021/acs.jpclett.3c00391
True Origin of Amide I Shifts Observed in Protein Spectra Obtained with Sum Frequency Generation Spectroscopy
Abstract
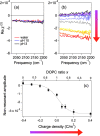
Accurate determination of protein structure at interfaces is critical for understanding protein interactions, which is directly relevant to a molecular-level understanding of interfacial proteins in biology and medicine. Vibrational sum frequency generation (VSFG) spectroscopy is often used for probing the protein amide I mode, which reports protein structures at interfaces. Observed peak shifts are attributed to conformational changes and often form the foundation of hypotheses explaining protein working mechanisms. Here, we investigate structurally diverse proteins using conventional and heterodyne-detected VSFG (HD-VSFG) spectroscopy as a function of solution pH. We reveal that blue-shifts of the amide I peak observed in conventional VSFG spectra upon lowering the pH are governed by the drastic change of the nonresonant contribution. Our results highlight that connecting changes in conventional VSFG spectra to conformational changes of interfacial proteins can be arbitrary, and that HD-VSFG measurements are required to draw unambiguous conclusions about structural changes in biomolecules.
Conflict of interest statement
The authors declare no competing financial interest.
Figures


Similar articles
-
Identification of the response of protein N-H vibrations in vibrational sum-frequency generation spectroscopy of aqueous protein films.Phys Chem Chem Phys. 2017 May 3;19(17):10804-10807. doi: 10.1039/c6cp08325k. Phys Chem Chem Phys. 2017. PMID: 28265595
-
Structure and dynamics of interfacial water studied by heterodyne-detected vibrational sum-frequency generation.Annu Rev Phys Chem. 2013;64:579-603. doi: 10.1146/annurev-physchem-040412-110138. Epub 2013 Jan 16. Annu Rev Phys Chem. 2013. PMID: 23331304
-
Theoretical Sum Frequency Generation Spectra of Protein Amide with Surface-Specific Velocity-Velocity Correlation Functions.J Phys Chem B. 2022 Oct 27;126(42):8571-8578. doi: 10.1021/acs.jpcb.2c04321. Epub 2022 Oct 4. J Phys Chem B. 2022. PMID: 36194760
-
Structure and orientation of interfacial proteins determined by sum frequency generation vibrational spectroscopy: method and application.Adv Protein Chem Struct Biol. 2013;93:213-55. doi: 10.1016/B978-0-12-416596-0.00007-5. Adv Protein Chem Struct Biol. 2013. PMID: 24018327 Review.
-
A Happy Get-Together - Probing Electrochemical Interfaces by Non-Linear Vibrational Spectroscopy.Chemistry. 2022 Oct 4;28(55):e202200407. doi: 10.1002/chem.202200407. Epub 2022 Jul 21. Chemistry. 2022. PMID: 35730530 Free PMC article. Review.
Cited by
-
Molecular Fingerprints of Ice Surfaces in Sum Frequency Generation Spectra: A First-Principles Machine Learning Study.JACS Au. 2025 Feb 7;5(3):1173-1183. doi: 10.1021/jacsau.4c00957. eCollection 2025 Mar 24. JACS Au. 2025. PMID: 40151237 Free PMC article.
-
Streamlining Skin Regeneration: A Ready-To-Use Silk Bilayer Wound Dressing.Gels. 2024 Jun 30;10(7):439. doi: 10.3390/gels10070439. Gels. 2024. PMID: 39057462 Free PMC article.
-
Fabrication of chicken 3D-analogs via soy proteins hydrocolloid-mediated noncovalent complexation with lipo-ligands: Mechanistic elucidation and structure-function dynamics.Food Chem X. 2025 Jun 13;29:102664. doi: 10.1016/j.fochx.2025.102664. eCollection 2025 Jul. Food Chem X. 2025. PMID: 40599595 Free PMC article.
References
MeSH terms
Substances
LinkOut - more resources
Full Text Sources

