. 2023 Jul 3;222(7):e202301113.
doi: 10.1083/jcb.202301113. Epub 2023 May 22.

An RNA-based feed-forward mechanism ensures motor switching in oskar mRNA transport

Affiliations

An RNA-based feed-forward mechanism ensures motor switching in oskar mRNA transport

Imre Gáspár et al. J Cell Biol. .

Abstract

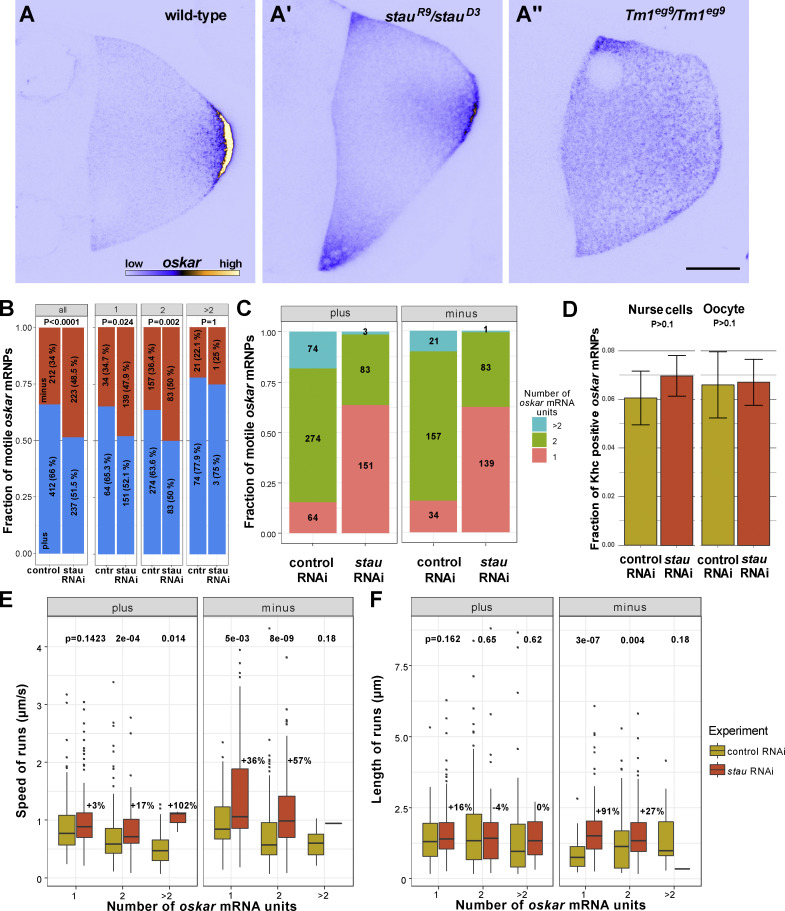
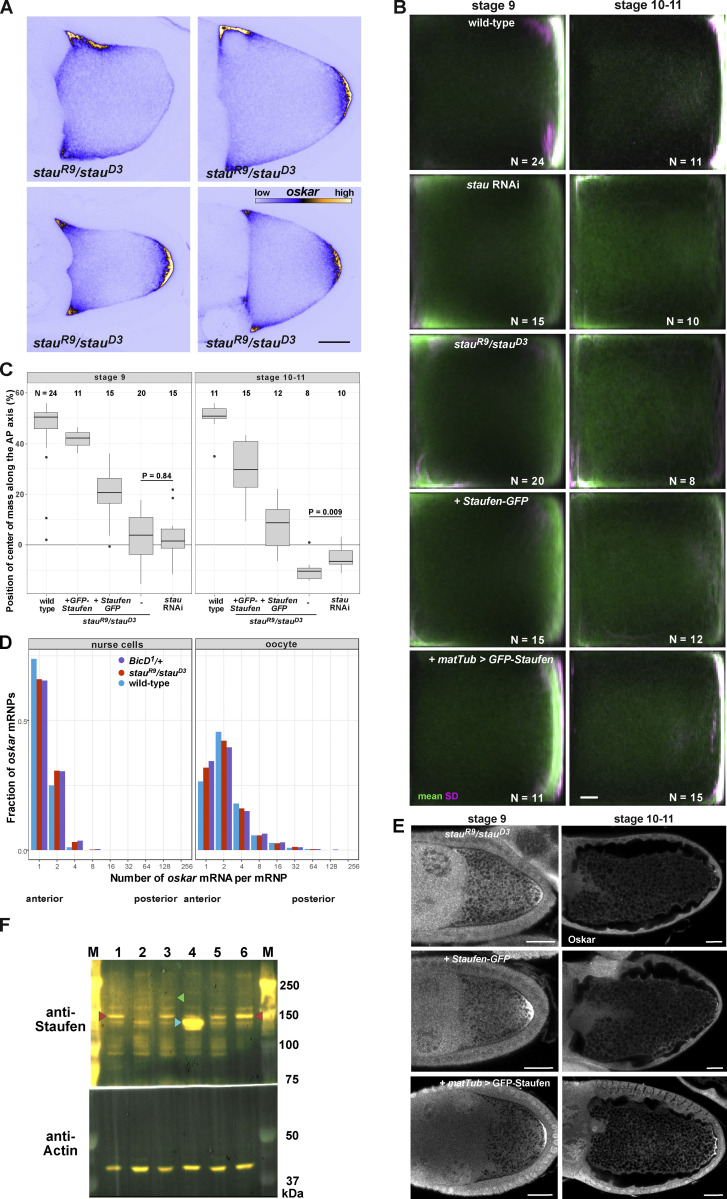
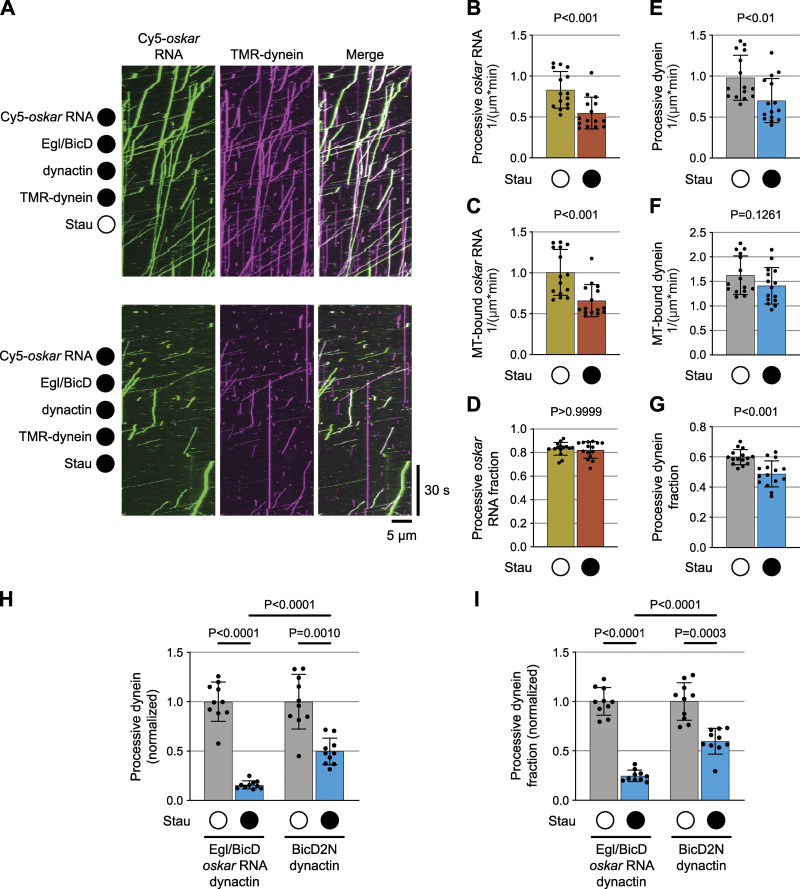
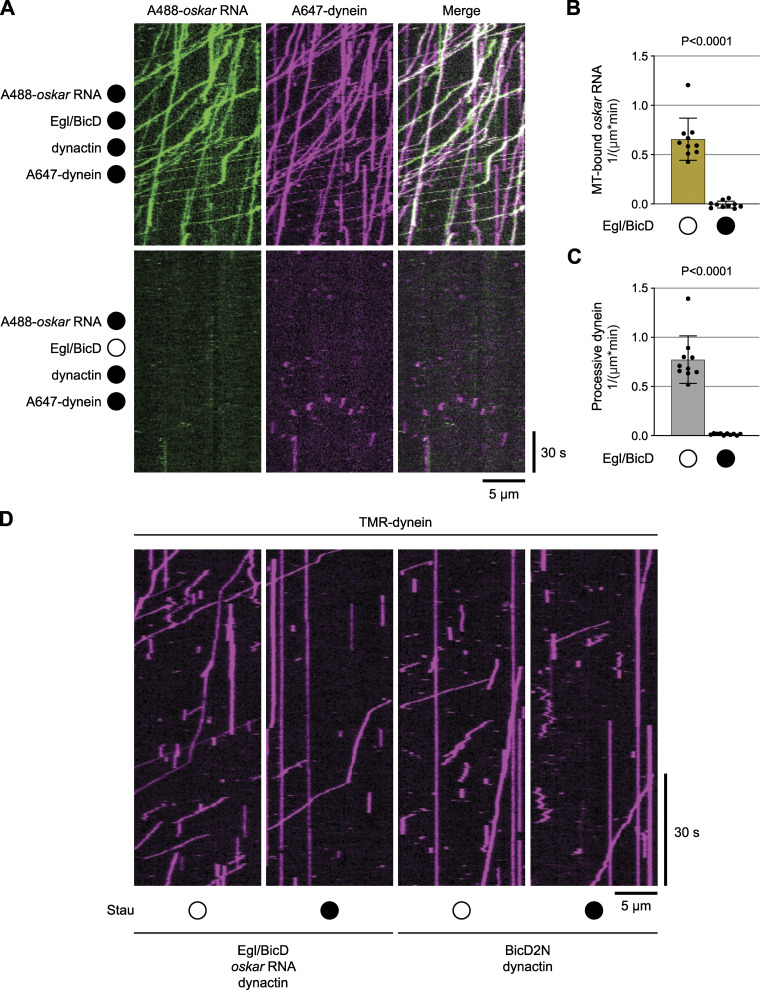
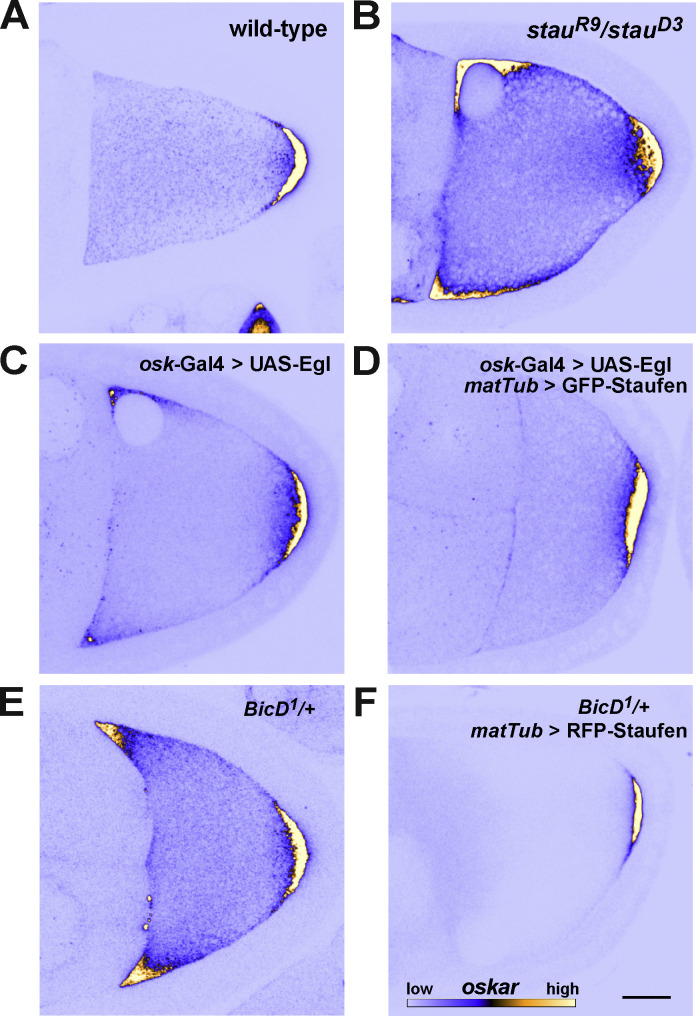
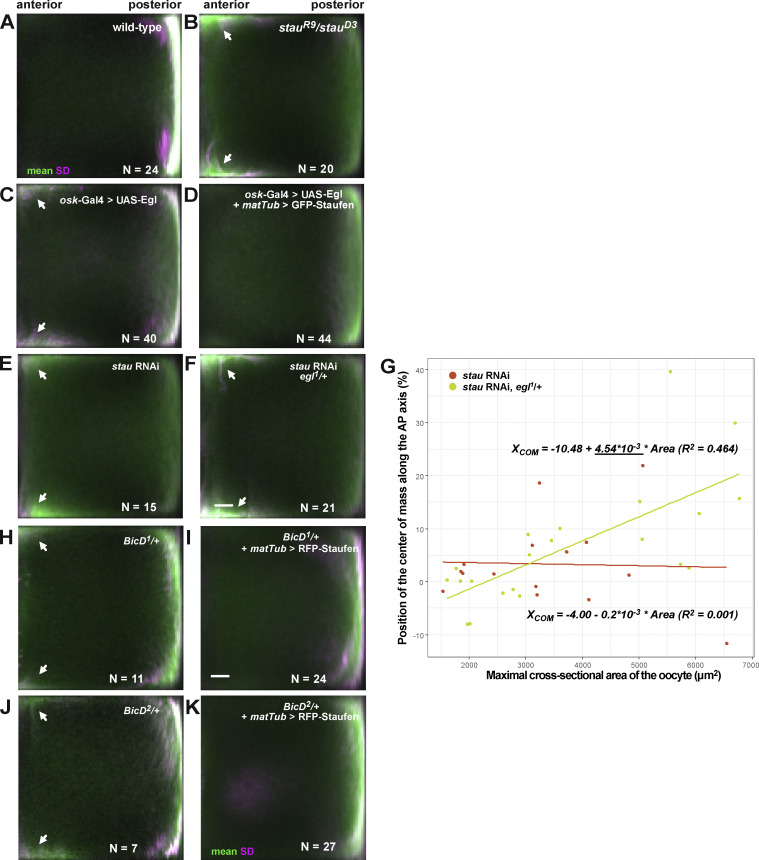
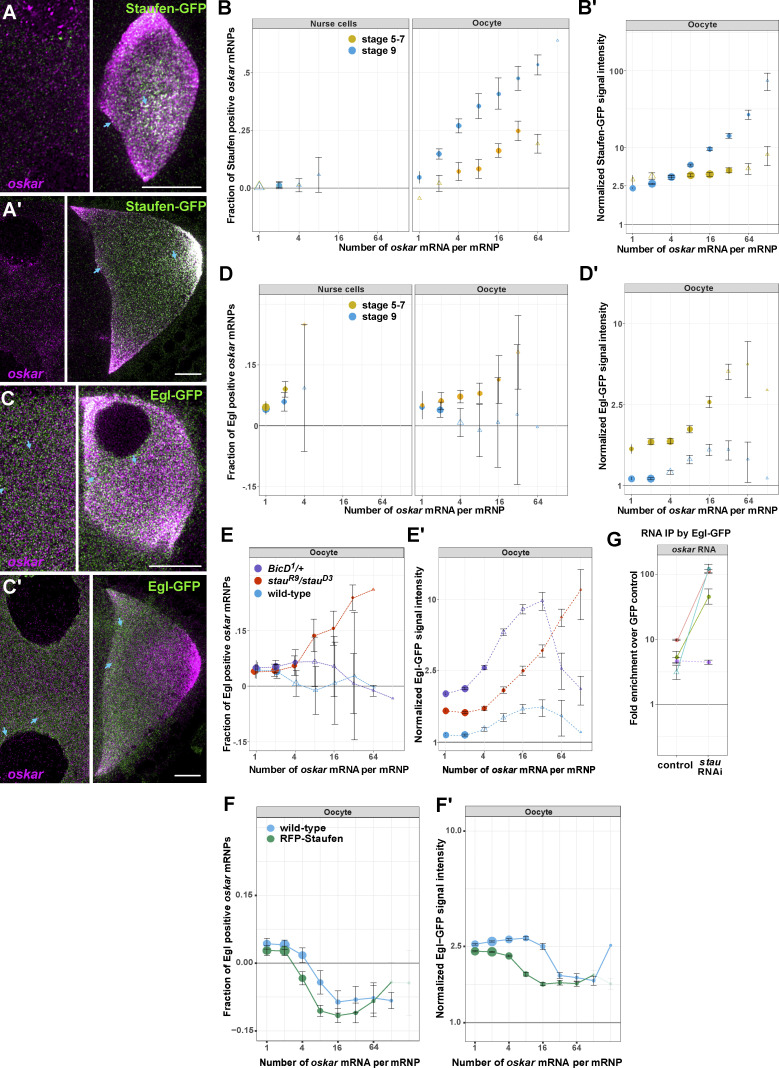
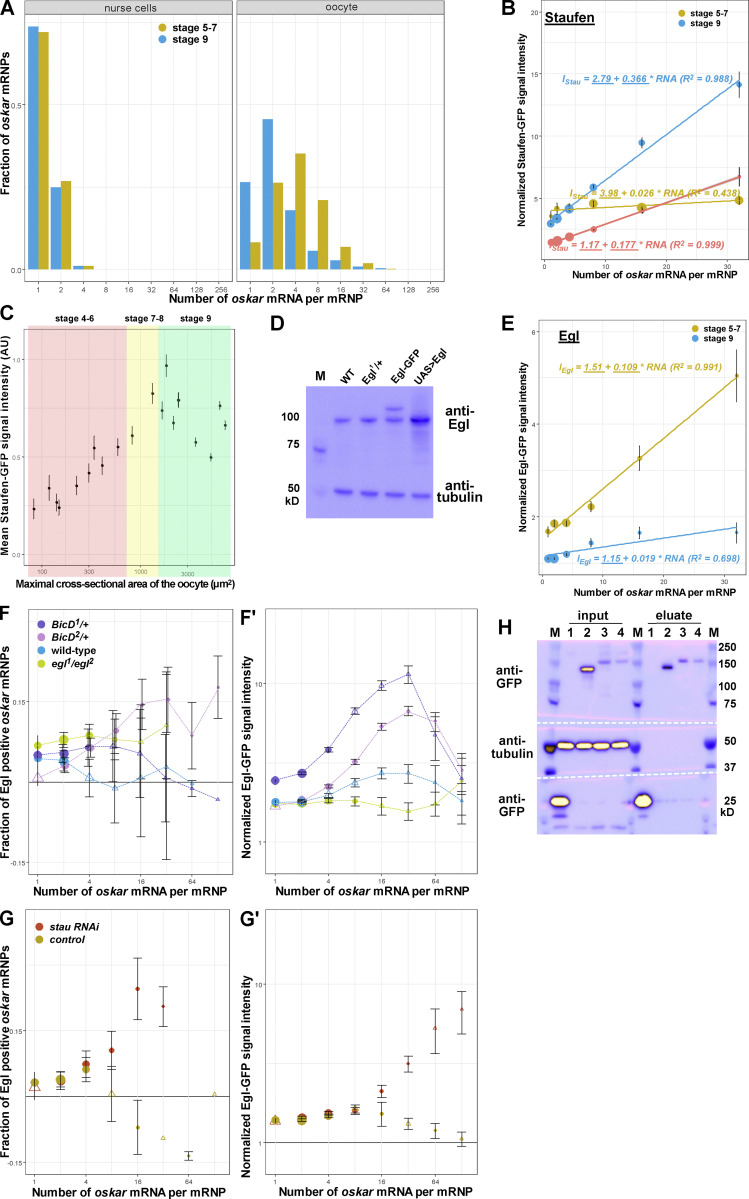
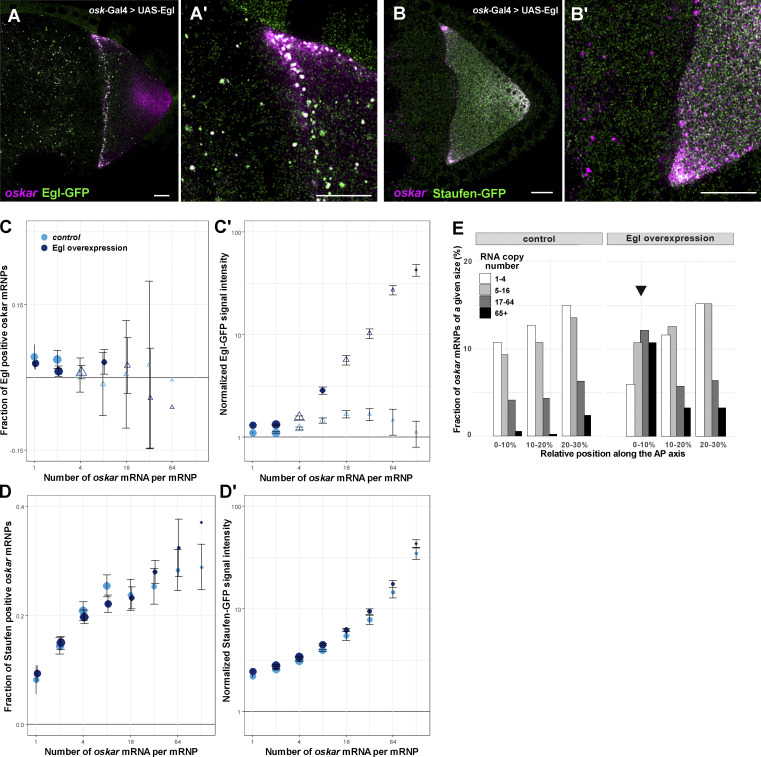
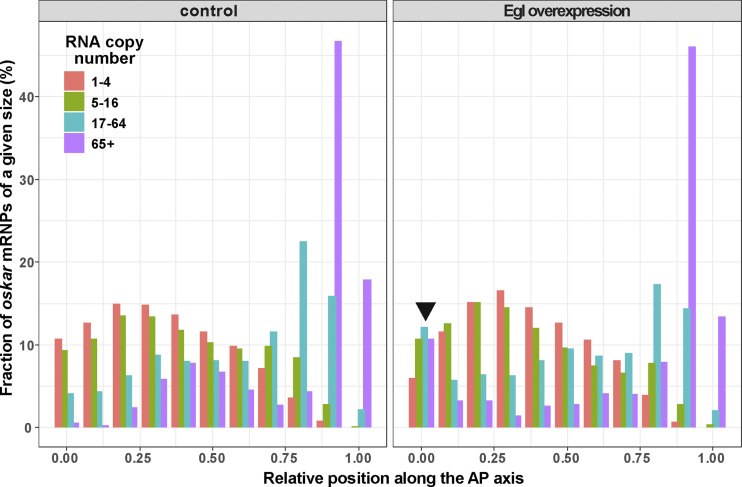
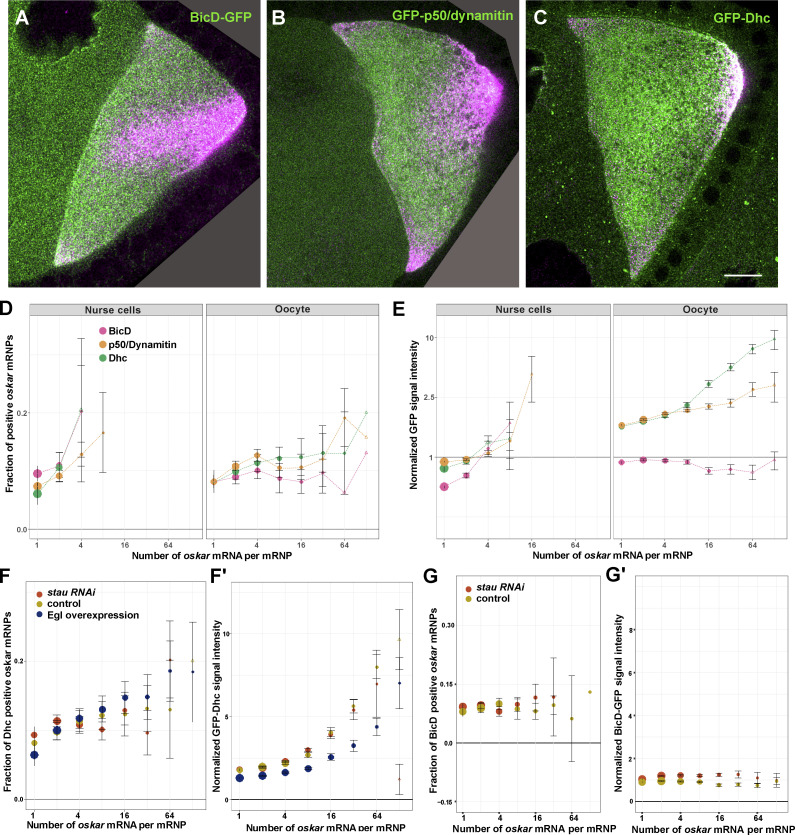
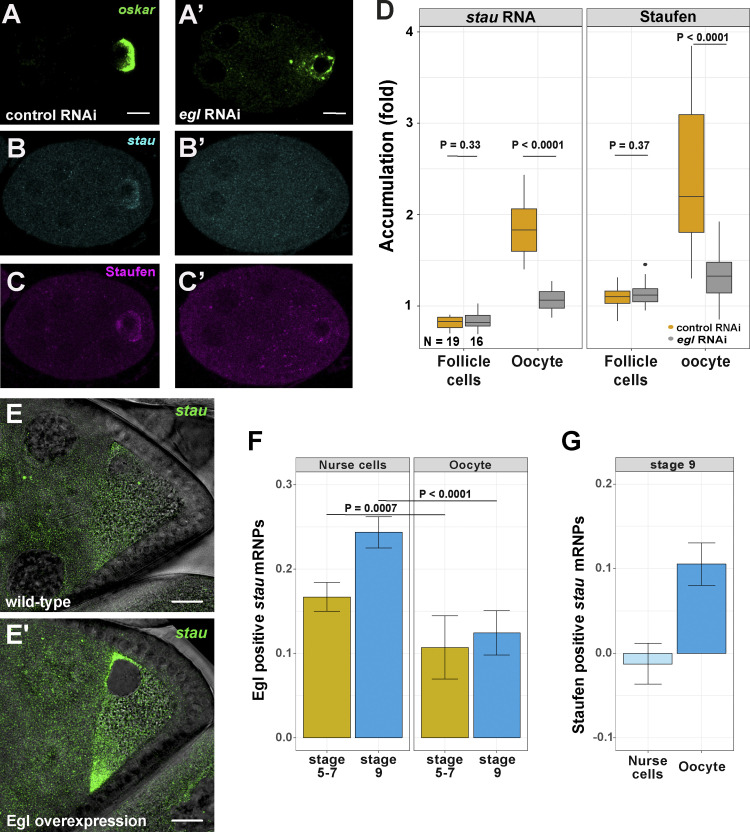
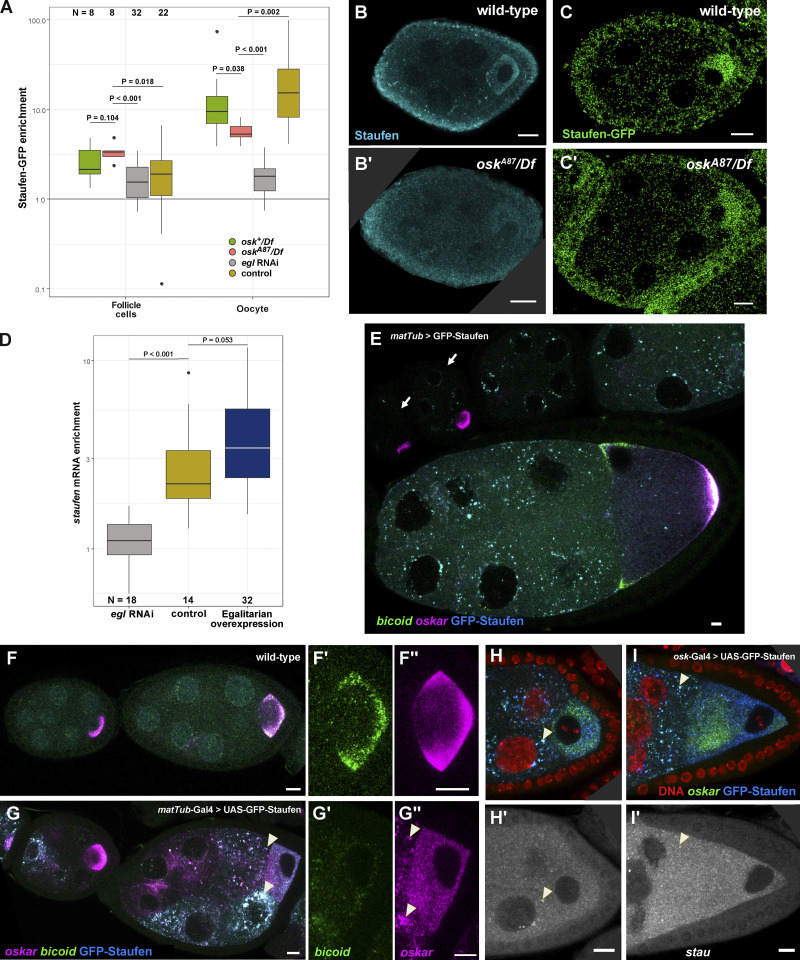
Regulated recruitment and activity of motor proteins is essential for intracellular transport of cargoes, including messenger ribonucleoprotein complexes (RNPs). Here, we show that orchestration of oskar RNP transport in the Drosophila germline relies on interplay between two double-stranded RNA-binding proteins, Staufen and the dynein adaptor Egalitarian (Egl). We find that Staufen antagonizes Egl-mediated transport of oskar mRNA by dynein both in vitro and in vivo. Following delivery of nurse cell-synthesized oskar mRNA into the oocyte by dynein, recruitment of Staufen to the RNPs results in dissociation of Egl and a switch to kinesin-1-mediated translocation of the mRNA to its final destination at the posterior pole of the oocyte. We additionally show that Egl associates with staufen (stau) mRNA in the nurse cells, mediating its enrichment and translation in the ooplasm. Our observations identify a novel feed-forward mechanism, whereby dynein-dependent accumulation of stau mRNA, and thus protein, in the oocyte enables motor switching on oskar RNPs by downregulating dynein activity.


Conflict of interest statement

Disclosures: All authors have completed and submitted the ICMJE Form for Disclosure of Potential Conflicts of Interest. A. Ephrussi reported grants from Deutsche Forschungsgemeinschaft (DFG) during the conduct of the study. No other disclosures were reported.

Figures

Figure 1.
Figure 1.
oskar mRNA localization and transport are impaired in stau mutants. (A–A″) Endogenous oskar mRNA localization (shown in blue [low intensity RNA signal]/yellow [high intensity RNA signal]) in wild-type (A), stau null (A′), and Tm1-I/C null stage 9 oocytes (A″; anterior to the left and posterior to the right). Scale bar represents 20 μm. In stau null oocytes, there is a pronounced anterior accumulation of oskar in addition to the normal posterior localization; in Tm1-I/C mutant oocytes, oskar mRNA is predominantly enriched at the anterior cortex. (B) Polarity distribution of oskar-MS2 RNP runs in control RNAi and stau RNAi ooplasmic extracts. Numbers indicate the number of oskar RNP runs measured for all motile oskar RNPs and for RNPs categorized by relative RNA content (gray boxes, see Materials and methods; Video 1 and 2). (C) Relative mRNA content of motile oskar-MS2 RNPs in control RNAi and stau RNAi ooplasmic extracts. Pink, green, and blue indicate the fraction of oskar RNPs with one, two, or more relative RNA units, respectively (see Materials and methods). Numbers show the number of oskar RNPs in each category. (D) Association of Khc and oskar RNPs in situ in the nurse cells and the oocyte of control RNAi versus stau RNAi samples. The number of analyzed oskar RNPs was 15,506 (control, nurse cells), 14,409 (stau RNAi, nurse cells), 7,973 (control, oocytes), and 11,183 (stau RNAi, oocytes). (E and F) Speed (E) and run length (F) of motile oskar-MS2 RNPs toward the plus or minus ends of microtubules in control RNAi and stau RNAi ooplasmic extracts. RNPs are stratified by relative RNA content (C). Percentage values above boxplots (E and F) indicate differences in mean travel distance between stau and control RNAi extracts. In stau RNAi extracts there were too few motile oskar-MS2 RNPs with >2 RNA units to establish a statistical trend (C, E, and F). P-values of Fisher exact (B) or pairwise Mann–Whitney U-tests (D–F) are shown.
Figure S1.
Figure S1.
Expression of the different Staufen transgenes and their effects on oskar mRNA localization. (A) oskar mRNA localization (shown in blue/yellow) in stage 9 stauR9/stauD3 mutant oocytes. Scale bars represent 20 μm. (B) Mean (green) and variance (SD, magenta) of oskar mRNA distribution in stage 9 and stage 10–11 oocytes. Numbers indicate the number of oocytes analyzed for each condition and scale bar represents 10% of anteroposterior axis length. Anterior is to the left, posterior is to the right. The three panels in the top left (stage 9 wild-type, stau RNAi and stauR9/stauD3) are reused in Fig. S3. (C) Position of oskar center-of-mass along the AP axis in stage 9 and stage 10–11 oocytes for each condition. 0 is the geometric center of the oocyte, with the posterior pole located at 58%. (D) oskar mRNA content distribution in wild-type (blue), stau null (red) and dominant BicD1 mutant (purple) nurse cells and oocytes. In the nurse cells, most oskar RNPs contain 1–2 copies of the RNA, consistent with previous reports (Little et al., 2015). (E) Oskar protein expression in Staufen null oocytes coexpressing transgenic Staufen-GFP or GFP-Staufen. Scale bars represent 20 μm. (F) Western blot detection of Staufen in wild-type (lane 1), stauR9/stauD3 (2), Staufen-GFP (3), matTub > GFP-Staufen (4), stau RNAi (5), and control RNAi (6) ovarian lysates. Endogenous Staufen (∼150 kD) indicated with red arrowhead. Staufen-GFP (lane 3) migrates slower than the untagged protein (green arrowhead), while matTub > GFP-Staufen migrates faster due to an N-terminal truncation of Staufen (blue arrowhead; Micklem et al., 2000). Note the similar distribution of oskar in stauR9/stauD3 and in stau RNAi oocytes (B and C), despite residual Staufen expression in Staufen RNAi ovarian lysates (F, lanes 5 and 6). The overexpressing GFP-Staufen (F, lane 4) transgene largely rescues oskar mislocalization (B and C) and Oskar protein expression defects (E) observed in stau null mutants. The Staufen-GFP transgene, expressed at low levels (I, lane 3), rescues oskar mRNA localization at stage 9, but the RNA is not maintained at the posterior at stages 10–11 (B and C), likely due to insufficient Oskar protein expression at the posterior (E), which is essential for oskar mRNA anchoring at the oocyte posterior during the later stages (Vanzo and Ephrussi, 2002). Source data are available for this figure: SourceData FS1.
Figure 2.
Figure 2.
Staufen impairs oskar mRNA transport and dynein activation in vitro. (A) Kymographs (time-distance plots) exemplifying the behavior of oskar RNA and dynein in the presence (filled circle) and absence (open circle) of Staufen; in both conditions, Egl, BicD, and dynactin are also present but not fluorescently labeled. Minus end is to the left and plus end to the right. (B–G) Quantification of motile properties of oskar mRNA (B–D) and dynein (E–G) in the conditions shown in A. Charts show frequency of processive movements (B and E), total number of microtubule (MT) binding events (C and F), and fraction of microtubule-binding events that result in processive motility (D and G). Plots show the mean ± SD of values from 15 individual microtubules (represented by black circles) derived from analysis of 586–1,341 single RNA particles (B–D) or 1,247–2,207 single dynein particles (E–G) per condition. Statistical significance and P-values were determined with Mann–Whitney tests. (H–I) Quantification of effect of Staufen on number of processive dynein complexes and fraction of dynein-microtubule binding events that result in processive motility for motor activated by dynactin, oskar RNA, and Egl/BicD (H) vs. motor activated by dynactin and BicD2N (I). Values for conditions with Staufen were normalized to the corresponding condition without Staufen to obtain relative metrics. Plots show the mean ± SD of values from 10 individual microtubules (represented by black circles) derived from analysis of 536-925 single dynein particles per condition. Statistical significance and P-values were determined with Brown-Forsythe and Welch ANOVA tests.
Figure S2.
Figure S2.
Egl and BicD are required for formation of transport-competent dynein-RNA complexes in vitro. (A) Example kymographs (time-distance plots) showing behavior of dynein and oskar RNA in the presence and absence of Egl and BicD; in each condition, dynactin is also present but not fluorescently labeled (filled and empty circles represent the presence and absence of indicated proteins, respectively). Egl and BicD were co-expressed and co-purified (see Materials and methods). (B and C) Charts showing the total number of microtubule (MT) binding events for oskar RNA (B) and number of processive dynein complexes on microtubules under conditions shown in A. In B, values were corrected for non-specific background binding of oskar RNA to the imaging surface as described in Materials and methods. Plots show the mean ± SD of values from 10 individual microtubules (represented by black circles) derived from 183 to 918 single RNA particles (B) or from 384 to 1,725 single dynein particles (C) per condition. Statistical significance and P-values were determined with Mann–Whitney tests. (D) Example kymographs (time-distance plots) showing the behavior of dynein activated by oskar RNA, Egl/BicD, and dynactin or by BicD2N and dynactin in the presence (filled circle) and absence (open circle) of Staufen. Quantification of these data is presented in Fig. 2, H and I.
Figure 3.
Figure 3.
Mutual interference of Staufen and Egl during oskar mRNA localization. (A–F) Representative micrographs of the distribution of endogenous oskar mRNA (detected by smFISH; blue—low intensity RNA signal, yellow—high intensity RNA signal, see scale in F) in stage 9 oocytes (anterior to the left, posterior to the right) showing ectopic anterior accumulation of oskar mRNA in oocytes lacking Staufen protein (B; see also Fig. 1 A′), overexpressing Egl (C) or heterozygous for one copy of the dominant, hyperactive BicD1 allele (E). Anterior accumulation of oskar is not observed in wild-type oocytes (A), or upon Staufen overexpression in Egl-overexpressing oocytes (D) or BicD1/+ oocytes (F). Scale bar represents 20 μm.
Figure S3.
Figure S3.
Suppression of oskar mislocalization. (A–F) Average distribution of oskar mRNA (green) and variability of the distribution (SD, magenta) in stage 9 oocytes of the indicated genotypes. N indicates the number of oocytes analyzed. Scale bar represents 10% of anteroposterior axis length. Anterior is to the left, posterior to the right. Arrowheads indicate the ectopic localization of oskar mRNA at the anterior cortex. The A, B, and E panels (stage 9 wild-type, stauR9/stauD3 and stau RNAi) are reused in Fig. S1. (G) Distribution of the observed oskar center-of-mass in stage 9 stau RNAi oocytes in the presence of two (red) or one (yellow) functional copies of egl as a function of oocyte size, used here as a proxy for developmental stage. Solid lines show the best linear fits to the data. The equation and the square of the goodness-of-fit (R2) are indicated. Such moderate rescue was expected as oskar RNPs entering the oocyte are thought to be associated with Egl. Note that there is no significant linear correlation between oocyte size (developmental stage) and the position of oskar mRNA center-of-mass in stau RNAi (red), indicating an oskar mislocalization phenotype. There is a moderate correlation with a significant slope (underlined) when one copy of egl is removed (yellow), indicating progressive posterior localization of oskar mRNA at stage 9. (H–K) Average distribution of oskar mRNA (green) and variability of the distribution (SD, magenta) in stage 9 oocytes of the indicated genotypes. N indicates the number of oocytes analyzed. Scale bar represents 10% of anteroposterior axis length. Anterior is to the left, posterior to the right. Arrowheads indicate the ectopic localization of oskar mRNA at the anterior cortex.
Figure 4.
Figure 4.
Staufen interferes with association of Egl with oskar RNPs in the oocyte. (A and A′) Staufen-GFP (green) distribution in the nurse cell cytoplasm (left-hand images) and oocyte (right-hand images) before (stage 6–7, A) and during (stage 8–9, A′) the posterior localization of endogenous oskar mRNA (magenta) in the oocyte of the same egg chamber. (B and B′) Quantification of Staufen-GFP association with oskar RNPs in nurse cell cytoplasm and ooplasm at the indicated stages as a function of RNA copy number. The number of analyzed oskar RNPs was 3,105 (stage 5–7 nurse cells), 8,749 (stage 9 nurse cells), 3,814 (stage 5–7 oocytes) and 14,054 (stage 9 oocytes). (C and C′) Distribution of Egl-GFP (green) in the nurse cell cytoplasm (left-hand images) and oocyte (right-hand images) before (stage 7, C) and during (stage 9, C′) the posterior localization of endogenous oskar mRNA (magenta) in the oocyte of the same egg chamber. In A, A′, C, and C′, nurse cell images are shown with different brightness/contrast settings for better visualization of the signals. Cyan arrows point to examples of colocalization. Scale bars represent 10 μm. (D and D′) Quantification of association of Egl-GFP with oskar RNPs in nurse cell cytoplasm and ooplasm at the indicated stages. The number of analyzed oskar RNPs was 8,511 (stage 5–7 nurse cells), 10,210 (stage 9 nurse cells), 6,897 (stage 5–7 oocytes), and 15,869 (stage 9 oocytes). (E–F′) Association of Egl-GFP with oskar RNPs in the stage 9 oocyte in the indicated genotypes. In A–B′, endogenous Staufen was absent (stauR9/stauD3 background), whereas in C–F′ endogenous, unlabeled Egl was present. 15,869–26,232 oskar RNPs were analyzed for each genotype. Error bars represent 95% confidence intervals in B, B′, and D–F′. In D and E, datapoints are slightly offset in the x-axis to facilitate comparison. The size of the circles is proportional to the relative abundance of each category of oskar RNPs within the overall population. Triangles indicate that the fraction of GFP-positive oskar RNPs is not significantly different from zero (P > 0.01, one sample t test, B, B′, and D–F′). In B′, D′, E′, and F′, GFP protein intensities on oskar RNPs in the oocytes are normalized to GFP signal intensities in the corresponding nurse cells. (G) Fold-enrichment of oskar mRNA precipitated from UV crosslinked Egl-GFP ovarian extracts relative to the GFP control in control and stau RNAi. Different colors represent different experiments (four in total). Solid (P < 0.05) or dashed lines (P > 0.05) connect paired data (pairwise Student’s t test was used to determine significance). Empty triangles indicate non-significant enrichment (P > 0.05) of oskar relative to the GFP control. Error bars show SD of three replicates per experiment.
Figure S4.
Figure S4.
Staufen and Egl association with oskar RNPs. (A) oskar mRNA content distribution in wild-type nurse cells and oocytes at stages 5–7 (yellow) and 9 (blue) of oogenesis. In the nurse cells, most oskar RNPs contain 1–2 copies of the RNA, consistent with previous reports (Little et al., 2015). oskar RNP content increases in the oocyte: at stages 5–7 most RNPs contain 4+ copies of the RNA, which decreases to >2 copies during oskar posterior localization (stage 9; Little et al., 2015). (B) Normalized Staufen-GFP signal intensity as a function of oskar mRNA content at stages 5–7 (yellow) and stage 9 (blue and red). Staufen-GFP signal intensity was measured in the complete absence (yellow and blue) or presence (red) of endogenous, unlabeled Staufen. Fitted linear models showing the correlation between Staufen-GFP signal intensity and oskar mRNA copy number as solid lines and equations. Underscored parameters of the models are significantly different from zero (P < 0.05). The slopes of the two fitted models are significantly different (P < 0.0001, ANOVA). (C) Mean signal intensity of Staufen-GFP measured at multiple locations throughout developing oocytes. Size of the oocytes (x-axis) is used as a proxy of developmental time and, along with morphological features, for staging of the oocytes (shaded areas as indicated in the panel). (D) Western blot showing Egl protein detected by anti-Egl antibody in the indicated genotypes. Tubulin was used as a loading control. (E) Normalized Egl-GFP signal intensity as a function of oskar mRNA content at stages 5–7 (yellow) and stage 9 (blue). Fitted linear models showing the correlation between Egl-GFP signal intensity and oskar mRNA copy number as solid lines and equations (top—stages 5–7, bottom—stage 9). Underscored parameters of the models are significantly different from zero (P < 0.05). The slopes of the two fitted models are significantly different (P < 0.0001, ANOVA). (F–G′) Association of Egl-GFP with oskar RNPs in oocytes with BicD1 (purple) or BicD2 (pink) alleles (F and F′) or expressing stau (red) or control (brown) RNAi (G and G′). Note that knock-down of Staufen results in similar retention of Egl on oskar RNPs as in the complete absence of Staufen protein (Fig. 4, E and E′). In E, G, and G′, egg chambers expressed a single copy of Egl-GFP in the presence of two endogenous wild-type egl alleles, except in the case of the rescued egl mutants (G, egl1/egl2, green). Although we observed a slightly elevated fraction of Egl positive RNPs when unlabeled Egl was absent (egl1/egl2, green), larger RNPs containing 16+ copies of oskar mRNA displayed no significant association with Egl (G) and the relative amounts of Egl on oskar RNPs were identical to what was observed in the presence of endogenous, unlabeled Egl (G′, blue). 14,321–43,299 oskar RNPs per genotype were analyzed. Triangles indicate that the fraction of GFP-positive oskar RNPs is not significantly different from zero (P > 0.01, one sample t test). In F, datapoints are slightly offset in the x-axis to facilitate comparison. (H) Western blot of input lysates and eluates after RNA immunoprecipitation in the presence (lane 3) or the absence (lane 4) of Staufen. Bait proteins—monomeric EGFP (lane 1), GFP-Staufen (lane 2) and Egl-GFP (lanes 3,4)—are detected by anti-GFP antibody. Anti-tubulin staining was used to monitor potential contamination of the eluates. In D and H, blue and yellow indicate low and high intensity of signal, respectively. Source data are available for this figure: SourceData S4.
Figure 5.
Figure 5.
Effect of Egl overexpression on oskar RNP localization and composition. (A–B′) Images of oskar mRNA with Egl-GFP (A and A′) or Staufen-GFP (B and B′) in stage 9 egg chambers strongly overexpressing Egl in the germline (osk-Gal4>UAS-Egl). In both genotypes, abnormally large RNPs containing oskar mRNA are observed in the nurse cells and in the anterior region of the oocyte. These RNPs frequently colocalize with Egl-GFP but rarely co-localize with Staufen-GFP. Scale bar represents 10 μm. (C–D′) Quantification of Egl-GFP and Staufen-GFP association with oskar RNPs as a function of RNA copy number. In C and D, datapoints are slightly offset in the x-axis to facilitate comparison. Error bars represent 95% confidence intervals and the size of the circles is proportional to the relative abundance of each category of oskar RNP within the overall population. Triangles indicate that the fraction of GFP-positive oskar RNPs is not significantly different from zero (P > 0.01, one sample t test, C–D′). 26,432–33,698 oskar RNPs per genotype were analyzed. (E) Relative distribution of oskar RNPs grouped by RNA content along the first 30% of the anteroposterior axis of stage 9 oocytes. In the wild-type control, <1% of large (65+ copies) oskar RNPs are close to the oocyte anterior (first bin). When Egl is overexpressed, ∼10% of large oskar RNPs are near the oocyte anterior (first bin, arrow), while the rest of the oocyte has a distribution of oskar RNPs similar to the control (Fig. S5). 27,946 and 33,698 oskar RNPs in control and Egl overexpressing oocytes were analyzed, respectively.
Figure S5.
Figure S5.
Localization of oskar RNPs along the anteroposterior axis. Relative distribution of oskar RNPs grouped by RNA content along the anteroposterior axis in wild-type and in Egl overexpressing (osk-Gal4>UAS-Egl) oocytes.
Figure 6.
Figure 6.
Association of the dynein machinery with oskar RNPs. (A–C) Localization of GFP tagged versions (green) of BicD (A), p50/dynamitin (B), and Dhc (C) with respect to oskar mRNA (magenta) in egg chambers during mid-oogenesis. Scale bar represents 10 μm. Note that the transient oskar accumulation in the center and at the anterior pole of early stage 9 oocytes is normal and disappears by the end of stage 9. Empty regions created upon rotating the images are shown in dark gray (A and B). (D and E) Quantification of oskar RNP association with the indicated proteins in the nurse cells and the oocyte as a function of RNA copy number. The number of analyzed oskar RNPs was 12,945 (GFP-Dhc, nurse cells), 34,428 (GFP-p50/dynamitin, nurse cells), 8,573 (BicD-GFP, nurse cells), 27,936 (GFP-Dhc, oocytes), 37,992 (GFP-p50/dynamitin, oocytes), and 20,456 (BicD-GFP, oocytes). (FG) Quantification of oskar RNP association with GFP-Dhc and BicD-GFP in oocytes of indicated genotypes. 29,428, 32,132 and 33,638 oskar RNPs were analyzed in control, stau RNAi and Egl overexpressing oocytes, respectively (F′). 20,456 and 32,517 oskar RNPs were analyzed in control and stau RNAi oocytes, respectively (G′). Error bars represent 95% confidence intervals, and the size of the circles is proportional to the relative abundance of each category of oskar RNP within the overall population. In D, F, and F′, datapoints are slightly offset in the x-axis to facilitate comparison. Triangles indicate that the fraction of GFP-positive oskar RNPs is not significantly different from zero (P > 0.01, one sample t test, D–G).
Figure 7.
Figure 7.
Egl promotes ooplasmic enrichment of Staufen mRNA and protein. (A–C′) Distribution of endogenous Staufen protein (A and A′; magenta), oskar mRNA (B and B′; green), and stau mRNA (C and C′; cyan) in early egg chambers (stage 4–6) expressing control RNAi (A–C) or egl RNAi driven by osk-Gal4 (A′, B′, and C′). Oocytes of egl RNAi egg chambers contain trace amounts of oskar mRNA, likely due to the action of residual Egl protein. (D) Quantification of early oocyte enrichment of stau mRNA or Staufen protein relative to the sibling nurse cells. Stage 4–6 oocytes were identified through their enrichment of oskar mRNA. Enrichment of stau RNA or Staufen protein in the somatic follicle cells, which do not express the shRNA, is used as a control. 19 control RNAi and 16 egl RNAi samples were analyzed, respectively (also indicated on the panel). (E and E′) Localization of stau mRNA in wild-type and Egl-overexpressing stage 8 oocytes. (F and G) Fraction of stau RNPs associating with Egl in the nurse cells and in the oocyte (F), and Staufen in the oocyte (G). (F) The number of analyzed stau RNPs was 4,075 (stage 5–7 nurse cells), 3,420 (stage 9 nurse cells), 1,283 (stage 5–7 oocytes), and 1,455 (stage 9 oocytes). (G) 8,597 and 4,114 stau RNPs were analyzed in nurse cells and in oocytes, respectively. Transparent bar for nurse cells indicates non-significant difference to zero (P > 0.01, one sample t test; D and F). P values of unpaired, two-sample Student’s t test are shown. Scale bars represent 10 μm.
Figure S6.
Figure S6.
Localization of Staufen protein and stau mRNA in the egg chamber. (A) Enrichment of Staufen-GFP signal in stage 4–6 oocytes with one (green) or no (red) functional oskar alleles expressing oskar mRNA, and in oocytes expressing egl RNAi (gray) or control RNAi (brown). Enrichment is relative to the sibling nurse cells in the egg chamber. Enrichment of Staufen-GFP in somatic follicle cells, which do not express the shRNA, serves as a control. P values of pairwise Student’s t test are shown. Note that complete lack of oskar mRNA, an abundant binding partner of Staufen, has only a moderate effect on Staufen enrichment in the developing oocyte (also observed in A-B′), whereas knock-down of Egl almost completely abolishes Staufen ooplasmic accumulation. (B–C′) Staufen protein expression detected by immunofluorescence (blue, B and B′) or by the fluorescent reporter Staufen-GFP (C and C′, green) in early egg chambers (stage 4–6) in the presence (B and C) and complete absence of oskar mRNA (B′ and C′). Note that lack of oskar in the oocyte blocks progression of oogenesis beyond stage 6 (Jenny et al., 2006). Scale bars represent 10 μm. (D) Quantification of the enrichment of stau mRNA in the oocyte in egl RNAi (gray), control RNAi (yellow) and Egl overexpressing stage 4–6 egg chambers (dark blue). Note that an excess of Egl has a minuscule effect on stau RNA accumulation in the oocyte, suggesting that in the wild type, most of the stau mRNA expressed in the nurse cells is transported into the oocyte. (E) Expression of GFP-Staufen under the control of maternal tubulin promoter. GFP-Staufen (cyan) can hardly be detected in early egg chambers (highlighted by arrows), and the forming aggregates remain associated with the nurse cell nuclei until mid-oogenesis. (F–G″) Early egg chambers overexpressing GFP-Staufen (F, blue) under control of the matTub-Gal4 driver. Note that in control oocytes of a similar stage (E–E″), and in oocytes expressing low levels of GFP-Staufen (F, left egg chamber), oskar mRNA (E″ and F″, magenta) is enriched. Enrichment of oskar and bicoid (E′, F′, green) mRNAs is greatly reduced in oocytes expressing high levels of GFP-Staufen (F, right egg chamber). This phenotype is reproducibly observed in >30 egg chambers derived from three separate crosses. (H–I′) Egg chambers in early and mid-oogenesis overexpressing GFP-Staufen (blue) under control of the oskar-Gal4 driver from the beginning of oogenesis. The vast majority of such egg chambers fail to develop beyond stage 6, likely as a consequence of greatly reduced ooplasmic accumulation of oskar mRNA (green), which appears to be trapped in the nurse cells in large aggregates associated with GFP-Staufen (some examples are highlighted by arrowheads in F–H′). Such aggregates of endogenous Staufen are not observed in wild-type egg chambers (E–E″). Similarly, no accumulation of stau mRNA in the oocyte is observed in these oskar-Gal4>UAS-GFP-Staufen oocytes (G′ and H′), where stau mRNA levels are uniformly high in the germline (compare the signal in the follicle cell layer to that in the nurse cells and in the oocyte; see Fig. 7). (H and H′) In the oocytes occasionally escaping early developmental arrest, we invariably observed failure in nuclear migration from the posterior to the anterior, reflecting a defect in repolarization of the oocyte microtubule network (Januschke et al., 2006). Consequently, oskar mRNA remains in the center of these oocytes, which—although they complete oogenesis—fail to result in viable progeny. These phenotypes are reproducibly observed in >30 egg chambers derived from three separate crosses. (E–I′) Scale bars represent 5 μm. (B′ and H–I′) Empty regions created upon rotating the images are shown in dark gray.

Similar articles

Cited by

References

    1. Abouward, R., and Schiavo G.. 2021. Walking the line: Mechanisms underlying directional mRNA transport and localisation in neurons and beyond. Cell. Mol. Life Sci. 78:2665–2681. 10.1007/s00018-020-03724-3 - DOI - PMC - PubMed
    1. Amrute-Nayak, M., and Bullock S.L.. 2012. Single-molecule assays reveal that RNA localization signals regulate dynein-dynactin copy number on individual transcript cargoes. Nat. Cell Biol. 14:416–423. 10.1038/ncb2446 - DOI - PMC - PubMed
    1. Bauer, K.E., Segura I., Gaspar I., Scheuss V., Illig C., Ammer G., Hutten S., Basyuk E., Fernández-Moya S.M., Ehses J., et al. . 2019. Live cell imaging reveals 3′-UTR dependent mRNA sorting to synapses. Nat. Commun. 10:3178. 10.1038/s41467-019-11123-x - DOI - PMC - PubMed
    1. Baumann, S., Pohlmann T., Jungbluth M., Brachmann A., and Feldbrügge M.. 2012. Kinesin-3 and dynein mediate microtubule-dependent co-transport of mRNPs and endosomes. J. Cell Sci. 125:2740–2752. 10.1242/jcs.101212 - DOI - PubMed
    1. Benaglia, T., Chauveau D., Hunter D.R., and Young D.. 2009. Mixtools : An R package for analyzing finite mixture models. J. Stat. Softw. 32. 10.18637/jss.v032.i06 - DOI

Publication types

LinkOut - more resources