

Mitochondrial metabolic reprogramming-mediated immunogenic cell death reveals immune and prognostic features of clear cell renal cell carcinoma
- PMID: 37213288
- PMCID: PMC10196130
- DOI: 10.3389/fonc.2023.1146657
Mitochondrial metabolic reprogramming-mediated immunogenic cell death reveals immune and prognostic features of clear cell renal cell carcinoma
Abstract
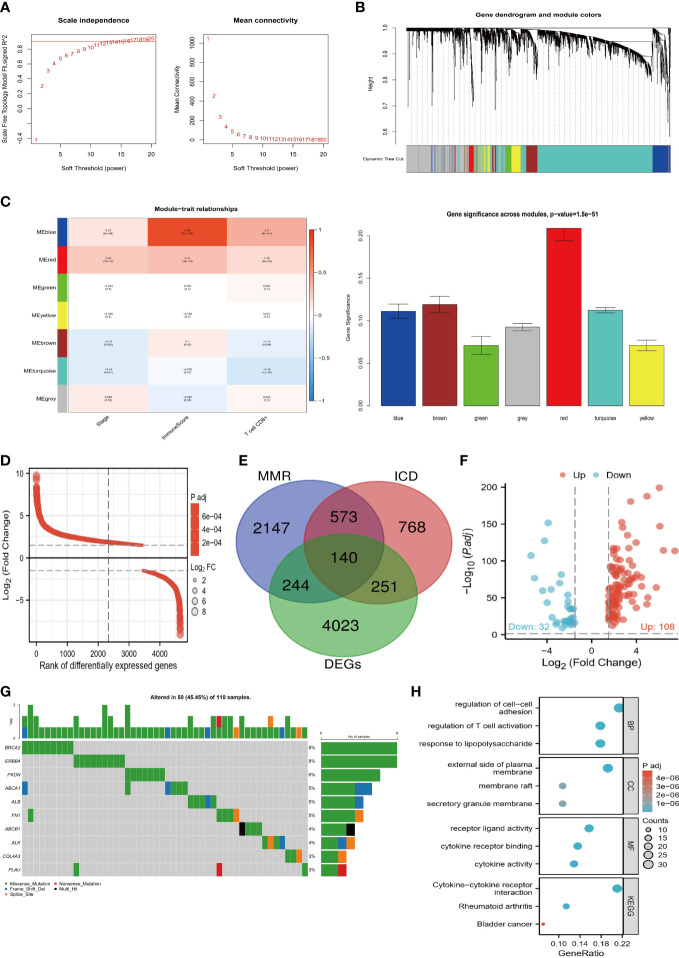
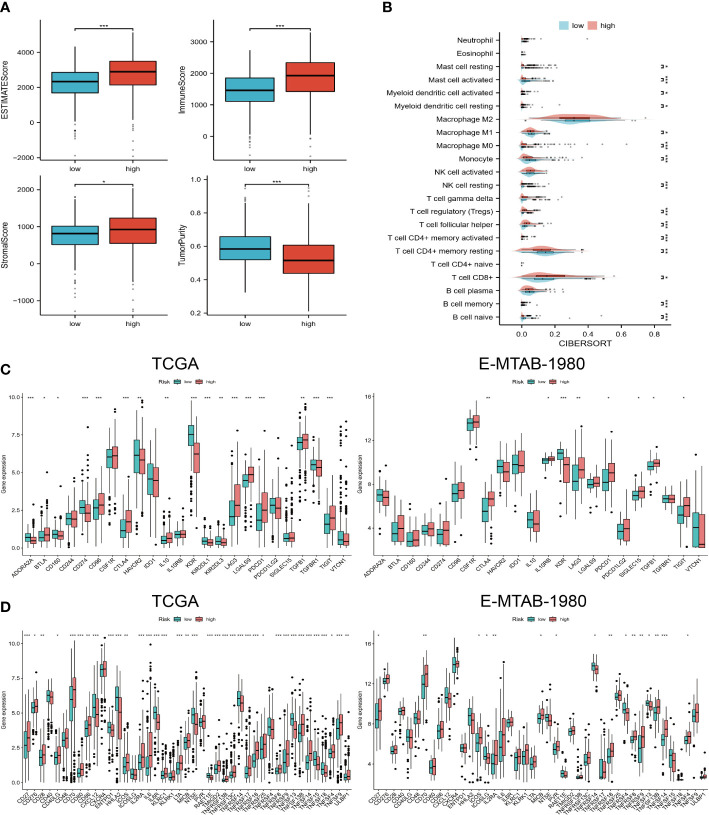
Background: Mitochondrial metabolic reprogramming (MMR)-mediated immunogenic cell death (ICD) is closely related to the tumor microenvironment (TME). Our purpose was to reveal the TME characteristics of clear cell renal cell carcinoma (ccRCC) by using them.
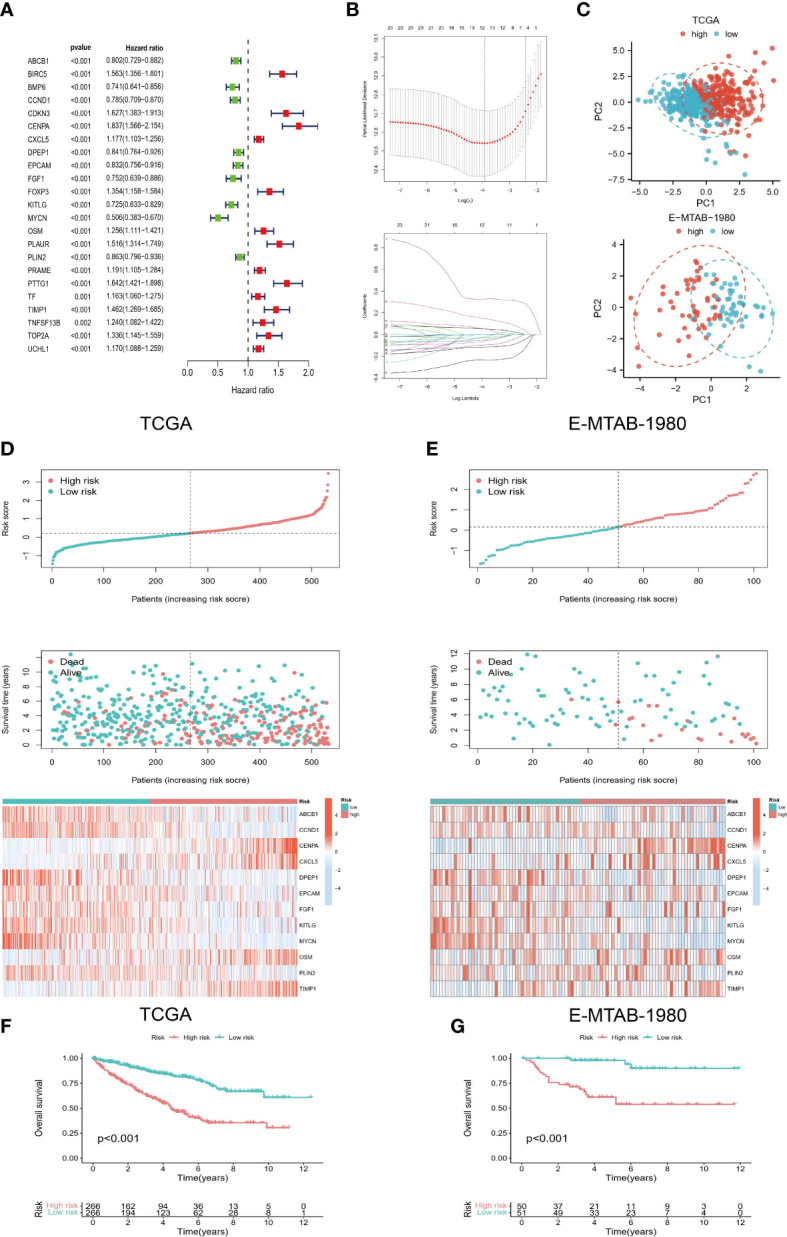
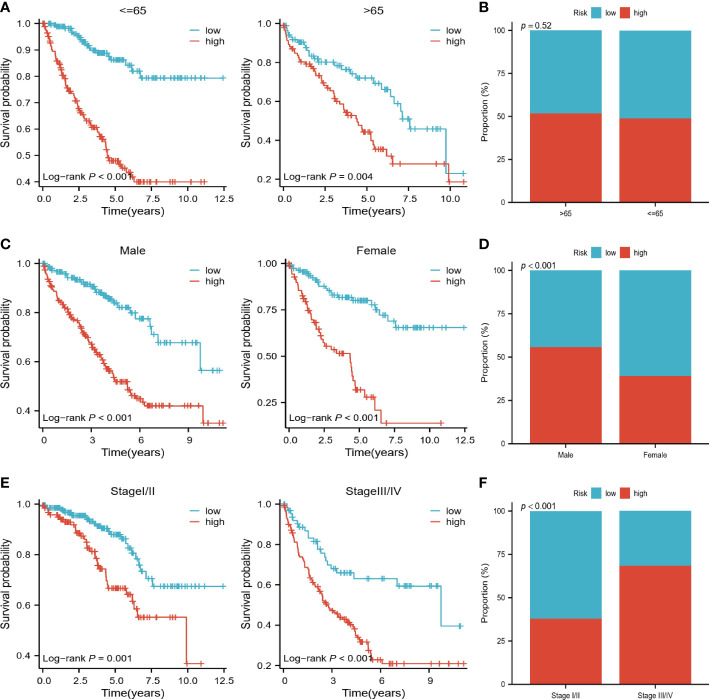
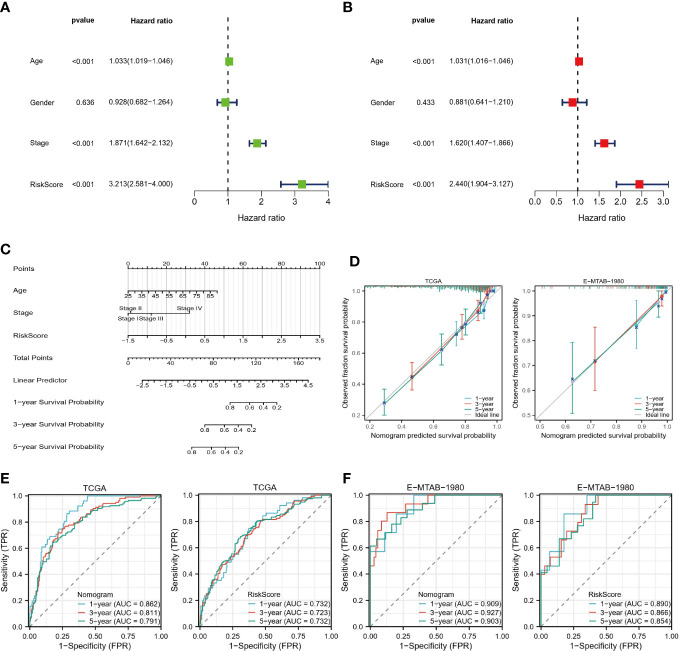
Methods: Target genes were obtained by intersecting ccRCC differentially expressed genes (DEGs, tumor VS normal) with MMR and ICD-related genes. For the risk model, univariate COX regression and K-M survival analysis were used to identify genes most associated with overall survival (OS). Differences in the TME, function, tumor mutational load (TMB), and microsatellite instability (MSI) between high and low-risk groups were subsequently compared. Using risk scores and clinical variables, a nomogram was constructed. Predictive performance was evaluated by calibration plots and receiver operating characteristics (ROC).
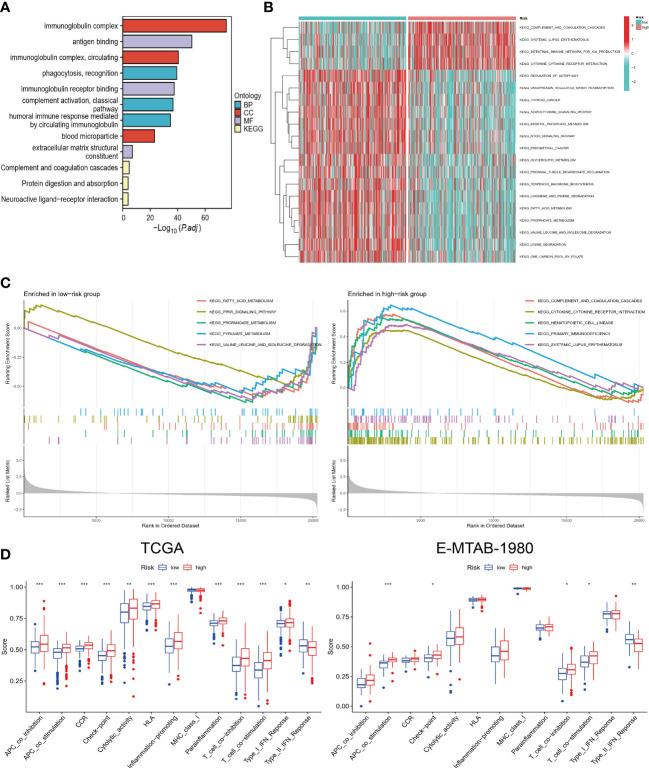
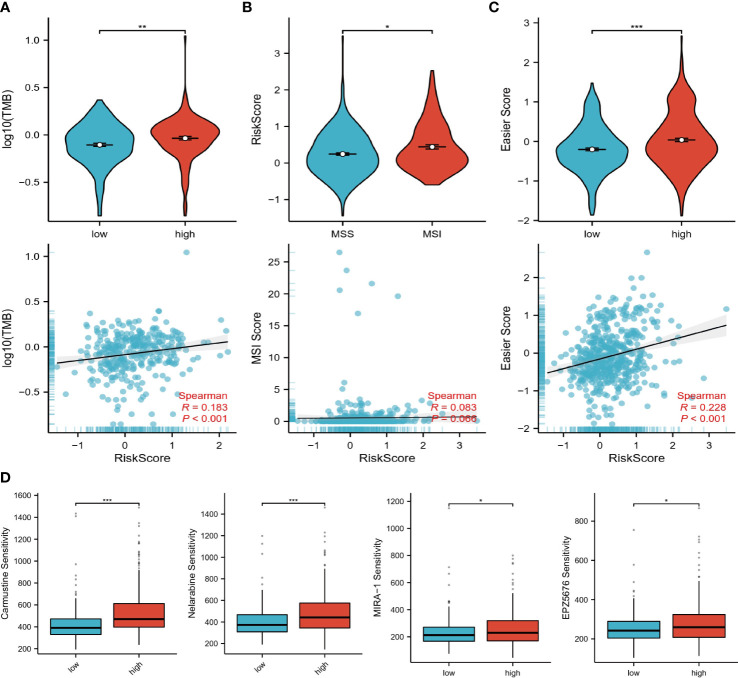
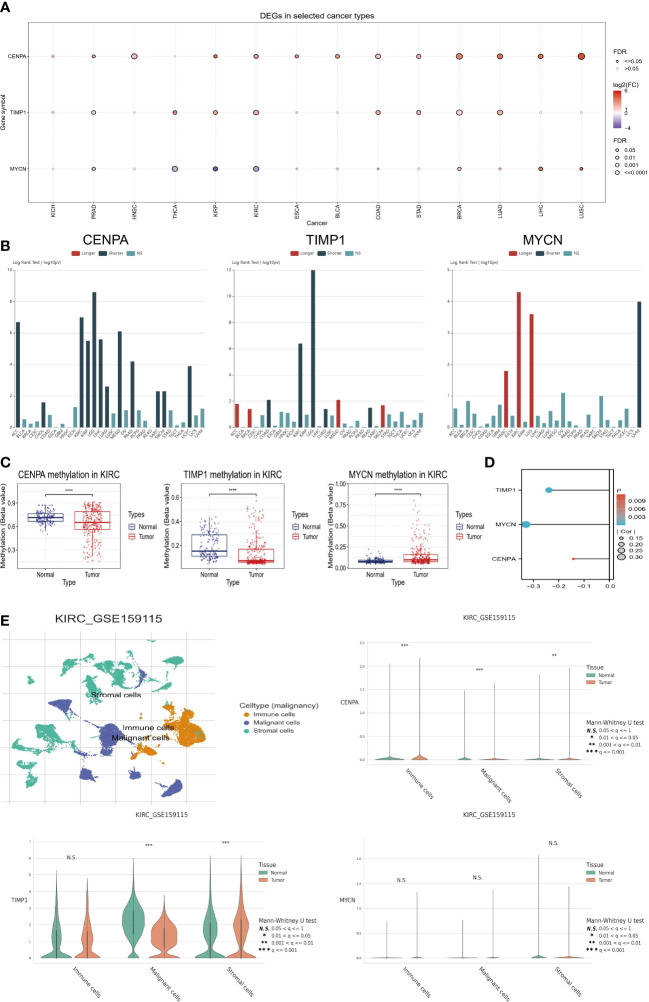
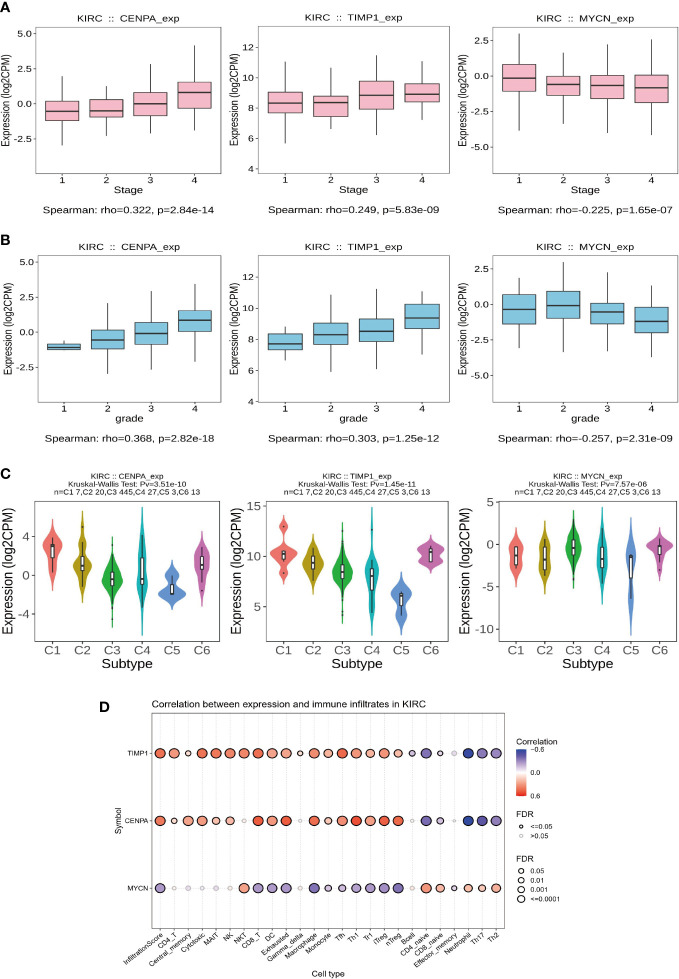
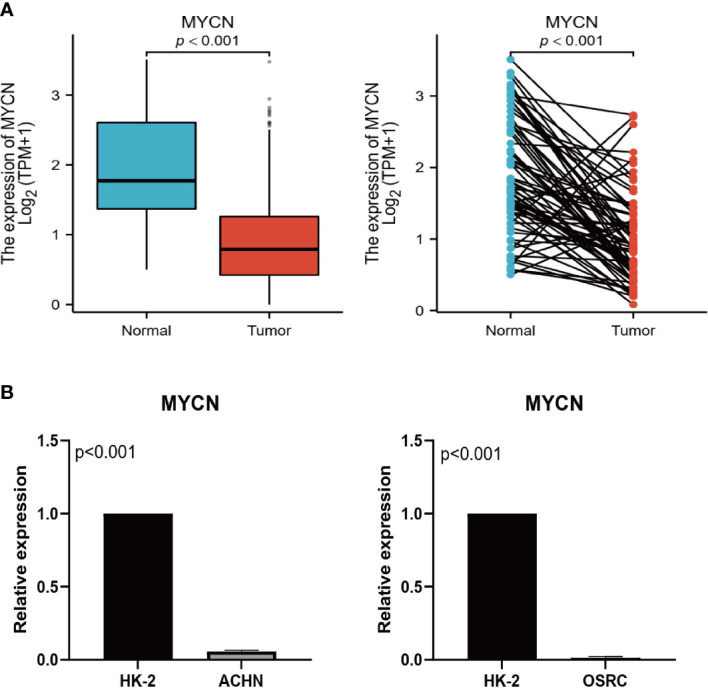
Results: We screened 140 DEGs, including 12 prognostic genes for the construction of risk models. We found that the immune score, immune cell infiltration abundance, and TMB and MSI scores were higher in the high-risk group. Thus, high-risk populations would benefit more from immunotherapy. We also identified the three genes (CENPA, TIMP1, and MYCN) as potential therapeutic targets, of which MYCN is a novel biomarker. Additionally, the nomogram performed well in both TCGA (1-year AUC=0.862) and E-MTAB-1980 cohorts (1-year AUC=0.909).
Conclusions: Our model and nomogram allow accurate prediction of patients' prognoses and immunotherapy responses.
Keywords: TME; clear cell renal cell carcinoma; immunogenic cell death; immunotherapy; mitochondrial metabolic reprogramming.
Copyright © 2023 Yang, Xiong, Li, Liu, Deng, Liu and Fu.
Conflict of interest statement
The authors declare that the research was conducted in the absence of any commercial or financial relationships that could be construed as a potential conflict of interest.
Figures
Similar articles
-
Identification of cuproptosis-related subtypes, construction of a prognosis model, and tumor microenvironment landscape in gastric cancer.Front Immunol. 2022 Nov 21;13:1056932. doi: 10.3389/fimmu.2022.1056932. eCollection 2022. Front Immunol. 2022. PMID: 36479114 Free PMC article.
-
Computational construction of TME-related lncRNAs signature for predicting prognosis and immunotherapy response in clear cell renal cell carcinoma.J Clin Lab Anal. 2022 Aug;36(8):e24582. doi: 10.1002/jcla.24582. Epub 2022 Jul 8. J Clin Lab Anal. 2022. PMID: 35808868 Free PMC article.
-
Development of a TGF-β signaling-related genes signature to predict clinical prognosis and immunotherapy responses in clear cell renal cell carcinoma.Front Oncol. 2023 Jan 27;13:1124080. doi: 10.3389/fonc.2023.1124080. eCollection 2023. Front Oncol. 2023. PMID: 36776317 Free PMC article.
-
Neutrophil extracellular traps-associated modification patterns depict the tumor microenvironment, precision immunotherapy, and prognosis of clear cell renal cell carcinoma.Front Oncol. 2022 Dec 22;12:1094248. doi: 10.3389/fonc.2022.1094248. eCollection 2022. Front Oncol. 2022. PMID: 36620592 Free PMC article.
-
The Landscape of the Tumor Microenvironment in Skin Cutaneous Melanoma Reveals a Prognostic and Immunotherapeutically Relevant Gene Signature.Front Cell Dev Biol. 2021 Oct 1;9:739594. doi: 10.3389/fcell.2021.739594. eCollection 2021. Front Cell Dev Biol. 2021. PMID: 34660598 Free PMC article.
Cited by
-
Natural Compounds in Cancer Therapy: Revealing the Role of Flavonoids in Renal Cell Carcinoma Treatment.Biomolecules. 2025 Apr 25;15(5):620. doi: 10.3390/biom15050620. Biomolecules. 2025. PMID: 40427513 Free PMC article. Review.
-
MZB1 regulates the immune microenvironment and inhibits ovarian cancer cell migration.Open Med (Wars). 2025 May 13;20(1):20251174. doi: 10.1515/med-2025-1174. eCollection 2025. Open Med (Wars). 2025. PMID: 40391075 Free PMC article.
-
Identification of immunogenic cell death-related genes involved in Alzheimer's disease.Sci Rep. 2024 Feb 15;14(1):3786. doi: 10.1038/s41598-024-54357-6. Sci Rep. 2024. PMID: 38360834 Free PMC article.
References
LinkOut - more resources
Full Text Sources
Research Materials
Miscellaneous